-
Python 数据可视化 boxplot
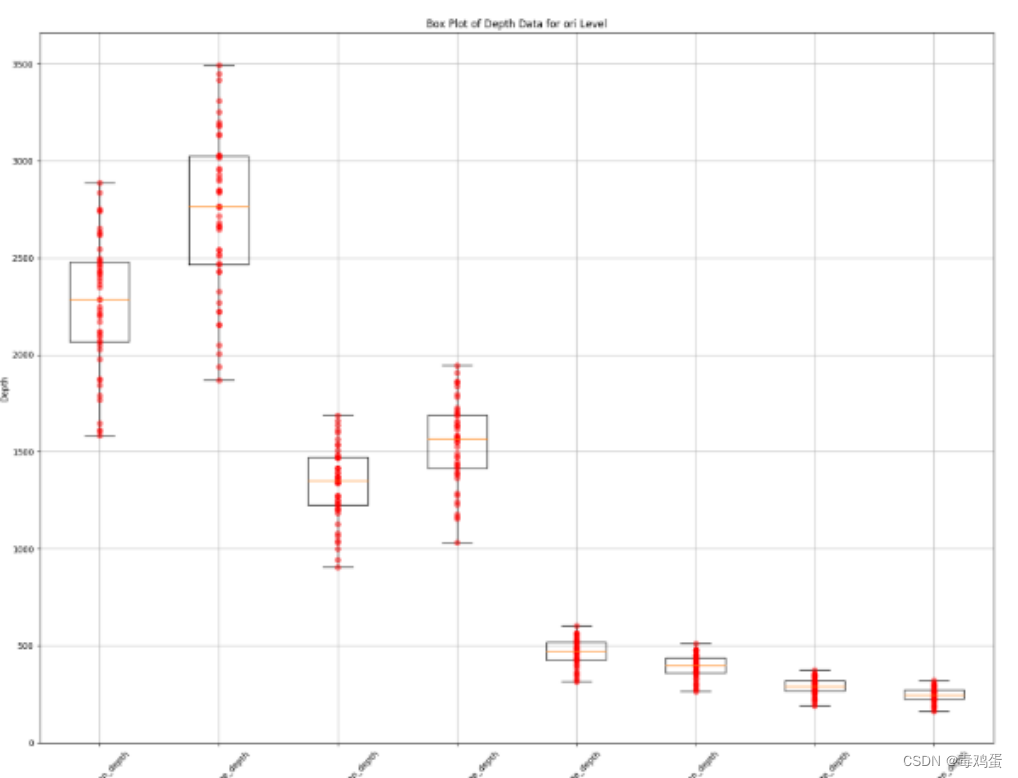
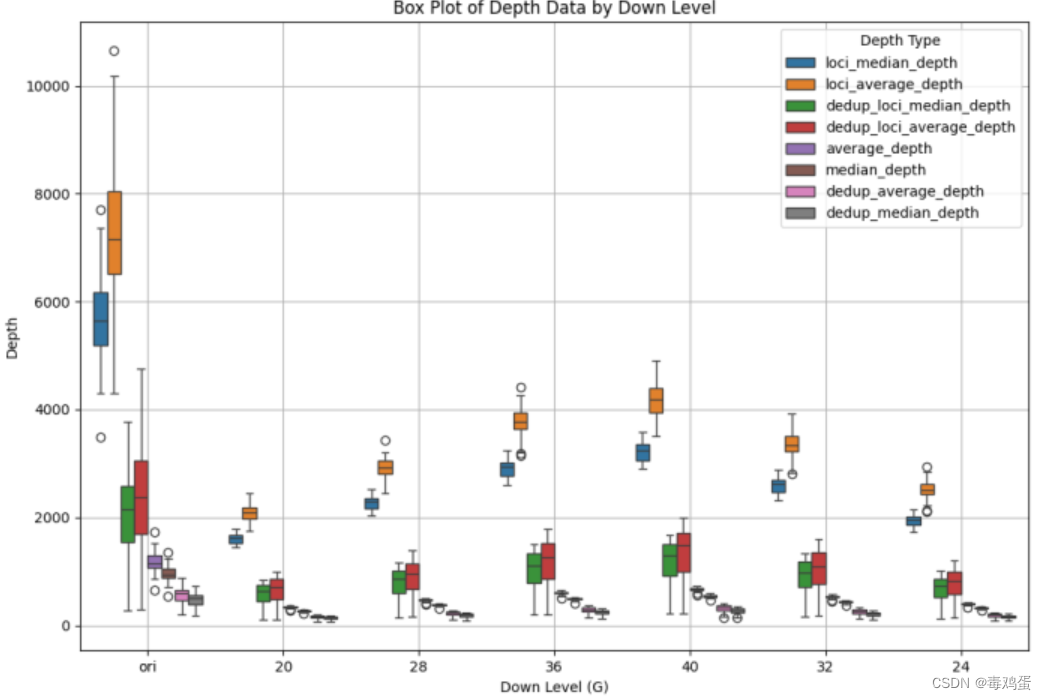
import pandas as pd import matplotlib.pyplot as plt import numpy as np import seaborn as sns # 读取 TSV 文件 df = pd.read_csv('result.tsv', sep='\t') normal_df = df[df["sample_name"].str.contains("normal")] tumor_df = df[df["sample_name"].str.contains("tumor")] # sns.boxplot(x='down_level', y='loci_median_depth', data=tumor_df) # sns.boxplot(x='down_level', y='loci_average_depth', data=tumor_df) def box_plot_1(df): # 提取数据 sample_data = {} # 遍历 DataFrame,根据样本和级别组织数据 for index, row in df.iterrows(): sample = row['sample_name'] level = row['down_level'] data = row['loci_median_depth'] # 这里假设你想绘制 loci_median_depth 列的箱线图 # 如果样本不在字典中,则将其添加为新的键,并将数据存储为列表 if sample not in sample_data: sample_data[sample] = {} if level not in sample_data[sample]: sample_data[sample][level] = [] sample_data[sample][level].append(data) # 绘制箱线图 plt.figure(figsize=(100, 60)) # 遍历样本和级别,绘制箱线图 position = 1 for sample, levels in sample_data.items(): for level, data in levels.items(): label = f"{sample} - {level}" plt.boxplot(data, positions=[position], labels=[label]) position += 1 plt.ylabel('Depth') plt.title('Box Plot of Depth Data by Sample and Level') plt.grid(True) plt.xticks(rotation=45) # 保存箱线图为文件 plt.savefig('boxplot.png') plt.show() def box_plot_2(df, target_header_list): lvl_list = ["ori", '40', '36', '32', '28', '24', '20'] for level_to_plot in lvl_list: filtered_df = df[df['down_level'] == level_to_plot] plt.figure(figsize=(20, 15)) # plt.boxplot(filtered_df[' loci_median_depth']) plt.boxplot([filtered_df[i] for i in target_header_list], labels=target_header_list) plt.ylabel('Depth') # plt.xlabel(level_to_plot) plt.title(f'Box Plot of Depth Data for {level_to_plot} Level') plt.grid(True) plt.xticks(rotation=45) # 在箱线图上绘制每个数据点 for i, col in enumerate(target_header_list): x = [i + 1] * len(filtered_df[col]) plt.plot(x, filtered_df[col], 'ro', alpha=0.5) # 保存箱线图为文件 plt.savefig(f'boxplot_{level_to_plot}.png') # 显示箱线图 plt.show() def box_plot_3(df, target_header_list): # 选择要包含在 y 轴中的列 y_columns = target_header_list # 将这些列数据整合到一个单独的 DataFrame 中 y_data = df[y_columns] # 使用 pd.melt() 函数将其转换为适合绘制箱线图的格式 melted_df = pd.melt(df, id_vars=['down_level'], value_vars=y_columns, var_name='Depth_Type', value_name='Depth') # 使用 seaborn 绘制箱线图 plt.figure(figsize=(12, 8)) sns.boxplot(x='down_level', y='Depth', hue='Depth_Type', data=melted_df, dodge=True) plt.xlabel('Down Level (G)') plt.ylabel('Depth') plt.title('Box Plot of Depth Data by Down Level') plt.legend(title='Depth Type', loc='upper right') plt.grid(True) plt.savefig(f'boxplot.png') print() lvl_list = ["ori", '40', '36', '32', '28', '24', '20'] target_header_list = ["loci_median_depth", "loci_average_depth", "dedup_loci_median_depth", "dedup_loci_average_depth", "average_depth", "median_depth", "dedup_average_depth", "dedup_median_depth"] # box_plot(tumor_df, target_header_list) # box_plot_3(normal_df, target_header_list) # box_plot_2(normal_df, target_header_list) box_plot_3(normal_df, target_header_list) # box_plot_1(normal_df)- 1
- 2
- 3
- 4
- 5
- 6
- 7
- 8
- 9
- 10
- 11
- 12
- 13
- 14
- 15
- 16
- 17
- 18
- 19
- 20
- 21
- 22
- 23
- 24
- 25
- 26
- 27
- 28
- 29
- 30
- 31
- 32
- 33
- 34
- 35
- 36
- 37
- 38
- 39
- 40
- 41
- 42
- 43
- 44
- 45
- 46
- 47
- 48
- 49
- 50
- 51
- 52
- 53
- 54
- 55
- 56
- 57
- 58
- 59
- 60
- 61
- 62
- 63
- 64
- 65
- 66
- 67
- 68
- 69
- 70
- 71
- 72
- 73
- 74
- 75
- 76
- 77
- 78
- 79
- 80
- 81
- 82
- 83
- 84
- 85
- 86
- 87
- 88
- 89
- 90
- 91
- 92
- 93
- 94
- 95
- 96
- 97
- 98
- 99
- 100
- 101
- 102
- 103
- 104
- 105
- 106
- 107
- 108
- 109
- 110
box_plot_2

box_plot_3

参考:
https://blog.csdn.net/Artoria_QZH/article/details/102790740
R:https://www.modb.pro/db/451162 -
相关阅读:
dubbo协议与triple协议的对比
《Python+Kivy(App开发)从入门到实践》自学笔记:高级UX部件——RecycleView遍历并显示数据
实操 | 制造一个OOM,生成jvm的dump文件,并通过jvisualvm工具解析
2022 极术通讯-2021中国云数据中心考察报告发布,Arm服务器促进多元算力发展
uboot启动学习笔记 一 初步了解及相关概念
jQuery
苍穹外卖 -- day11 - Apache ECharts- 营业额统计- 用户统计- 订单统计- 销量排名Top10
大漠插件(二、Qt使用插件时注意事项)
学习笔记:机器学习之支持向量机(SVM)(上)
Apache DolphinScheduler的工作流传参
- 原文地址:https://blog.csdn.net/dujidan/article/details/138188933