提醒
- pandas 读取 excel 文件,需要
xlrd >= 1.1.0
代码
import sklearn
import pandas as pd
import numpy as np
import matplotlib.pyplot as plt
import seaborn as sns
from sklearn.linear_model import LogisticRegression
from sklearn.model_selection import train_test_split
from sklearn.metrics import confusion_matrix
from sklearn.model_selection import cross_val_score
from sklearn.metrics import roc_curve, f1_score, precision_score, recall_score
from sklearn.svm import SVC
pd.set_option('display.max_rows', None)
pd.set_option('display.max_columns', None)
pd.set_option('display.width', None)
pd.set_option('display.max_colwidth', -1)
数据处理
path = "./2019-2020年.xlsx"
df = pd.read_excel(path)
df = df.drop(['OTT', 'TOAST subtypes'],axis=1)
df = df.dropna(axis=0, how='any')
df = df.reset_index()
df['Coronary heart disease'][74] = 0
df.head(10)
| index | Sex | Medication before thrombolytic therapy | Age | Age.1 | Periventricular White Matter | Deep White Matter | The degree of WMH | Smoking | Drinking | AtrialFibrillation | Hypertension | Diabetes | Hyperlipidemia | Coronary heart disease | Heart failure | Stroke | TIA | WBC | N | L | NLR | HB | PLT | PCV | PT | INR | APTT | TT | Fibrinogen | Emergency blood sugar | Fasting blood glucose | Creatinine | HDL | LDL | HDL/LDL比值 | Cholesterol | Triglyceride | HBLAC | HCY | DNT | sBP | dBP | Baseline NIHSS score | Hemorrhagic Transformation(HT) | Early neurological deterioration (END) | Prognosis&0 (mRS0-2:0;3-6:1) | 90dmRS | Prognosis&1(mRS0-1:0;2-6:1) |
|---|
| 0 | 5 | 0 | 2 | 58.0 | 0.0 | 2 | 1 | 2 | 1.0 | 1.0 | 0.0 | 1 | 0 | 0 | 0 | 0 | 0 | 0.0 | 8.4 | 5.44 | 2.35 | 2.310000 | 141 | 266 | 38 | 10.7 | 0.92 | 34.5 | 14.9 | 3.52 | 5.68 | 5.11 | 66.2 | 0.92 | 3.15 | 0.290000 | 4.27 | 1.99 | 4.6 | 11.0 | 25.0 | 177.0 | 90.0 | 8 | 0 | 0 | 1 | 5 | 1 |
|---|
| 1 | 6 | 0 | 2 | 53.0 | 0.0 | 2 | 1 | 2 | 1.0 | 1.0 | 0.0 | 1 | 0 | 0 | 0 | 0 | 0 | 0.0 | 11.6 | 6.5 | 4.04 | 1.608911 | 145 | 259 | 45 | 9.9 | 0.86 | 30.6 | 15.3 | 3.34 | 6.38 | 6.13 | 74.0 | 1.46 | 4.54 | 0.321586 | 6.11 | 2.39 | 5.5 | 11.3 | 37.0 | 166.0 | 98.0 | 4 | 0 | 0 | 0 | 1 | 0 |
|---|
| 2 | 10 | 1 | 2 | 77.0 | 1.0 | 3 | 3 | 3 | 0.0 | 0.0 | 0.0 | 0 | 0 | 0 | 0 | 0 | 1 | 0.0 | 7.83 | 6.63 | 0.59 | 11.237288 | 103 | 225 | 30 | 9.2 | 0.80 | 28 | 14.9 | 4.82 | 1.76 | 7.11 | 107.9 | 1.19 | 1.03 | 1.155340 | 2.28 | 0.41 | 5.0 | 13.0 | 30.0 | 150.0 | 90.0 | 9 | 0 | 0 | 0 | 0 | 0 |
|---|
| 3 | 13 | 0 | 2 | 65.0 | 0.0 | 1 | 0 | 1 | 1.0 | 0.0 | 0.0 | 0 | 0 | 0 | 0 | 0 | 0 | 0.0 | 13.84 | 10.3 | 2.33 | 4.420601 | 156 | 327 | 47 | 11.8 | 1.02 | 38.3 | 12.4 | 2.69 | 8.22 | 4.98 | 85.0 | 0.72 | 2.27 | 0.317181 | 3.51 | 1.34 | 5.7 | 12.0 | 43.0 | 150.0 | 102.0 | 9 | 0 | 0 | 0 | 2 | 1 |
|---|
| 4 | 26 | 1 | 2 | 66.0 | 0.0 | 2 | 3 | 3 | 0.0 | 0.0 | 0.0 | 1 | 1 | 0 | 0 | 0 | 1 | 0.0 | 4.73 | 11.6 | 2.56 | 4.531250 | 142 | 281 | 40 | 12.5 | 1.08 | 26.1 | 18.2 | 2.49 | 6.36 | 4.02 | 95.0 | 0.82 | 2.94 | 0.278912 | 4.14 | 1.67 | 5.9 | 22.0 | 17.0 | 147.0 | 75.0 | 3 | 0 | 0 | 0 | 2 | 1 |
|---|
| 5 | 27 | 0 | 2 | 74.0 | 1.0 | 3 | 3 | 3 | 0.0 | 0.0 | 0.0 | 1 | 0 | 0 | 1 | 0 | 0 | 0.0 | 6.18 | 5.07 | 0.54 | 9.388889 | 110 | 152 | 32 | 12.3 | 1.06 | 26.7 | 16.1 | 3.33 | 10.40 | 7.07 | 80.3 | 1.11 | 2.71 | 0.409594 | 4.20 | 0.97 | 6.7 | 19.0 | 22.0 | 125.0 | 80.0 | 5 | 0 | 0 | 0 | 0 | 0 |
|---|
| 6 | 30 | 1 | 2 | 70.0 | 1.0 | 1 | 1 | 1 | 1.0 | 1.0 | 0.0 | 0 | 0 | 0 | 0 | 0 | 0 | 0.0 | 8.5 | 6.19 | 1.61 | 3.844720 | 136 | 258 | 40 | 11.3 | 0.97 | 31.4 | 14.1 | 4.29 | 5.98 | 4.40 | 54.3 | 1.13 | 3.59 | 0.314763 | 5.28 | 1.00 | 5.4 | 15.0 | 15.0 | 147.0 | 89.0 | 2 | 0 | 0 | 0 | 0 | 0 |
|---|
| 7 | 34 | 0 | 1 | 58.0 | 0.0 | 1 | 1 | 1 | 1.0 | 1.0 | 0.0 | 1 | 1 | 0 | 0 | 0 | 0 | 0.0 | 9.48 | 6.85 | 1.73 | 3.959538 | 152 | 203 | 47 | 10.1 | 0.87 | 31.2 | 12.7 | 4.43 | 10.46 | 8.37 | 72.8 | 1.42 | 3.55 | 0.400000 | 4.96 | 1.51 | 8.6 | 13.4 | 43.0 | 160.0 | 105.0 | 4 | 0 | 0 | 0 | 1 | 0 |
|---|
| 8 | 36 | 1 | 2 | 65.0 | 0.0 | 1 | 1 | 1 | 0.0 | 0.0 | 1.0 | 0 | 0 | 0 | 0 | 0 | 1 | 0.0 | 15.6 | 11.52 | 3.06 | 3.764706 | 142 | 256 | 43 | 11.2 | 0.96 | 31.4 | 11.6 | 4.63 | 7.32 | 4.75 | 50.6 | 1.08 | 2.02 | 0.534653 | 3.52 | 1.02 | 6.5 | 21.0 | 15.0 | 110.0 | 76.0 | 11 | 0 | 0 | 1 | 3 | 1 |
|---|
| 9 | 38 | 0 | 2 | 82.0 | 1.0 | 3 | 3 | 3 | 1.0 | 0.0 | 0.0 | 1 | 0 | 0 | 0 | 0 | 0 | 0.0 | 10.31 | 8.12 | 1.24 | 6.548387 | 125 | 247 | 37 | 11.3 | 0.97 | 31.4 | 12.5 | 4.79 | 6.25 | 4.88 | 72.2 | 1.65 | 2.56 | 0.644531 | 4.21 | 0.77 | 5.6 | 18.7 | 25.0 | 220.0 | 104.0 | 4 | 0 | 0 | 0 | 1 | 0 |
|---|
分离 data 和 label
label_1 = df.columns[-3]
label_2 = df.columns[-1]
label1_data = df[label_1]
label2_data = df[label_2]
data = df[[column for column in df.columns if column not in [label_1, label_2]]]
data.drop(['index'], axis=1, inplace=True)
data.drop(['90dmRS'], axis=1, inplace=True)
data.head(10)
| Sex | Medication before thrombolytic therapy | Age | Age.1 | Periventricular White Matter | Deep White Matter | The degree of WMH | Smoking | Drinking | AtrialFibrillation | Hypertension | Diabetes | Hyperlipidemia | Coronary heart disease | Heart failure | Stroke | TIA | WBC | N | L | NLR | HB | PLT | PCV | PT | INR | APTT | TT | Fibrinogen | Emergency blood sugar | Fasting blood glucose | Creatinine | HDL | LDL | HDL/LDL比值 | Cholesterol | Triglyceride | HBLAC | HCY | DNT | sBP | dBP | Baseline NIHSS score | Hemorrhagic Transformation(HT) | Early neurological deterioration (END) |
|---|
| 0 | 0 | 2 | 58.0 | 0.0 | 2 | 1 | 2 | 1.0 | 1.0 | 0.0 | 1 | 0 | 0 | 0 | 0 | 0 | 0.0 | 8.4 | 5.44 | 2.35 | 2.310000 | 141 | 266 | 38 | 10.7 | 0.92 | 34.5 | 14.9 | 3.52 | 5.68 | 5.11 | 66.2 | 0.92 | 3.15 | 0.290000 | 4.27 | 1.99 | 4.6 | 11.0 | 25.0 | 177.0 | 90.0 | 8 | 0 | 0 |
|---|
| 1 | 0 | 2 | 53.0 | 0.0 | 2 | 1 | 2 | 1.0 | 1.0 | 0.0 | 1 | 0 | 0 | 0 | 0 | 0 | 0.0 | 11.6 | 6.5 | 4.04 | 1.608911 | 145 | 259 | 45 | 9.9 | 0.86 | 30.6 | 15.3 | 3.34 | 6.38 | 6.13 | 74.0 | 1.46 | 4.54 | 0.321586 | 6.11 | 2.39 | 5.5 | 11.3 | 37.0 | 166.0 | 98.0 | 4 | 0 | 0 |
|---|
| 2 | 1 | 2 | 77.0 | 1.0 | 3 | 3 | 3 | 0.0 | 0.0 | 0.0 | 0 | 0 | 0 | 0 | 0 | 1 | 0.0 | 7.83 | 6.63 | 0.59 | 11.237288 | 103 | 225 | 30 | 9.2 | 0.80 | 28 | 14.9 | 4.82 | 1.76 | 7.11 | 107.9 | 1.19 | 1.03 | 1.155340 | 2.28 | 0.41 | 5.0 | 13.0 | 30.0 | 150.0 | 90.0 | 9 | 0 | 0 |
|---|
| 3 | 0 | 2 | 65.0 | 0.0 | 1 | 0 | 1 | 1.0 | 0.0 | 0.0 | 0 | 0 | 0 | 0 | 0 | 0 | 0.0 | 13.84 | 10.3 | 2.33 | 4.420601 | 156 | 327 | 47 | 11.8 | 1.02 | 38.3 | 12.4 | 2.69 | 8.22 | 4.98 | 85.0 | 0.72 | 2.27 | 0.317181 | 3.51 | 1.34 | 5.7 | 12.0 | 43.0 | 150.0 | 102.0 | 9 | 0 | 0 |
|---|
| 4 | 1 | 2 | 66.0 | 0.0 | 2 | 3 | 3 | 0.0 | 0.0 | 0.0 | 1 | 1 | 0 | 0 | 0 | 1 | 0.0 | 4.73 | 11.6 | 2.56 | 4.531250 | 142 | 281 | 40 | 12.5 | 1.08 | 26.1 | 18.2 | 2.49 | 6.36 | 4.02 | 95.0 | 0.82 | 2.94 | 0.278912 | 4.14 | 1.67 | 5.9 | 22.0 | 17.0 | 147.0 | 75.0 | 3 | 0 | 0 |
|---|
| 5 | 0 | 2 | 74.0 | 1.0 | 3 | 3 | 3 | 0.0 | 0.0 | 0.0 | 1 | 0 | 0 | 1 | 0 | 0 | 0.0 | 6.18 | 5.07 | 0.54 | 9.388889 | 110 | 152 | 32 | 12.3 | 1.06 | 26.7 | 16.1 | 3.33 | 10.40 | 7.07 | 80.3 | 1.11 | 2.71 | 0.409594 | 4.20 | 0.97 | 6.7 | 19.0 | 22.0 | 125.0 | 80.0 | 5 | 0 | 0 |
|---|
| 6 | 1 | 2 | 70.0 | 1.0 | 1 | 1 | 1 | 1.0 | 1.0 | 0.0 | 0 | 0 | 0 | 0 | 0 | 0 | 0.0 | 8.5 | 6.19 | 1.61 | 3.844720 | 136 | 258 | 40 | 11.3 | 0.97 | 31.4 | 14.1 | 4.29 | 5.98 | 4.40 | 54.3 | 1.13 | 3.59 | 0.314763 | 5.28 | 1.00 | 5.4 | 15.0 | 15.0 | 147.0 | 89.0 | 2 | 0 | 0 |
|---|
| 7 | 0 | 1 | 58.0 | 0.0 | 1 | 1 | 1 | 1.0 | 1.0 | 0.0 | 1 | 1 | 0 | 0 | 0 | 0 | 0.0 | 9.48 | 6.85 | 1.73 | 3.959538 | 152 | 203 | 47 | 10.1 | 0.87 | 31.2 | 12.7 | 4.43 | 10.46 | 8.37 | 72.8 | 1.42 | 3.55 | 0.400000 | 4.96 | 1.51 | 8.6 | 13.4 | 43.0 | 160.0 | 105.0 | 4 | 0 | 0 |
|---|
| 8 | 1 | 2 | 65.0 | 0.0 | 1 | 1 | 1 | 0.0 | 0.0 | 1.0 | 0 | 0 | 0 | 0 | 0 | 1 | 0.0 | 15.6 | 11.52 | 3.06 | 3.764706 | 142 | 256 | 43 | 11.2 | 0.96 | 31.4 | 11.6 | 4.63 | 7.32 | 4.75 | 50.6 | 1.08 | 2.02 | 0.534653 | 3.52 | 1.02 | 6.5 | 21.0 | 15.0 | 110.0 | 76.0 | 11 | 0 | 0 |
|---|
| 9 | 0 | 2 | 82.0 | 1.0 | 3 | 3 | 3 | 1.0 | 0.0 | 0.0 | 1 | 0 | 0 | 0 | 0 | 0 | 0.0 | 10.31 | 8.12 | 1.24 | 6.548387 | 125 | 247 | 37 | 11.3 | 0.97 | 31.4 | 12.5 | 4.79 | 6.25 | 4.88 | 72.2 | 1.65 | 2.56 | 0.644531 | 4.21 | 0.77 | 5.6 | 18.7 | 25.0 | 220.0 | 104.0 | 4 | 0 | 0 |
|---|
训练
def train(model, dataset, labelset):
x_train, x_test, y_train, y_test = train_test_split(dataset.values
, labelset.values
, test_size=0.2
, train_size=0.8
, shuffle=True
, stratify=labelset)
model.fit(x_train, y_train)
score = model.score(x_test, y_test)
accs = cross_val_score(model, dataset.values, labelset.values, verbose=0)
print(f'validation acc is: {score}')
print(f'cross validation accs are: {accs}')
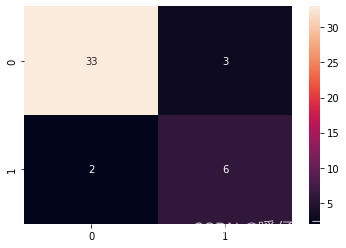
y_pre = model.predict(x_test)
metri = confusion_matrix(y_test, y_pre)
sns.heatmap(metri, annot=True)
plt.show()
'
svc1 = SVC(class_weight='balanced', kernel='linear')
train(svc1, data, label1_data)
validation acc is: 0.8863636363636364
cross validation accs are: [0.90909091 0.69767442 0.76744186 0.88372093 0.88372093]
svc2 = SVC(class_weight='balanced', kernel='linear')
train(svc2, data, label2_data)
validation acc is: 0.8863636363636364
cross validation accs are: [0.81818182 0.6744186  0.72093023 0.76744186 0.76744186]

lr1 = LogisticRegression(class_weight='balanced', max_iter=10000)
train(lr1, data, label1_data)
validation acc is: 0.9090909090909091
cross validation accs are: [0.81818182 0.6744186  0.76744186 0.88372093 0.90697674]

lr2 = LogisticRegression(class_weight='balanced', max_iter=10000)
train(lr2, data, label2_data)
validation acc is: 0.8863636363636364
cross validation accs are: [0.79545455 0.69767442 0.74418605 0.6744186  0.81395349]

各种 feature 的重要性
def make_coef_dictNdf(data_columns, coef):
name_influence_dic = {string: imp for string, imp in zip(data_columns, coef.squeeze())}
name_influence_df = pd.DataFrame(data=name_influence_dic, index=['influence']).T
return name_influence_dic, name_influence_df
'
def write(filename, name_df_dic):
writer = pd.ExcelWriter(filename)
for k,v in name_df_dic.items():
v.to_excel(writer, sheet_name=k)
writer.save()
writer.close()
def plot(figsize, name_influence_df_lst, img_label_lst, title):
plt.figure(figsize=figsize)
for i in range(len(name_influence_df_lst)):
df = name_influence_df_lst[i]
plt.bar(x=df.index, height=df['influence'],label=img_label_lst[i])
plt.title(title)
plt.legend()
plt.xticks(rotation=90)
'
lr1_dic, lr1_df = make_coef_dictNdf(data.columns, lr1.coef_)
lr2_dic, lr2_df = make_coef_dictNdf(data.columns, lr2.coef_)
svc1_dic, svc1_df = make_coef_dictNdf(data.columns, svc1.coef_)
svc2_dic, svc2_df = make_coef_dictNdf(data.columns, svc2.coef_)
write("逻辑回归.xlsx", {'label1': lr1_df, 'label2': lr2_df})
write("SVM.xlsx", {'label1': svc1_df, 'label2': svc2_df})
plot((20,10), [lr1_df, lr2_df], ['label1', 'label2'], 'lr')

plot((20,10), [svc1_df, svc2_df], ['label1', 'label2'], 'svm')
