-
Pandas 内置的 10 种画图方法
Pandas是非常常见的数据分析工具,我们一般都会处理好处理数据然后使用searbon或matplotlib来进行绘制。但在Pandas内部就已经集成了matplotlib,本文将展示Pandas内部的画图方法。画图类型
在
Pandas中内置的画图方法如下几类,基本上都是常见的画图方法。每种方法底层也是使用的matplotlib。-
line: line plot (default) -
bar: vertical bar plot -
barh: horizontal bar plot -
hist: histogram -
box: boxplot -
density/kde: Density Estimation -
area: area plot -
pie: pie plot -
scatter: scatter plot -
hexbin: hexbin plot
在进行画图时我们有两种调用方法:
- df = pd.DataFrame({
- 'sales': [3, 3, 3, 9, 10, 6],
- 'signups': [4, 5, 6, 10, 12, 13],
- 'visits': [20, 42, 28, 62, 81, 50],
- }, index=pd.date_range(start='2018/01/01', end='2018/07/01', freq='M'))
- # 方法1,这种方法是高层API,需要制定kind
- df.plot(kind='area')
- # 方法2,这种方法是底层API
- df.plot.area()

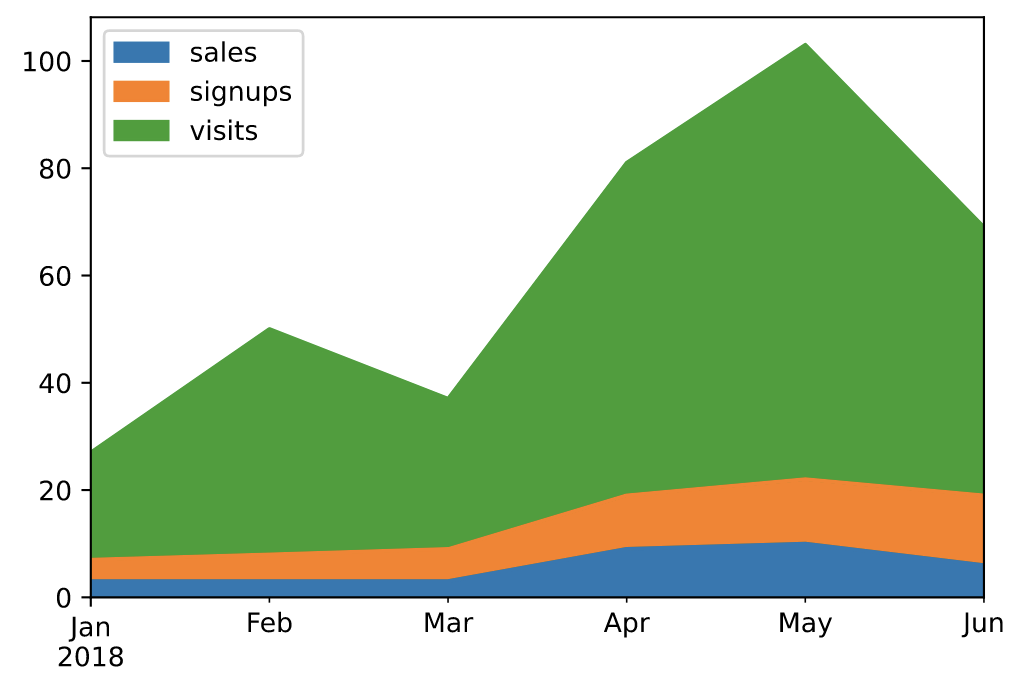
面积图(area)
面积图直观地显示定量数据下面的区域面积,该函数包装了 matplotlib 的area函数。
https://pandas.pydata.org/docs/reference/api/pandas.DataFrame.plot.area.html
- # 默认为面积堆叠
- d
-
-
相关阅读:
设计模式 - 组合模式理解及示例
Django测试环境搭建及ORM查询(创建外键|跨表查询|双下划线查询 )
如何让你的量化交易系统具有概率优势,具有正向收益预期呢?
volatile关键字在并发中有哪些作用?
请问为什么我plot生成的图像x轴刻度和标签是乱的
机器学习(一)
flink的AggregateFunction,merge方法作用范围
Goby 漏洞发布|泛微 E-office flow_xml.php 文件 SORT_ID 参数 SQL 注入漏洞
玩转Jetson Nano(五):TensorRT加速YOLOv5目标检测
yolov10打包为exe
- 原文地址:https://blog.csdn.net/npm_run_dev__/article/details/126897434