-
使用 Temporal Fusion Transformer 进行时间序列预测
目前来看表格类的数据的处理还是树型的结构占据了主导地位。但是在时间序列预测中,深度学习神经网络是有可能超越传统技术的。
为什么需要更加现代的时间序列模型?
专为单个时间序列(无论是多变量还是单变量)创建模型的情况现在已经很少见了。现在的时间序列研究方向都是多元的,并且具有各种分布,其中包含更多探索性因素包括:缺失数据、趋势、季节性、波动性、漂移和罕见事件等等。
通过直接预测目标变量往往是不够的,我们优势还希望系统能够产生预测区间,显示预测的不确定性程度。
并且除了历史数据外,所有的变量都应该考虑在内,这样可以建立一个在预测能力方面具有竞争力的模型。
所以现代时间序列模型应该考虑到以下几点:
- 模型应该考虑多个时间序列,理想情况下应该考虑数千个时间序列。
- 模型中应该使用单维或多维序列。
- 除了时态数据之外,模型还应该能够使用过去数据。这个限制影响了所有的自回归技术(ARIMA模型),包括亚马逊的DeepAR。
- 非时间的外部静态因素也应加以考虑。
- 模型需要具有高度的适应性。即使时间序列比较复杂或包含一些噪声,模型也可以使用季节性“朴素”预测器预测。并且应该能够区分这些实例。
- 如果可以的话模型可以进行多步预测功能。也就是不止预测下一个值们需要预测下几个值。
- 直接对目标变量预测是不够的。模型能够产生预测区间,这样显示预测的不确定性程度。
- 生产环境应该能够顺利地集成最优模型,该模型也应该易于使用和理解。
什么是Temporal Fusion Transformer?
Temporal Fusion Transformer(TFT)是一个基于注意力的深度神经网络,它优化了性能和可解释性,顶层架构如下图所示。

TFT架构的优点如下:
能够使用丰富的特征:TFT支持三种不同类型的特征:外生类别/静态变量,也称为时不变特征;具有已知输入到未来的时态数据,仅到目前已知的时态数据;具有未知输入的未来时态数据。
区间预测:TFT使用分位数损失函数来产生除实际预测之外的预测区间。
异构时间序列:允许训练具有不同分布的多个时间序列。TFT设计将处理分为两个部分:局部处理,集中于特定事件的特征和全局处理,记录所有时间序列的一般特征。
可解释性:TFT的核心是基于transformer的体系结构。该模型引入的多头注意力机制,在需要对模型进行解释时提供了关于特征重要性的额外知识。另外一个性能良好的DNN实现是Multi-Horizon Quantile Recurrent Forecaster(MQRNN)。但是它没有提供如何解释这些特征重要程度的指导。
性能:在基准测试中,TFT 优于基于 DNN 的模型,如 DeepAR、MQRNN 和深度状态空间模型(Deep Space-State Models)以及传统统计模型 (ARIMA,DSSM等)。
与传统方法不同,TFT的多头注意力提供了特征可解释性。通过TFT的多头注意力添加一个新的矩阵或分组,允许不同的头共享一些权重,然后可以根据季节性分析来解释这些全红的含义。
如何使用 Temporal Fusion Transformer 进行预测?
本文将在一个非常小的数据集上训练 TemporalFusionTransformer,以证明它甚至在仅 20k 样本上也能很好地工作。
1、加载数据
本文中将使用 Kaggle Stallion 数据集,该数据集跟踪几种饮料的销售情况。我们的目标是预测在接下来的六个月中,库存单位 (SKU) 销售的商品数量或由零售商代理机构销售的产品数量。
每月约有 21,000 条历史销售记录。除了过去的销售量,我们还有销售价格、代理商位置、节假日等特殊日子以及该行业销售总量的数据。
数据集已经是正确的格式。但是,它还缺少一些我们关注的信息,我们需要添加是一个时间索引,它随着每个时间步长增加一个。
from pytorch_forecasting.data.examples import get_stallion_data data = get_stallion_data() # add time index data["time_idx"] = data["date"].dt.year * 12 + data["date"].dt.month data["time_idx"] -= data["time_idx"].min() # add additional features data["month"] = data.date.dt.month.astype(str).astype("category") # categories have be strings data["log_volume"] = np.log(data.volume + 1e-8) data["avg_volume_by_sku"] = data.groupby(["time_idx", "sku"], observed=True).volume.transform("mean") data["avg_volume_by_agency"] = data.groupby(["time_idx", "agency"], observed=True).volume.transform("mean") # we want to encode special days as one variable and thus need to first reverse one-hot encoding special_days = [ "easter_day", "good_friday", "new_year", "christmas", "labor_day", "independence_day", "revolution_day_memorial", "regional_games", "fifa_u_17_world_cup", "football_gold_cup", "beer_capital", "music_fest", ] data[special_days] = data[special_days].apply(lambda x: x.map({0: "-", 1: x.name})).astype("category") data.sample(10, random_state=521)- 1
- 2
- 3
- 4
- 5
- 6
- 7
- 8
- 9
- 10
- 11
- 12
- 13
- 14
- 15
- 16
- 17
- 18
- 19
- 20
- 21
- 22
- 23
- 24
- 25
- 26
- 27
- 28
- 29
- 30
- 31

2、创建数据集和基线模型
现在需要将我们的df转换为 Forecasting的 TimeSeriesDataSet。这里需要设置参数确定哪些特征是分类的还是连续的,哪些是静态的还是时变的,还有选择如何规范化数据。我们分别对每个时间序列进行标准化,并确认其始终都是正值。
为了防止归一化带来的前瞻性偏差,通常会使用 EncoderNormalizer,它会在训练时在每个编码器序列上动态缩放。
最后我选择使用六个月的数据作为验证集。
max_prediction_length = 6 max_encoder_length = 24 training_cutoff = data["time_idx"].max() - max_prediction_length training = TimeSeriesDataSet( data[lambda x: x.time_idx <= training_cutoff], time_idx="time_idx", target="volume", group_ids=["agency", "sku"], min_encoder_length=max_encoder_length // 2, # keep encoder length long (as it is in the validation set) max_encoder_length=max_encoder_length, min_prediction_length=1, max_prediction_length=max_prediction_length, static_categoricals=["agency", "sku"], static_reals=["avg_population_2017", "avg_yearly_household_income_2017"], time_varying_known_categoricals=["special_days", "month"], variable_groups={"special_days": special_days}, # group of categorical variables can be treated as one variable time_varying_known_reals=["time_idx", "price_regular", "discount_in_percent"], time_varying_unknown_categoricals=[], time_varying_unknown_reals=[ "volume", "log_volume", "industry_volume", "soda_volume", "avg_max_temp", "avg_volume_by_agency", "avg_volume_by_sku", ], target_normalizer=GroupNormalizer( groups=["agency", "sku"], transformation="softplus" ), # use softplus and normalize by group add_relative_time_idx=True, add_target_scales=True, add_encoder_length=True, ) validation = TimeSeriesDataSet.from_dataset(training, data, predict=True, stop_randomization=True) batch_size = 128 # set this between 32 to 128 train_dataloader = training.to_dataloader(train=True, batch_size=batch_size, num_workers=0) train_dataloader = training.to_dataloader(train=True, batch_size=batch_size, num_workers=0)- 1
- 2
- 3
- 4
- 5
- 6
- 7
- 8
- 9
- 10
- 11
- 12
- 13
- 14
- 15
- 16
- 17
- 18
- 19
- 20
- 21
- 22
- 23
- 24
- 25
- 26
- 27
- 28
- 29
- 30
- 31
- 32
- 33
- 34
- 35
- 36
- 37
- 38
- 39
- 40
- 41
- 42
- 43
这里我们通过复制最有一个值来预测下6个月的数据,这个简单的操作我们将它作为基线模型。
actuals = torch.cat([y for x, (y, weight) in iter(val_dataloader)]) baseline_predictions = Baseline().predict(val_dataloader) (actuals - baseline_predictions).abs().mean().item() ##结果 293.0088195800781- 1
- 2
- 3
- 4
- 5
- 6
3、训练TFT
现在我们将创建 TemporalFusionTransformer 模型了。这里使用 PyTorch Lightning 训练模型。
pl.seed_everything(42) trainer = pl.Trainer( gpus=0, # clipping gradients is a hyperparameter and important to prevent divergance # of the gradient for recurrent neural networks gradient_clip_val=0.1, ) tft = TemporalFusionTransformer.from_dataset( training, # not meaningful for finding the learning rate but otherwise very important learning_rate=0.03, hidden_size=16, # most important hyperparameter apart from learning rate # number of attention heads. Set to up to 4 for large datasets attention_head_size=1, dropout=0.1, # between 0.1 and 0.3 are good values hidden_continuous_size=8, # set to <= hidden_size output_size=7, # 7 quantiles by default loss=QuantileLoss(), # reduce learning rate if no improvement in validation loss after x epochs reduce_on_plateau_patience=4, ) print(f"Number of parameters in network: {tft.size()/1e3:.1f}k")- 1
- 2
- 3
- 4
- 5
- 6
- 7
- 8
- 9
- 10
- 11
- 12
- 13
- 14
- 15
- 16
- 17
- 18
- 19
- 20
- 21
- 22
模型的参数大小:Number of parameters in network: 29.7k
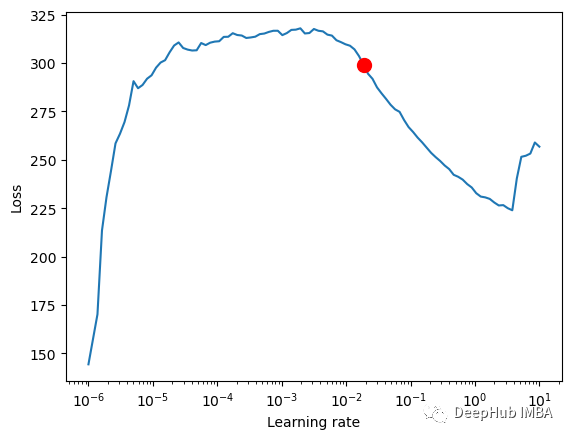
res = trainer.tuner.lr_find( tft, train_dataloaders=train_dataloader, val_dataloaders=val_dataloader, max_lr=10.0, min_lr=1e-6, ) print(f"suggested learning rate: {res.suggestion()}") fig = res.plot(show=True, suggest=True) fig.show() #suggested learning rate: 0.01862087136662867- 1
- 2
- 3
- 4
- 5
- 6
- 7
- 8
- 9
- 10
- 11
- 12

对于 TemporalFusionTransformer,最佳学习率似乎略低于默认的学习率。我们也可以不直接使用建议的学习率,因为 PyTorch Lightning 有时会被较低学习率的噪音混淆,所以我们使用一个根据经验确定的学习率。
early_stop_callback = EarlyStopping(monitor="val_loss", min_delta=1e-4, patience=10, verbose=False, mode="min") lr_logger = LearningRateMonitor() # log the learning rate logger = TensorBoardLogger("lightning_logs") # logging results to a tensorboard trainer = pl.Trainer( max_epochs=30, gpus=0, enable_model_summary=True, gradient_clip_val=0.1, limit_train_batches=30, # coment in for training, running valiation every 30 batches # fast_dev_run=True, # comment in to check that networkor dataset has no serious bugs callbacks=[lr_logger, early_stop_callback], logger=logger, ) tft = TemporalFusionTransformer.from_dataset( training, learning_rate=0.03, hidden_size=16, attention_head_size=1, dropout=0.1, hidden_continuous_size=8, output_size=7, # 7 quantiles by default loss=QuantileLoss(), log_interval=10, # uncomment for learning rate finder and otherwise, e.g. to 10 for logging every 10 batches reduce_on_plateau_patience=4, ) trainer.fit( tft, train_dataloaders=train_dataloader, val_dataloaders=val_dataloader, )- 1
- 2
- 3
- 4
- 5
- 6
- 7
- 8
- 9
- 10
- 11
- 12
- 13
- 14
- 15
- 16
- 17
- 18
- 19
- 20
- 21
- 22
- 23
- 24
- 25
- 26
- 27
- 28
- 29
- 30
- 31
- 32
- 33
4、验证
PyTorch Lightning 会自动保存训练的检查点,我们加载最佳模型。
best_model_path = trainer.checkpoint_callback.best_model_path best_tft = TemporalFusionTransformer.load_from_checkpoint(best_model_path) actuals = torch.cat([y[0] for x, y in iter(val_dataloader)]) predictions = best_tft.predict(val_dataloader) (actuals - predictions).abs().mean() raw_predictions, x = best_tft.predict(val_dataloader, mode="raw", return_x=True) for idx in range(10): # plot 10 examples best_tft.plot_prediction(x, raw_predictions, idx=idx, add_loss_to_title=True);- 1
- 2
- 3
- 4
- 5
- 6
- 7
- 8
- 9
- 10


计算显示的指标:
predictions = best_tft.predict(val_dataloader) mean_losses = SMAPE(reduction="none")(predictions, actuals).mean(1) indices = mean_losses.argsort(descending=True) # sort losses for idx in range(10): # plot 10 examples best_tft.plot_prediction( x, raw_predictions, idx=indices[idx], add_loss_to_title=SMAPE(quantiles=best_tft.loss.quantiles) );- 1
- 2
- 3
- 4
- 5
- 6
- 7
- 8


5、通过变量计算实际值与预测值
检查模型在不同数据上的表现如何可以让我们看到模型的问题。
predictions, x = best_tft.predict(val_dataloader, return_x=True) predictions_vs_actuals = best_tft.calculate_prediction_actual_by_variable(x, predictions) best_tft.plot_prediction_actual_by_variable(predictions_vs_actuals);- 1
- 2
- 3
- 4


对选定数据进行预测
best_tft.predict( training.filter(lambda x: (x.agency == "Agency_01") & (x.sku == "SKU_01") & (x.time_idx_first_prediction == 15)), mode="quantiles", ) raw_prediction, x = best_tft.predict( training.filter(lambda x: (x.agency == "Agency_01") & (x.sku == "SKU_01") & (x.time_idx_first_prediction == 15)), mode="raw", return_x=True, ) best_tft.plot_prediction(x, raw_prediction, idx=0);- 1
- 2
- 3
- 4
- 5
- 6
- 7
- 8
- 9
- 10
- 11
- 12

对新数据进行预测
encoder_data = data[lambda x: x.time_idx > x.time_idx.max() - max_encoder_length] last_data = data[lambda x: x.time_idx == x.time_idx.max()] decoder_data = pd.concat( [last_data.assign(date=lambda x: x.date + pd.offsets.MonthBegin(i)) for i in range(1, max_prediction_length + 1)], ignore_index=True, ) decoder_data["time_idx"] = decoder_data["date"].dt.year * 12 + decoder_data["date"].dt.month decoder_data["time_idx"] += encoder_data["time_idx"].max() + 1 - decoder_data["time_idx"].min() decoder_data["month"] = decoder_data.date.dt.month.astype(str).astype("category") # categories have be strings new_prediction_data = pd.concat([encoder_data, decoder_data], ignore_index=True) new_raw_predictions, new_x = best_tft.predict(new_prediction_data, mode="raw", return_x=True) for idx in range(10): # plot 10 examples best_tft.plot_prediction(new_x, new_raw_predictions, idx=idx, show_future_observed=False);- 1
- 2
- 3
- 4
- 5
- 6
- 7
- 8
- 9
- 10
- 11
- 12
- 13
- 14
- 15
- 16
- 17
- 18
- 19
- 20
- 21
- 22

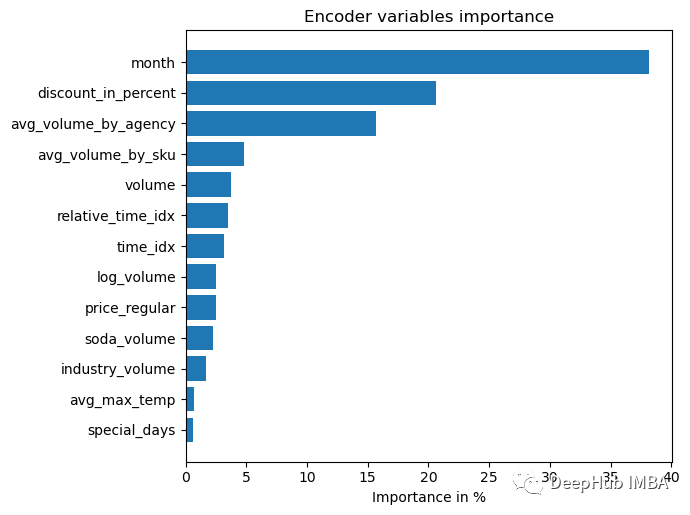
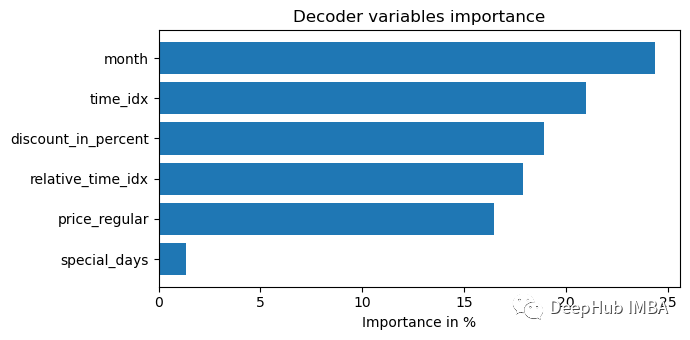
6、模型解释
TFT中内置了解释功能,我们可以直接使用
interpretation = best_tft.interpret_output(raw_predictions, reduction="sum") best_tft.plot_interpretation(interpretation)- 1
- 2


部分依赖图通常用于更好地解释模型(假设特征独立)。
dependency = best_tft.predict_dependency( val_dataloader.dataset, "discount_in_percent", np.linspace(0, 30, 30), show_progress_bar=True, mode="dataframe" ) agg_dependency = dependency.groupby("discount_in_percent").normalized_prediction.agg( median="median", q25=lambda x: x.quantile(0.25), q75=lambda x: x.quantile(0.75) ) ax = agg_dependency.plot(y="median") ax.fill_between(agg_dependency.index, agg_dependency.q25, agg_dependency.q75, alpha=0.3);- 1
- 2
- 3
- 4
- 5
- 6
- 7
- 8

总结
在本文中,我们解释了TFT的理论知识并且使用它进行了一个完整的训练和预测流程,希望对你有帮助,本文的完整代码请访问作者的github:
https://avoid.overfit.cn/post/be0a146627ed45eca224f88fa6452b77
TFT论文地址:arxiv 1912.09363
作者:Aryan Jadon
-
相关阅读:
弱项分析与提高举措
基于YOLOv8模型和CrowdHuman数据集的行人检测系统(PyTorch+Pyside6+YOLOv8模型)
【数据结构初阶】一. 复杂度讲解
大学报考计算机相关专业,这份指南收好,最新数据
设计模式学习(二)工厂模式——抽象工厂模式+注册表
二叉树介绍 ~ 概念、存储结构、性质
Cholesterol-PEG-Amine 胆固醇-聚乙二醇-氨基 用于调节膜流动性
葡聚糖修饰Fe3O4磁性纳米粒子,脂质体(CMD-LIPs)定制服务
STM32F1学习笔记(四)—CubeMX定时器中断+平滑滤波
对称加密 vs 非对称加密
- 原文地址:https://blog.csdn.net/m0_46510245/article/details/126915667
