-
【OpenCV】Chapter9.边缘检测与图像分割
最近想对OpenCV进行系统学习,看到网上这份教程写得不错,于是跟着来学习实践一下。
【youcans@qq.com, youcans 的 OpenCV 例程, https://youcans.blog.csdn.net/article/details/125112487】
程序仓库:https://github.com/zstar1003/OpenCV-Learning边缘检测
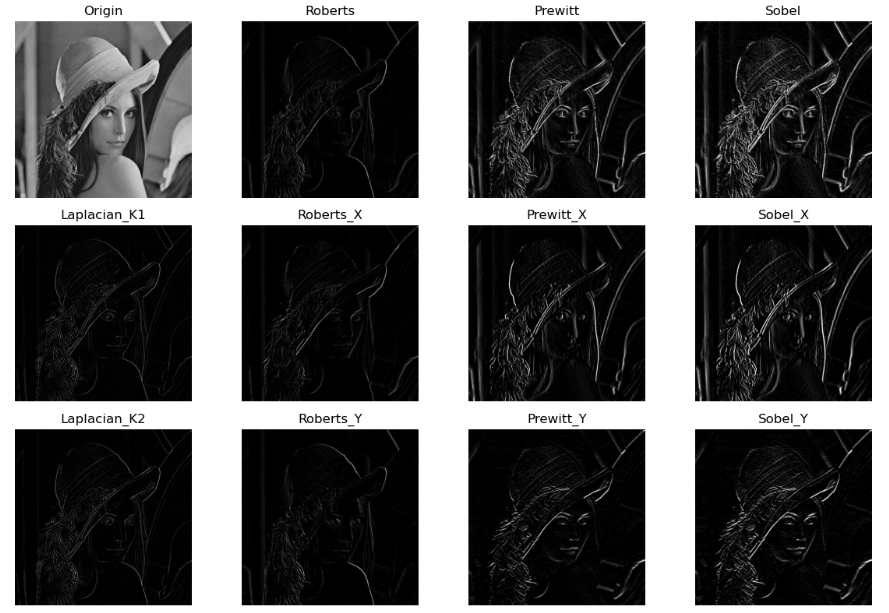
Roberts算子/Prewitt算子/Sobel算子/Laplacian算子
边缘检测的原理和matlab实现在我之前这两篇博文中提到过,这里不再赘述。
【计算机视觉】基础图像知识点整理【计算机视觉】数字图像处理基础知识题
此次来看OpenCV的实现方式。OpenCV并没有直接提供相应的函数接口,因此通过自定义卷积核可以实现各种边缘检测算子。
示例程序:""" 边缘检测(Roberts算子, Prewitt算子, Sobel算子, Laplacian算子) """ import cv2 import matplotlib.pyplot as plt import numpy as np img = cv2.imread("../img/lena.jpg", flags=0) # 自定义卷积核 # Roberts 边缘算子 kernel_Roberts_x = np.array([[1, 0], [0, -1]]) kernel_Roberts_y = np.array([[0, -1], [1, 0]]) # Prewitt 边缘算子 kernel_Prewitt_x = np.array([[-1, 0, 1], [-1, 0, 1], [-1, 0, 1]]) kernel_Prewitt_y = np.array([[1, 1, 1], [0, 0, 0], [-1, -1, -1]]) # Sobel 边缘算子 kernel_Sobel_x = np.array([[-1, 0, 1], [-2, 0, 2], [-1, 0, 1]]) kernel_Sobel_y = np.array([[1, 2, 1], [0, 0, 0], [-1, -2, -1]]) # Laplacian 边缘算子 kernel_Laplacian_K1 = np.array([[0, 1, 0], [1, -4, 1], [0, 1, 0]]) kernel_Laplacian_K2 = np.array([[1, 1, 1], [1, -8, 1], [1, 1, 1]]) # 卷积运算 imgBlur = cv2.blur(img, (3, 3)) # Blur 平滑后再做 Laplacian 变换 imgLaplacian_K1 = cv2.filter2D(imgBlur, -1, kernel_Laplacian_K1) imgLaplacian_K2 = cv2.filter2D(imgBlur, -1, kernel_Laplacian_K2) imgRoberts_x = cv2.filter2D(img, -1, kernel_Roberts_x) imgRoberts_y = cv2.filter2D(img, -1, kernel_Roberts_y) imgRoberts = np.uint8(cv2.normalize(abs(imgRoberts_x) + abs(imgRoberts_y), None, 0, 255, cv2.NORM_MINMAX)) imgPrewitt_x = cv2.filter2D(img, -1, kernel_Prewitt_x) imgPrewitt_y = cv2.filter2D(img, -1, kernel_Prewitt_y) imgPrewitt = np.uint8(cv2.normalize(abs(imgPrewitt_x) + abs(imgPrewitt_y), None, 0, 255, cv2.NORM_MINMAX)) imgSobel_x = cv2.filter2D(img, -1, kernel_Sobel_x) imgSobel_y = cv2.filter2D(img, -1, kernel_Sobel_y) imgSobel = np.uint8(cv2.normalize(abs(imgSobel_x) + abs(imgSobel_y), None, 0, 255, cv2.NORM_MINMAX)) plt.figure(figsize=(12, 8)) plt.subplot(341), plt.title('Origin'), plt.imshow(img, cmap='gray'), plt.axis('off') plt.subplot(345), plt.title('Laplacian_K1'), plt.imshow(imgLaplacian_K1, cmap='gray'), plt.axis('off') plt.subplot(349), plt.title('Laplacian_K2'), plt.imshow(imgLaplacian_K2, cmap='gray'), plt.axis('off') plt.subplot(342), plt.title('Roberts'), plt.imshow(imgRoberts, cmap='gray'), plt.axis('off') plt.subplot(346), plt.title('Roberts_X'), plt.imshow(imgRoberts_x, cmap='gray'), plt.axis('off') plt.subplot(3, 4, 10), plt.title('Roberts_Y'), plt.imshow(imgRoberts_y, cmap='gray'), plt.axis('off') plt.subplot(343), plt.title('Prewitt'), plt.imshow(imgPrewitt, cmap='gray'), plt.axis('off') plt.subplot(347), plt.title('Prewitt_X'), plt.imshow(imgPrewitt_x, cmap='gray'), plt.axis('off') plt.subplot(3, 4, 11), plt.title('Prewitt_Y'), plt.imshow(imgPrewitt_y, cmap='gray'), plt.axis('off') plt.subplot(344), plt.title('Sobel'), plt.imshow(imgSobel, cmap='gray'), plt.axis('off') plt.subplot(348), plt.title('Sobel_X'), plt.imshow(imgSobel_x, cmap='gray'), plt.axis('off') plt.subplot(3, 4, 12), plt.title('Sobel_Y'), plt.imshow(imgSobel_y, cmap='gray'), plt.axis('off') plt.tight_layout() plt.show()- 1
- 2
- 3
- 4
- 5
- 6
- 7
- 8
- 9
- 10
- 11
- 12
- 13
- 14
- 15
- 16
- 17
- 18
- 19
- 20
- 21
- 22
- 23
- 24
- 25
- 26
- 27
- 28
- 29
- 30
- 31
- 32
- 33
- 34
- 35
- 36
- 37
- 38
- 39
- 40
- 41
- 42
- 43
- 44
- 45
- 46
- 47
- 48
- 49
- 50
- 51
- 52
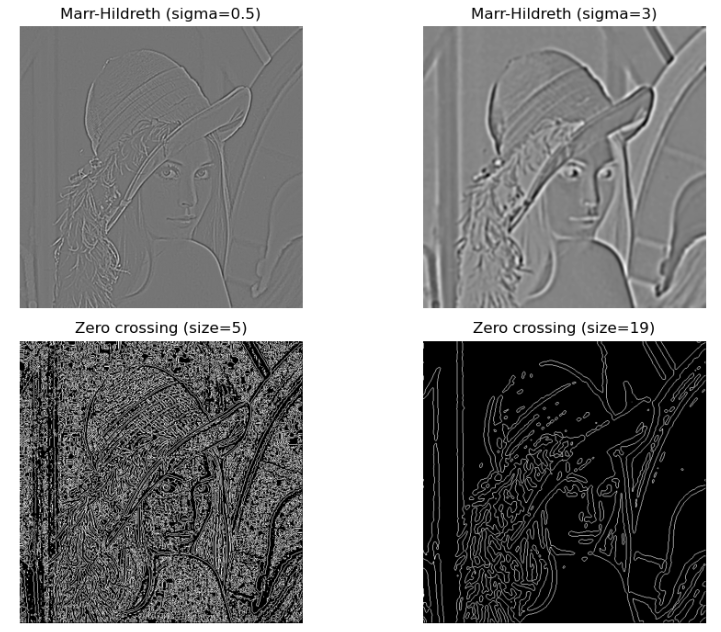
LoG算子(Marr-Hildreth 算法)
Marr-Hildreth 算法是改进的边缘检测算子,是平滑算子与 Laplace 算子的结合,因而兼具平滑和二阶微分的作用,其定位精度高,边缘连续性好,计算速度快。
示例程序:
""" LoG边缘检测算子 """ import cv2 import matplotlib.pyplot as plt import numpy as np from scipy import signal img = cv2.imread("../img/lena.jpg", flags=0) def ZeroDetect(img): # 判断零交叉点 h, w = img.shape[0], img.shape[1] zeroCrossing = np.zeros_like(img, np.uint8) for x in range(0, w - 1): for y in range(0, h - 1): if img[y][x] < 0: if (img[y][x - 1] > 0) or (img[y][x + 1] > 0) \ or (img[y - 1][x] > 0) or (img[y + 1][x] > 0): zeroCrossing[y][x] = 255 return zeroCrossing imgBlur = cv2.blur(img, (3, 3)) # Blur 平滑后再做 Laplacian 变换 # 近似的 Marr-Hildreth 卷积核 (5*5) kernel_MH5 = np.array([ [0, 0, -1, 0, 0], [0, -1, -2, -1, 0], [-1, -2, 16, -2, -1], [0, -1, -2, -1, 0], [0, 0, -1, 0, 0]]) imgMH5 = signal.convolve2d(imgBlur, kernel_MH5, boundary='symm', mode='same') # 卷积计算 zeroMH5 = ZeroDetect(imgMH5) # 判断零交叉点 # 由 Gauss 标准差计算 Marr-Hildreth 卷积核 sigma = 3 # Gauss 标准差,输入参数 size = int(2 * round(3 * sigma)) + 1 # 根据标准差确定窗口大小,3*sigma 占比 99.7% print("sigma={:d}, size={}".format(sigma, size)) x, y = np.meshgrid(np.arange(-size / 2 + 1, size / 2 + 1), np.arange(-size / 2 + 1, size / 2 + 1)) # 生成网格 norm2 = np.power(x, 2) + np.power(y, 2) sigma2, sigma4 = np.power(sigma, 2), np.power(sigma, 4) kernelLoG = ((norm2 - (2.0 * sigma2)) / sigma4) * np.exp(- norm2 / (2.0 * sigma2)) # 计算 LoG 卷积核 # Marr-Hildreth 卷积运算 imgLoG = signal.convolve2d(imgBlur, kernelLoG, boundary='symm', mode='same') # 卷积计算 # 判断零交叉点 zeroCrossing = ZeroDetect(imgLoG) plt.figure(figsize=(10, 7)) plt.subplot(221), plt.title("Marr-Hildreth (sigma=0.5)"), plt.imshow(imgMH5, cmap='gray'), plt.axis('off') plt.subplot(222), plt.title("Marr-Hildreth (sigma=3)"), plt.imshow(imgLoG, cmap='gray'), plt.axis('off') plt.subplot(223), plt.title("Zero crossing (size=5)"), plt.imshow(zeroMH5, cmap='gray'), plt.axis('off') plt.subplot(224), plt.title("Zero crossing (size=19)"), plt.imshow(zeroCrossing, cmap='gray'), plt.axis('off') plt.tight_layout() plt.show()- 1
- 2
- 3
- 4
- 5
- 6
- 7
- 8
- 9
- 10
- 11
- 12
- 13
- 14
- 15
- 16
- 17
- 18
- 19
- 20
- 21
- 22
- 23
- 24
- 25
- 26
- 27
- 28
- 29
- 30
- 31
- 32
- 33
- 34
- 35
- 36
- 37
- 38
- 39
- 40
- 41
- 42
- 43
- 44
- 45
- 46
- 47
- 48
- 49
- 50
- 51
- 52
- 53
- 54
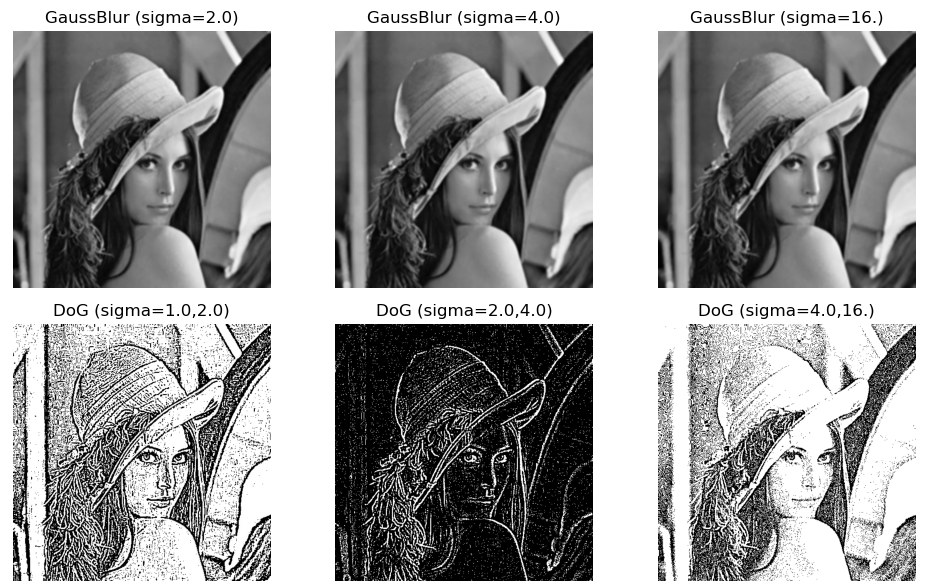
DoG算子
DoG算子是对LoG算子的简化。
示例程序:
""" DoG边缘检测算子 """ import cv2 import matplotlib.pyplot as plt import numpy as np from scipy import signal img = cv2.imread("../img/lena.jpg", flags=0) # 高斯核低通滤波器,sigmaY 缺省时 sigmaY=sigmaX kSize = (5, 5) imgGaussBlur1 = cv2.GaussianBlur(img, (5, 5), sigmaX=1.0) # sigma=1.0 imgGaussBlur2 = cv2.GaussianBlur(img, (5, 5), sigmaX=2.0) # sigma=2.0 imgGaussBlur3 = cv2.GaussianBlur(img, (5, 5), sigmaX=4.0) # sigma=4.0 imgGaussBlur4 = cv2.GaussianBlur(img, (5, 5), sigmaX=16.0) # sigma=16.0 # 高斯差分算子 (Difference of Gaussian) imgDoG1 = imgGaussBlur2 - imgGaussBlur1 # sigma=1.0,2.0 imgDoG2 = imgGaussBlur3 - imgGaussBlur2 # sigma=2.0,4.0 imgDoG3 = imgGaussBlur4 - imgGaussBlur3 # sigma=4.0,16.0 plt.figure(figsize=(10, 6)) plt.subplot(231), plt.title("GaussBlur (sigma=2.0)"), plt.imshow(imgGaussBlur2, cmap='gray'), plt.axis('off') plt.subplot(232), plt.title("GaussBlur (sigma=4.0)"), plt.imshow(imgGaussBlur3, cmap='gray'), plt.axis('off') plt.subplot(233), plt.title("GaussBlur (sigma=16.)"), plt.imshow(imgGaussBlur4, cmap='gray'), plt.axis('off') plt.subplot(234), plt.title("DoG (sigma=1.0,2.0)"), plt.imshow(imgDoG1, cmap='gray'), plt.axis('off') plt.subplot(235), plt.title("DoG (sigma=2.0,4.0)"), plt.imshow(imgDoG2, cmap='gray'), plt.axis('off') plt.subplot(236), plt.title("DoG (sigma=4.0,16.)"), plt.imshow(imgDoG3, cmap='gray'), plt.axis('off') plt.tight_layout() plt.show()- 1
- 2
- 3
- 4
- 5
- 6
- 7
- 8
- 9
- 10
- 11
- 12
- 13
- 14
- 15
- 16
- 17
- 18
- 19
- 20
- 21
- 22
- 23
- 24
- 25
- 26
- 27
- 28
- 29
- 30
- 31
- 32
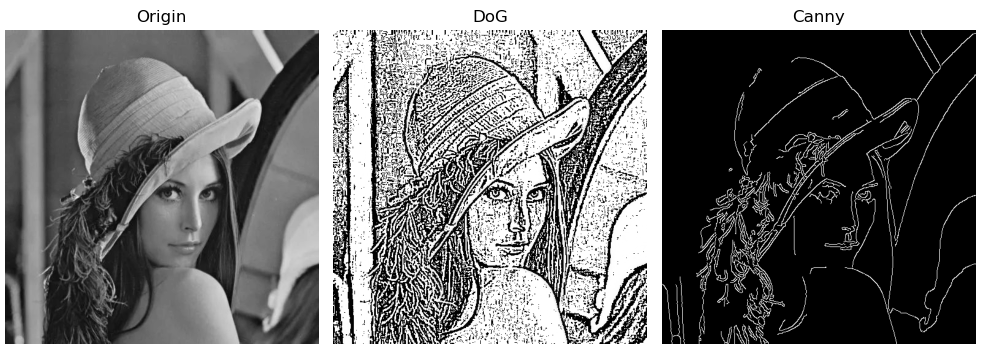
Canny算子
Canny算子执行的基本步骤为:
(1)使用高斯滤波对图像进行平滑;
(2)用一阶有限差分计算梯度幅值和方向;
(3)对梯度幅值进行非极大值抑制(NMS);
(4)用双阈值处理和连通性分析来检测和连接边缘OpenCV提供了函数
cv.Canny实现Canny边缘检测算子。cv.Canny(image, threshold1, threshold2[, edges[, apertureSize[, L2gradient]]]) → edges
参数说明:
- image:输入图像,8-bit 灰度图像,不适用彩色图像
- edges:输出边缘图像,8-bit 单通道图像,大小与输入图像相同
- threshold1:第一阈值 TL
- threshold2:第二阈值 TH
- apertureSize:Sobel 卷积核的孔径,可选项,默认值 3
- L2gradient: 计算图像梯度幅值 标志符,默认值为 True 表示 L2 法,False 表示 L1 法
示例程序:
""" Canny边缘检测算子 """ import cv2 import matplotlib.pyplot as plt import numpy as np img = cv2.imread("../img/lena.jpg", flags=0) # 高斯核低通滤波器,sigmaY 缺省时 sigmaY=sigmaX kSize = (5, 5) imgGauss1 = cv2.GaussianBlur(img, kSize, sigmaX=1.0) # sigma=1.0 imgGauss2 = cv2.GaussianBlur(img, kSize, sigmaX=10.0) # sigma=2.0 # 高斯差分算子 (Difference of Gaussian) imgDoG = imgGauss2 - imgGauss1 # sigma=1.0, 10.0 # Canny 边缘检测, kSize 为高斯核大小,t1,t2为阈值大小 t1, t2 = 50, 150 imgCanny = cv2.Canny(imgGauss1, t1, t2) plt.figure(figsize=(10, 6)) plt.subplot(131), plt.title("Origin"), plt.imshow(img, cmap='gray'), plt.axis('off') plt.subplot(132), plt.title("DoG"), plt.imshow(imgDoG, cmap='gray'), plt.axis('off') plt.subplot(133), plt.title("Canny"), plt.imshow(imgCanny, cmap='gray'), plt.axis('off') plt.tight_layout() plt.show()- 1
- 2
- 3
- 4
- 5
- 6
- 7
- 8
- 9
- 10
- 11
- 12
- 13
- 14
- 15
- 16
- 17
- 18
- 19
- 20
- 21
- 22
- 23
- 24
- 25
- 26
- 27
图像分割
区域生长
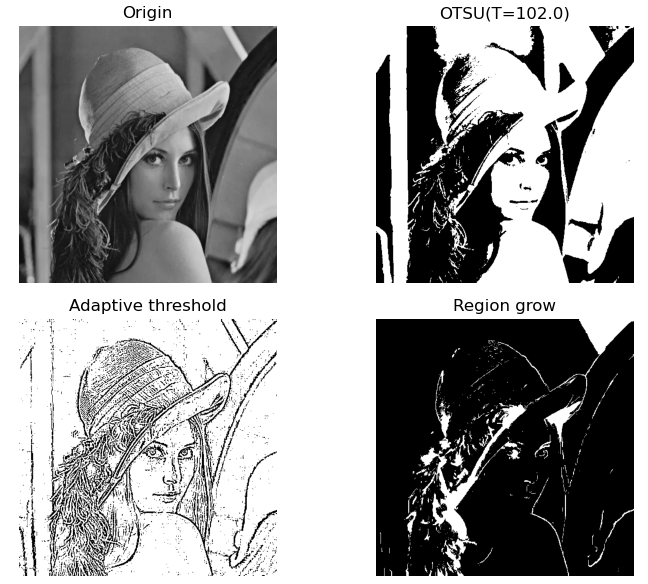
区域生长方法将具有相似性质的像素或子区域组合为更大区域。
区域增长方法的步骤:
(1)对图像自上而下、从左向右扫描,找到第 1 个还没有访问过的像素,将该像素作为种子 (x0, y0);
(2)以 (x0, y0) 为中心, 考虑其 4 邻域或 8 邻域像素 (x, y),如果其邻域满足生长准则 则将 (x, y) 与 (x0, y0) 合并到同一区域,同时将 (x, y) 压入堆栈;
(3)从堆栈中取出一个像素,作为种子 (x0, y0) 继续步骤(2);
(4)当堆栈为空时返回步骤(1);
(5)重复步骤(1)-(4),直到图像中的每个点都被访问过,算法结束示例程序:
""" 图像分割之区域生长 """ import cv2 import matplotlib.pyplot as plt import numpy as np def getGrayDiff(image, currentPoint, tmpPoint): # 求两个像素的距离 return abs(int(image[currentPoint[0], currentPoint[1]]) - int(image[tmpPoint[0], tmpPoint[1]])) # 区域生长算法 def regional_growth(img, seeds, thresh=5): height, weight = img.shape seedMark = np.zeros(img.shape) seedList = [] for seed in seeds: if (0 < seed[0] < height and 0 < seed[1] < weight): seedList.append(seed) label = 1 # 种子位置标记 connects = [(-1, -1), (0, -1), (1, -1), (1, 0), (1, 1), (0, 1), (-1, 1), (-1, 0)] # 8 邻接连通 while (len(seedList) > 0): # 如果列表里还存在点 currentPoint = seedList.pop(0) # 将最前面的那个抛出 seedMark[currentPoint[0], currentPoint[1]] = label # 将对应位置的点标记为 1 for i in range(8): # 对这个点周围的8个点一次进行相似性判断 tmpX = currentPoint[0] + connects[i][0] tmpY = currentPoint[1] + connects[i][1] if tmpX < 0 or tmpY < 0 or tmpX >= height or tmpY >= weight: # 是否超出限定阈值 continue grayDiff = getGrayDiff(img, currentPoint, (tmpX, tmpY)) # 计算灰度差 if grayDiff < thresh and seedMark[tmpX, tmpY] == 0: seedMark[tmpX, tmpY] = label seedList.append((tmpX, tmpY)) return seedMark img = cv2.imread("../img/lena.jpg", flags=0) # histCV = cv2.calcHist([img], [0], None, [256], [0, 256]) # 灰度直方图 # OTSU 全局阈值处理 ret, imgOtsu = cv2.threshold(img, 127, 255, cv2.THRESH_OTSU) # 阈值分割, thresh=T # 自适应局部阈值处理 binaryMean = cv2.adaptiveThreshold(img, 255, cv2.ADAPTIVE_THRESH_MEAN_C, cv2.THRESH_BINARY, 5, 3) # 区域生长图像分割 # seeds = [(10, 10), (82, 150), (20, 300)] # 直接给定 种子点 imgBlur = cv2.blur(img, (3, 3)) # cv2.blur 方法 _, imgTop = cv2.threshold(imgBlur, 250, 255, cv2.THRESH_BINARY) # 高百分位阈值产生种子区域 nseeds, labels, stats, centroids = cv2.connectedComponentsWithStats(imgTop) # 过滤连通域,获得质心点 (x,y) seeds = centroids.astype(int) # 获得质心像素作为种子点 imgGrowth = regional_growth(img, seeds, 8) plt.figure(figsize=(8, 6)) plt.subplot(221), plt.axis('off'), plt.title("Origin") plt.imshow(img, 'gray') plt.subplot(222), plt.axis('off'), plt.title("OTSU(T={})".format(ret)) plt.imshow(imgOtsu, 'gray') plt.subplot(223), plt.axis('off'), plt.title("Adaptive threshold") plt.imshow(binaryMean, 'gray') plt.subplot(224), plt.axis('off'), plt.title("Region grow") plt.imshow(255 - imgGrowth, 'gray') plt.tight_layout() plt.show()- 1
- 2
- 3
- 4
- 5
- 6
- 7
- 8
- 9
- 10
- 11
- 12
- 13
- 14
- 15
- 16
- 17
- 18
- 19
- 20
- 21
- 22
- 23
- 24
- 25
- 26
- 27
- 28
- 29
- 30
- 31
- 32
- 33
- 34
- 35
- 36
- 37
- 38
- 39
- 40
- 41
- 42
- 43
- 44
- 45
- 46
- 47
- 48
- 49
- 50
- 51
- 52
- 53
- 54
- 55
- 56
- 57
- 58
- 59
- 60
- 61
区域分离
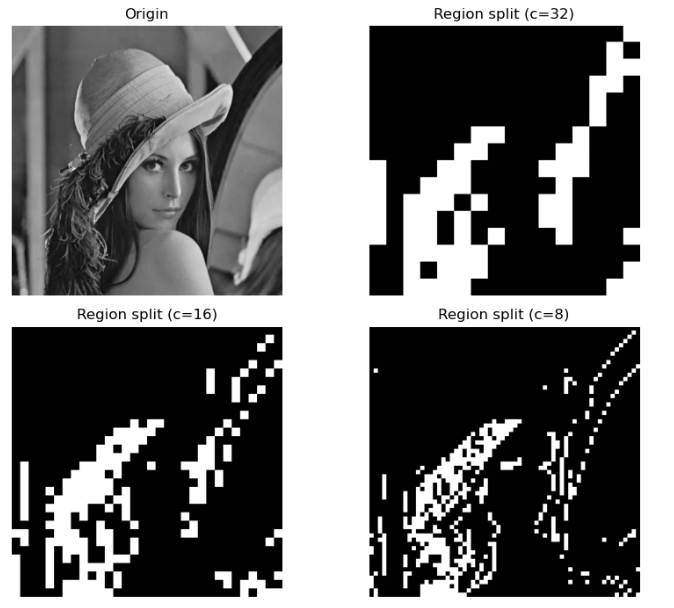
区域分离的判据是用户选择的谓词逻辑Q,通常是目标区域特征一致性的测度,例如灰度均值和方差。
分离过程先判断当前区域是否满足目标的特征测度,如果不满足则将当前区域分离为多个子区域进行判断;不断重复判断、分离,直到拆分到最小区域为止。示例程序:
""" 图像分割之区域分离 """ import cv2 import matplotlib.pyplot as plt import numpy as np def SplitMerge(src, dst, h, w, h0, w0, maxMean, minVar, cell=4): win = src[h0: h0 + h, w0: w0 + w] mean = np.mean(win) # 窗口区域的均值 var = np.std(win, ddof=1) # 窗口区域的标准差,无偏样本标准差 if (mean < maxMean) and (var > minVar) and (h < 2 * cell) and (w < 2 * cell): # 该区域满足谓词逻辑条件,判为目标区域,设为白色 dst[h0:h0 + h, w0:w0 + w] = 255 # 白色 # print("h0={}, w0={}, h={}, w={}, mean={:.2f}, var={:.2f}". # format(h0, w0, h, w, mean, var)) else: # 该区域不满足谓词逻辑条件 if (h > cell) and (w > cell): # 区域能否继续分拆?继续拆 SplitMerge(src, dst, (h + 1) // 2, (w + 1) // 2, h0, w0, maxMean, minVar, cell) SplitMerge(src, dst, (h + 1) // 2, (w + 1) // 2, h0, w0 + (w + 1) // 2, maxMean, minVar, cell) SplitMerge(src, dst, (h + 1) // 2, (w + 1) // 2, h0 + (h + 1) // 2, w0, maxMean, minVar, cell) SplitMerge(src, dst, (h + 1) // 2, (w + 1) // 2, h0 + (h + 1) // 2, w0 + (w + 1) // 2, maxMean, minVar, cell) # else: # 不能再分拆,判为非目标区域,设为黑色 # src[h0:h0+h, w0:w0+w] = 0 # 黑色 img = cv2.imread("../img/lena.jpg", flags=0) hImg, wImg = img.shape mean = np.mean(img) # 窗口区域的均值 var = np.std(img, ddof=1) # 窗口区域的标准差,无偏样本标准差 print("h={}, w={}, mean={:.2f}, var={:.2f}".format(hImg, wImg, mean, var)) maxMean = 80 # 均值上界 minVar = 10 # 标准差下界 src = img.copy() dst1 = np.zeros_like(img) dst2 = np.zeros_like(img) dst3 = np.zeros_like(img) SplitMerge(src, dst1, hImg, wImg, 0, 0, maxMean, minVar, cell=32) # 最小分割区域 cell=32 SplitMerge(src, dst2, hImg, wImg, 0, 0, maxMean, minVar, cell=16) # 最小分割区域 cell=16 SplitMerge(src, dst3, hImg, wImg, 0, 0, maxMean, minVar, cell=8) # 最小分割区域 cell=8 plt.figure(figsize=(9, 7)) plt.subplot(221), plt.axis('off'), plt.title("Origin") plt.imshow(img, 'gray') plt.subplot(222), plt.axis('off'), plt.title("Region split (c=32)") plt.imshow(dst1, 'gray') plt.subplot(223), plt.axis('off'), plt.title("Region split (c=16)") plt.imshow(dst2, 'gray') plt.subplot(224), plt.axis('off'), plt.title("Region split (c=8)") plt.imshow(dst3, 'gray') plt.tight_layout() plt.show()- 1
- 2
- 3
- 4
- 5
- 6
- 7
- 8
- 9
- 10
- 11
- 12
- 13
- 14
- 15
- 16
- 17
- 18
- 19
- 20
- 21
- 22
- 23
- 24
- 25
- 26
- 27
- 28
- 29
- 30
- 31
- 32
- 33
- 34
- 35
- 36
- 37
- 38
- 39
- 40
- 41
- 42
- 43
- 44
- 45
- 46
- 47
- 48
- 49
- 50
- 51
- 52
- 53
- 54
- 55
- 56
K均值聚类
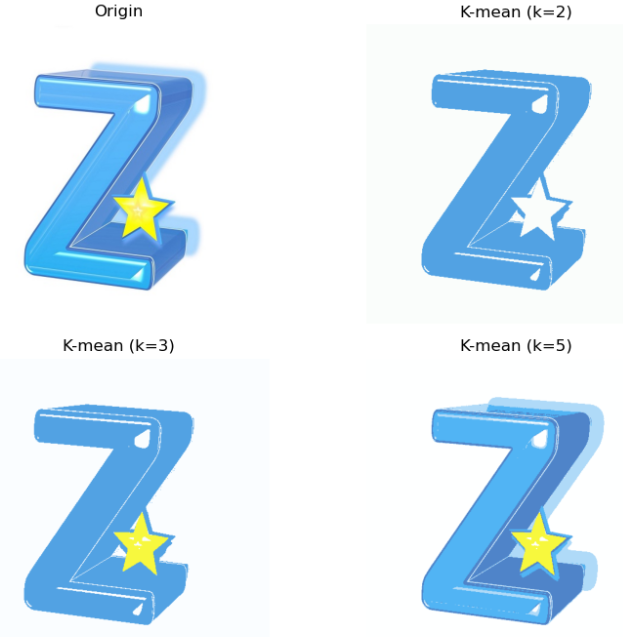
OpenCV 提供了函数
cv.kmeans来实现 k-means 聚类算法。cv.kmeans(data, K, bestLabels, criteria, attempts, flags[, centers]) → compactness, labels, centersdst
参数说明:
- data:用于聚类的数据,N 维数组,类型为 CV_32F、CV_32FC2
- K:设定的聚类数量
- bestLabels:整数数组,分类标签,每个样本的所属聚类的序号
- criteria:元组 (type, max_iter, epsilon),算法结束标准,最大迭代次数或聚类中心位置精度
- cv2.TERM_CRITERIA_EPS:如果达到指定的精度 epsilon,则停止算法迭代
- cv2.TERM_CRITERIA_MAX_ITER:在指定的迭代次数max_iter之后停止算法
- cv2.TERM_CRITERIA_EPS + cv.TERM_CRITERIA_MAX_ITER:当满足上述任何条件时停止迭代
- attempts:标志,指定使用不同聚类中心初值执行算法的次数
- flags:像素邻域的尺寸,用于计算邻域的阈值,通常取 3,5,7
- cv2. KMEANS_RANDOM_CENTERS:随机产生聚类中心的初值
- cv2. KMEANS_PP_CENTERS:Kmeans++ 中心初始化方法
- cv2. KMEANS_USE_INITIAL_LABELS:第一次计算时使用用户指定的聚类初值,之后的计算则使用随机的或半随机的聚类中心初值
- centers:聚类中心数组,每个聚类中心为一行,可选项
- labels:整数数组,分类标签,每个样本的所属聚类的序号
- centersdst:聚类中心数组
示例程序:
""" 图像分割之k均值聚类 """ import cv2 import matplotlib.pyplot as plt import numpy as np img = cv2.imread("../img/img.jpg", flags=1) dataPixel = np.float32(img.reshape((-1, 3))) criteria = (cv2.TERM_CRITERIA_EPS + cv2.TERM_CRITERIA_MAX_ITER, 200, 0.1) # 终止条件 flags = cv2.KMEANS_RANDOM_CENTERS # 起始的中心选择 K = 2 # 设置聚类数 _, labels, center = cv2.kmeans(dataPixel, K, None, criteria, 10, flags) centerUint = np.uint8(center) classify = centerUint[labels.flatten()] # 将像素标记为聚类中心颜色 imgKmean3 = classify.reshape((img.shape)) # 恢复为二维图像 K = 3 # 设置聚类数 _, labels, center = cv2.kmeans(dataPixel, K, None, criteria, 10, flags) centerUint = np.uint8(center) classify = centerUint[labels.flatten()] # 将像素标记为聚类中心颜色 imgKmean4 = classify.reshape((img.shape)) # 恢复为二维图像 K = 5 # 设置聚类数 _, labels, center = cv2.kmeans(dataPixel, K, None, criteria, 10, flags) centerUint = np.uint8(center) classify = centerUint[labels.flatten()] # 将像素标记为聚类中心颜色 imgKmean5 = classify.reshape((img.shape)) # 恢复为二维图像 plt.figure(figsize=(9, 7)) plt.subplot(221), plt.axis('off'), plt.title("Origin") plt.imshow(cv2.cvtColor(img, cv2.COLOR_BGR2RGB)) # 显示 img1(RGB) plt.subplot(222), plt.axis('off'), plt.title("K-mean (k=2)") plt.imshow(cv2.cvtColor(imgKmean3, cv2.COLOR_BGR2RGB)) plt.subplot(223), plt.axis('off'), plt.title("K-mean (k=3)") plt.imshow(cv2.cvtColor(imgKmean4, cv2.COLOR_BGR2RGB)) plt.subplot(224), plt.axis('off'), plt.title("K-mean (k=5)") plt.imshow(cv2.cvtColor(imgKmean5, cv2.COLOR_BGR2RGB)) plt.tight_layout() plt.show()- 1
- 2
- 3
- 4
- 5
- 6
- 7
- 8
- 9
- 10
- 11
- 12
- 13
- 14
- 15
- 16
- 17
- 18
- 19
- 20
- 21
- 22
- 23
- 24
- 25
- 26
- 27
- 28
- 29
- 30
- 31
- 32
- 33
- 34
- 35
- 36
- 37
- 38
- 39
- 40
- 41
- 42
寻找轮廓
OpenCV提供函数
cv.findContours()从二值图像中寻找轮廓,函数cv2.drawContours()绘制轮廓。cv.findContours(image, mode, method[, contours[, hierarchy[, offset]]]) → contours, hierarchy
参数说明:
- image:原始图像,8 位单通道二值图像
- mode: 轮廓检索模式
- cv.RETR_EXTERNAL:只检索最外层轮廓
- cv.RETR_LIST:检索所有轮廓,不建立任何层次关系
- cv.RETR_CCOMP:检索所有轮廓,并将其组织为两层, 顶层是各部分的外部轮廓,次层是内层轮廓
- cv.RETR_TREE:检索所有轮廓,并重建嵌套轮廓的完整层次结构
- cv.RETR_FLOODFILL:漫水填充法(泛洪填充)
- method: 轮廓近似方法
- cv.CHAIN_APPROX_NONE:输出轮廓的每个像素点
- cv.CHAIN_APPROX_SIMPLE:压缩水平、垂直和斜线,仅保留这些线段的端点
- cv.CHAIN_APPROX_TC89_L1:应用 Teh-Chin 链近似算法 L1
- cv.CHAIN_APPROX_TC89_KCOS:应用 Teh-Chin 链近似算法 KCOS
- contours:检测到的所有轮廓,列表格式,每个轮廓存储为包含边界点坐标 (x,y) 的点向量
- 列表(LIST)长度为 L,对应于找到的 L 个轮廓,按 0,…L-1 顺序排列
- 列表中的第 i 个元素是一个形如 (k,1,2) 的 Numpy 数组,表示第 i 个轮廓,k 是第 i 个轮廓的边界点的数量
- 数组 contours[i] 是构成第 i 个轮廓的各边界点坐标 (x,y) 的点向量
- 注意边界点的坐标表达形式是 (x,y),而不是 OpenCV 中常用的像素坐标表达形式 (y,x)。
- hierarchy:轮廓的层次结构和拓扑信息,是一个形如 (1,k,4) 的 Numpy 数组
- k 对应于找到的轮廓数量
- hierarchy[0][i] 表示第 i 个轮廓的层次结构,是包含 4个值的数组 [Next, Previous, First Child, Parent],分别代表第 i 个轮廓的同层的后一个轮廓、同层的前一个轮廓、第一个子轮廓、父轮廓的编号
- offset:每个轮廓点的偏移量
示例程序:
""" 图像分割之绘制轮廓 """ import cv2 import matplotlib.pyplot as plt import numpy as np img = cv2.imread("../img/img.jpg", flags=1) gray = cv2.cvtColor(img, cv2.COLOR_BGR2GRAY) # 灰度图像 _, binary = cv2.threshold(gray, 127, 255, cv2.THRESH_OTSU + cv2.THRESH_BINARY_INV) plt.figure(figsize=(9, 6)) plt.subplot(131), plt.axis('off'), plt.title("Origin") plt.imshow(cv2.cvtColor(img, cv2.COLOR_BGR2RGB)) plt.subplot(132), plt.axis('off'), plt.title("BinaryInv") plt.imshow(binary, 'gray') # 寻找二值化图中的轮廓 binary, contours, hierarchy = cv2.findContours(binary, cv2.RETR_TREE, cv2.CHAIN_APPROX_SIMPLE) # OpenCV3 # contours, hierarchy = cv2.findContours(binary, cv2.RETR_EXTERNAL, cv2.CHAIN_APPROX_SIMPLE) # OpenCV4~ # # 绘制轮廓 contourPic = img.copy() # OpenCV3.2 之前的早期版本,查找轮廓函数会修改原始图像 contourPic = cv2.drawContours(contourPic, contours, -1, (0, 0, 255), 2) # OpenCV3 # contourPic = cv.drawContours(img, contours, -1, (0, 0, 255), thickness=cv.FILLED,maxLevel=1) print("len(contours) = ", len(contours)) # 所有轮廓的列表 for i in range(len(contours)): print("i=", i, contours[i].shape) # 第 i 个轮廓的边界点 print("hierarchy.shape : ", hierarchy.shape) # 层次结构 print(hierarchy) plt.subplot(133), plt.axis('off'), plt.title("External contour") plt.imshow(cv2.cvtColor(contourPic, cv2.COLOR_BGR2RGB)) plt.tight_layout() plt.show()- 1
- 2
- 3
- 4
- 5
- 6
- 7
- 8
- 9
- 10
- 11
- 12
- 13
- 14
- 15
- 16
- 17
- 18
- 19
- 20
- 21
- 22
- 23
- 24
- 25
- 26
- 27
- 28
- 29
- 30
- 31
- 32
- 33
- 34
- 35

趣味应用
下面展示两个趣味应用,原理就不细述了,可以根据阅读代码理解。
GraphCuts图割法
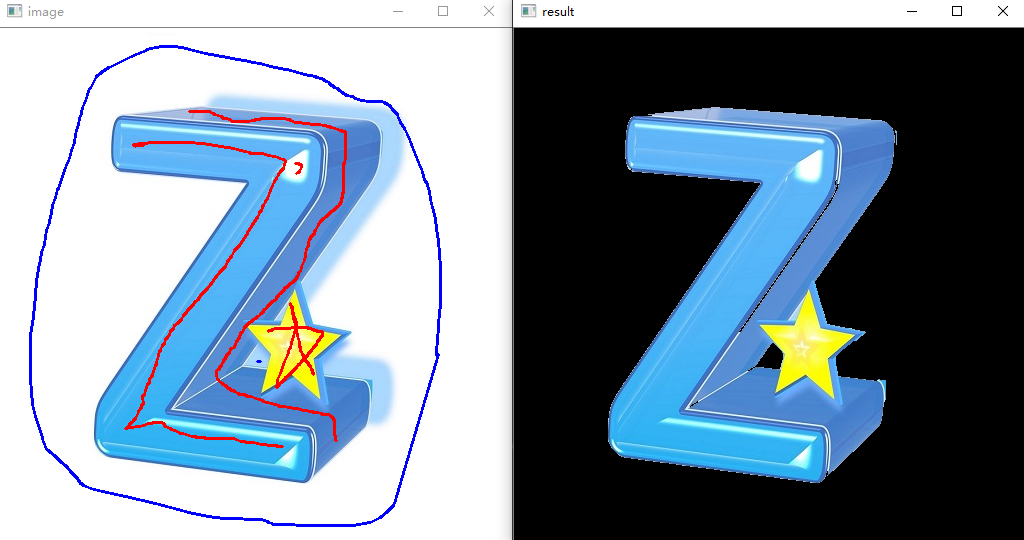
GraphCuts图割法作者为youcans,利用OpenCV实现的交互性应用。通过用鼠标左键标记前景,鼠标右键标记背景,然后实现分割。
代码:
''' GraphCuts 交互式图割分割算法 说明: (1) 用鼠标左键标记前景,鼠标右键标记背景; (2) 可以重复标记,不断优化; (3) 按 Esc 键退出,完成分割。 ''' import cv2 import numpy as np from matplotlib import pyplot as plt drawing = False mode = False class GraphCutXupt: def __init__(self, t_img): self.img = t_img self.img_raw = img.copy() self.img_width = img.shape[0] self.img_height = img.shape[1] self.scale_size = 640 * self.img_width // self.img_height if self.img_width > 640: self.img = cv2.resize(self.img, (640, self.scale_size), interpolation=cv2.INTER_AREA) self.img_show = self.img.copy() self.img_gc = self.img.copy() self.img_gc = cv2.GaussianBlur(self.img_gc, (3, 3), 0) self.lb_up = False self.rb_up = False self.lb_down = False self.rb_down = False self.mask = np.full(self.img.shape[:2], 2, dtype=np.uint8) self.firt_choose = True # 鼠标的回调函数 def mouse_event2(event, x, y, flags, param): global drawing, last_point, start_point # 左键按下:开始画图 if event == cv2.EVENT_LBUTTONDOWN: drawing = True last_point = (x, y) start_point = last_point param.lb_down = True print('mouse lb down') elif event == cv2.EVENT_RBUTTONDOWN: drawing = True last_point = (x, y) start_point = last_point param.rb_down = True print('mouse rb down') # 鼠标移动,画图 elif event == cv2.EVENT_MOUSEMOVE: if drawing: if param.lb_down: cv2.line(param.img_show, last_point, (x, y), (0, 0, 255), 2, -1) cv2.rectangle(param.mask, last_point, (x, y), 1, -1, 4) else: cv2.line(param.img_show, last_point, (x, y), (255, 0, 0), 2, -1) cv2.rectangle(param.mask, last_point, (x, y), 0, -1, 4) last_point = (x, y) # 左键释放:结束画图 elif event == cv2.EVENT_LBUTTONUP: drawing = False param.lb_up = True param.lb_down = False cv2.line(param.img_show, last_point, (x, y), (0, 0, 255), 2, -1) if param.firt_choose: param.firt_choose = False cv2.rectangle(param.mask, last_point, (x, y), 1, -1, 4) # print('mouse lb up') elif event == cv2.EVENT_RBUTTONUP: drawing = False param.rb_up = True param.rb_down = False cv2.line(param.img_show, last_point, (x, y), (255, 0, 0), 2, -1) if param.firt_choose: param.firt_choose = False param.mask = np.full(param.img.shape[:2], 3, dtype=np.uint8) cv2.rectangle(param.mask, last_point, (x, y), 0, -1, 4) # print('mouse rb up') if __name__ == '__main__': img = cv2.imread("../img/img.jpg", flags=1) # 读取彩色图像(Youcans) g_img = GraphCutXupt(img) cv2.namedWindow('image') # 定义鼠标的回调函数 cv2.setMouseCallback('image', mouse_event2, g_img) while (True): cv2.imshow('image', g_img.img_show) if g_img.lb_up or g_img.rb_up: g_img.lb_up = False g_img.rb_up = False bgdModel = np.zeros((1, 65), np.float64) fgdModel = np.zeros((1, 65), np.float64) rect = (1, 1, g_img.img.shape[1], g_img.img.shape[0]) # print(g_img.mask) mask = g_img.mask g_img.img_gc = g_img.img.copy() cv2.grabCut(g_img.img_gc, mask, rect, bgdModel, fgdModel, 5, cv2.GC_INIT_WITH_MASK) mask2 = np.where((mask == 2) | (mask == 0), 0, 1).astype('uint8') # 0和2做背景 g_img.img_gc = g_img.img_gc * mask2[:, :, np.newaxis] # 使用蒙板来获取前景区域 cv2.imshow('result', g_img.img_gc) # 按下ESC键退出 if cv2.waitKey(20) == 27: break plt.figure(figsize=(10, 7)) plt.subplot(221), plt.axis('off'), plt.title("xupt") plt.imshow(cv2.cvtColor(img, cv2.COLOR_BGR2RGB)) # 显示 img(RGB) plt.subplot(222), plt.axis('off'), plt.title("mask") plt.imshow(mask, 'gray') plt.subplot(223), plt.axis('off'), plt.title("mask2") plt.imshow(mask2, 'gray') plt.subplot(224), plt.axis('off'), plt.title("Grab Cut") plt.imshow(cv2.cvtColor(g_img.img_gc, cv2.COLOR_BGR2RGB)) plt.tight_layout() plt.show()- 1
- 2
- 3
- 4
- 5
- 6
- 7
- 8
- 9
- 10
- 11
- 12
- 13
- 14
- 15
- 16
- 17
- 18
- 19
- 20
- 21
- 22
- 23
- 24
- 25
- 26
- 27
- 28
- 29
- 30
- 31
- 32
- 33
- 34
- 35
- 36
- 37
- 38
- 39
- 40
- 41
- 42
- 43
- 44
- 45
- 46
- 47
- 48
- 49
- 50
- 51
- 52
- 53
- 54
- 55
- 56
- 57
- 58
- 59
- 60
- 61
- 62
- 63
- 64
- 65
- 66
- 67
- 68
- 69
- 70
- 71
- 72
- 73
- 74
- 75
- 76
- 77
- 78
- 79
- 80
- 81
- 82
- 83
- 84
- 85
- 86
- 87
- 88
- 89
- 90
- 91
- 92
- 93
- 94
- 95
- 96
- 97
- 98
- 99
- 100
- 101
- 102
- 103
- 104
- 105
- 106
- 107
- 108
- 109
- 110
- 111
- 112
- 113
- 114
- 115
- 116
- 117
- 118
- 119
- 120
- 121
- 122
有点类似于剪辑软件中的抠图笔刷。
旧影浮光——色彩保留滤镜
该demo的作者是ZouKeh,通过一个交互性界面,可以在原图灰度图上绘制矩形,从而框选出有色彩的部分。
程序代码:
""" Title:旧影浮光——基于Opencv的色彩保留滤镜 Author:ZouKeh Link:https://www.bilibili.com/video/BV1BG4y1r7WP """ import numpy as np import cv2 def color_choose(): # 选择需要保留的颜色 color = int(input("choose color(1.red 2.yellow 3.blue 4.green 5.white):")) lower = np.array([0, 0, 0]) upper = np.array([0, 0, 0]) if color == 1: lower = np.array([156, 60, 60]) upper = np.array([180, 255, 255]) # lower = np.array([0, 60, 60]) # upper = np.array([10, 255, 255]) elif color == 2: lower = np.array([26, 43, 46]) upper = np.array([34, 255, 255]) elif color == 3: lower = np.array([100, 43, 46]) upper = np.array([124, 255, 255]) elif color == 4: lower = np.array([35, 43, 46]) upper = np.array([77, 255, 255]) elif color == 5: lower = np.array([0, 0, 221]) upper = np.array([180, 30, 255]) return lower, upper, color def choose_range(img): # 在图片上画区域 选择需要保留颜色的区域 a = [] b = [] ##鼠标事件 左键单击 def on_EVENT_LBUTTONDOWN(event, x, y, flags, param): global num # 界面上点的个数 0开始 偶数为起点 奇数为终点 # global begin_xy if event == cv2.EVENT_LBUTTONDOWN and num % 2 == 0: # 画选框的左上角 红色 xy = "%d,%d" % (x, y) a.append(x) b.append(y) cv2.circle(img, (x, y), 2, (0, 0, 255), thickness=-1) cv2.putText(img, xy, (x, y), cv2.FONT_HERSHEY_PLAIN, 1.0, (0, 0, 0), thickness=1) cv2.imshow("image", img) print(x, y) num += 1 begin_xy = (x, y) elif event == cv2.EVENT_LBUTTONDOWN and num % 2 == 1: # 画选框的右下角 绿色 xy = "%d,%d" % (x, y) a.append(x) b.append(y) cv2.circle(img, (x, y), 2, (0, 255, 0), thickness=-1) cv2.putText(img, xy, (x, y), cv2.FONT_HERSHEY_PLAIN, 1.0, (0, 0, 0), thickness=1) # cv2.arrowedLine(img, begin_xy, (x, y), (0, 0, 255), 2, 0, 0, 0.1) # 画完终点后画箭头 cv2.imshow("image", img) print(x, y) num += 1 cv2.namedWindow('image', cv2.WINDOW_NORMAL) cv2.setMouseCallback("image", on_EVENT_LBUTTONDOWN) while True: cv2.imshow('image', img) key = cv2.waitKey(1) if key == ord('q'): # 在键盘上按Q键退出画图 break if num % 2 == 1: # 如果num为奇数说明有一个起点多余了 去掉 a = a[:-1] b = b[:-1] print(a, b) return a, b # 将坐标点列表a,b 转换为corner_list(坐标点必须为(x,y)形式) def get_corner_list(a, b): corner_list = [] for i in range(int(len(a) / 2)): corner_list.append([a[2 * i], b[2 * i], a[2 * i + 1], b[2 * i + 1]]) # print(corner_list) return corner_list # 将在选区外的掩膜去除 # 判断点是否在选择区域内 def in_box(i, j, corner_list): # if_inbox = False for k in corner_list: if i >= k[0] and i <= k[2] and j >= k[1] and j <= k[3]: return True else: continue return False def cut(mask_r, corner_list): for i in range(mask_r.shape[0]): for j in range(mask_r.shape[1]): if mask_r[i, j] == 255 and not in_box(j, i, corner_list): mask_r[i, j] = 0 else: continue return mask_r # 主函数 def main(corner_list, img_path, lower, upper, color): # 转为hsv颜色模式 img = cv2.imread(img_path) hsv = cv2.cvtColor(img, cv2.COLOR_BGR2HSV) mask = cv2.inRange(hsv, lower, upper) if color == 1: lower_red2 = np.array([0, 60, 60]) upper_red2 = np.array([10, 255, 255]) # thers is two ranges of red mask_2 = cv2.inRange(hsv, lower_red2, upper_red2) mask = mask + mask_2 mask = cut(mask, corner_list) gray_image = cv2.imread(img_path, cv2.IMREAD_GRAYSCALE) gray = cv2.merge([gray_image, gray_image, gray_image]) # 将mask于原视频帧进行按位与操作,则会把mask中的白色用真实的图像替换: res = cv2.bitwise_and(img, img, mask=mask) mask_bg = cv2.bitwise_not(mask) gray = cv2.bitwise_and(gray, gray, mask=mask_bg) result = res + gray cv2.namedWindow('Result', 0) cv2.imshow('Result', result) cv2.imwrite('result.jpg', result) cv2.waitKey(0) if __name__ == '__main__': img_path = '../img/img.jpg' lower, upper, color = color_choose() img = cv2.imread(img_path) num = 0 a, b = choose_range(img) cv2.destroyAllWindows() corner_list = get_corner_list(a, b) main(corner_list, img_path, lower, upper, color)- 1
- 2
- 3
- 4
- 5
- 6
- 7
- 8
- 9
- 10
- 11
- 12
- 13
- 14
- 15
- 16
- 17
- 18
- 19
- 20
- 21
- 22
- 23
- 24
- 25
- 26
- 27
- 28
- 29
- 30
- 31
- 32
- 33
- 34
- 35
- 36
- 37
- 38
- 39
- 40
- 41
- 42
- 43
- 44
- 45
- 46
- 47
- 48
- 49
- 50
- 51
- 52
- 53
- 54
- 55
- 56
- 57
- 58
- 59
- 60
- 61
- 62
- 63
- 64
- 65
- 66
- 67
- 68
- 69
- 70
- 71
- 72
- 73
- 74
- 75
- 76
- 77
- 78
- 79
- 80
- 81
- 82
- 83
- 84
- 85
- 86
- 87
- 88
- 89
- 90
- 91
- 92
- 93
- 94
- 95
- 96
- 97
- 98
- 99
- 100
- 101
- 102
- 103
- 104
- 105
- 106
- 107
- 108
- 109
- 110
- 111
- 112
- 113
- 114
- 115
- 116
- 117
- 118
- 119
- 120
- 121
- 122
- 123
- 124
- 125
- 126
- 127
- 128
- 129
- 130
- 131
- 132
- 133
- 134
- 135
- 136
- 137
- 138
- 139
- 140
- 141
- 142
- 143
- 144
- 145
- 146
- 147

-
相关阅读:
360°全景环视「升级战」激化,前装供应链洗牌加速进行
【Spring MVC】Spring MVC中的跨域概念名词解释.md
Go语言基础,墙上时钟Wall Clock与单调时钟Monotonic Clock
22.3 指针与数组
Java Class类之Class.isPrimitive()方法具有什么功能呢?
vue2文件下载和合计表格
MyBatis的核心配置文件解析
关于异常的方方面面
OpenCV_Mat类对象的基本操作、常用操作及相关成员函数介绍
【Arduino TFT】基于 ESP8266 以及 SSD1306实现的天气时钟
- 原文地址:https://blog.csdn.net/qq1198768105/article/details/126651820