-
python 多项式回归以及可视化
python 多项式回归以及可视化
简介
多项式回归:回归函数是回归变量多项式的回归1。
令 x k x_k xk为自变量, y y y为因变量: y = f ( x 0 , . . . , x k ) y = f(x_0,...,x_k) y=f(x0,...,xk) 本文主要介绍两种一元和二元一、一元N次多项式回归
已知数据 x x x 和 y y y,求 b b b 和系数 k k k
公式: y = b + k 1 ∗ x 1 + k 2 ∗ x 2 + . . . + k n ∗ x n y=b + k_1 * x^1 + k_2 * x^2 + ... + k_n * x^n y=b+k1∗x1+k2∗x2+...+kn∗xn
令方程为: y = 1 + x − 2 ∗ x 2 + 3 ∗ x n y=1 + x -2 * x^2 + 3 * x^n y=1+x−2∗x2+3∗xn (使用np.random.rand造一些数据,测试多项式回归)1.1 可视化
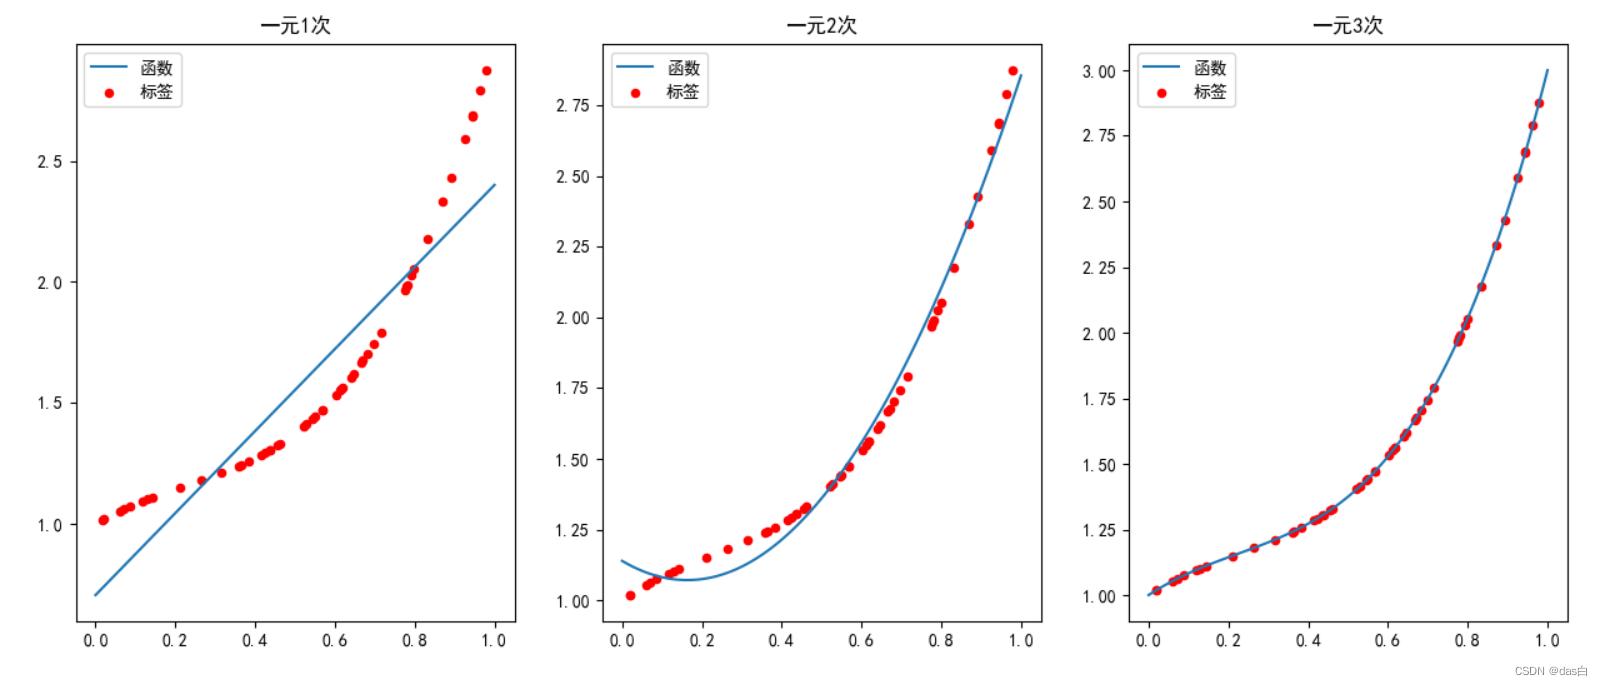
1.2 代码
代码实现:import numpy as np import matplotlib.pyplot as plt from numpy.linalg import lstsq plt.rcParams["font.sans-serif"] = ["SimHei"] plt.rcParams["axes.unicode_minus"] = False # 1. 造50对数据 np.random.seed(0) x_t = np.random.rand(50).reshape(50, -1) y_t = 1 + x_t + -2 * x_t ** 2 + 3 * x_t ** 3 # + np.random.rand(50).reshape(50, -1) / 3 # 2. 尝试求解 以及 可视化 fig = plt.figure(figsize=(18, 6)) for n in [1, 2, 3]: # 最高到3次 # 求解 x_tmp = x_t.copy() for i in range(2, n+1): x_tmp = np.concatenate((x_tmp, x_t ** i), axis=1) m = np.ones(x_t.shape) m = np.concatenate((m, x_tmp), axis=1) k = lstsq(m, y_t, rcond=None)[0].reshape(-1) print(k) # 可视化 ax = fig.add_subplot(1, 3, n) ax.scatter(x_t.reshape(-1), y_t.reshape(-1), c='red', s=20, label='标签') x = np.linspace(0, 1, 100) y = k[0] + k[1] * x for i in range(2, n+1): y += k[i] * (x ** i) ax.plot(x, y, label='函数') ax.set_title('一元' + str(n) + '次') ax.legend() plt.legend() #plt.savefig('cs.png', dpi=300) plt.show()- 1
- 2
- 3
- 4
- 5
- 6
- 7
- 8
- 9
- 10
- 11
- 12
- 13
- 14
- 15
- 16
- 17
- 18
- 19
- 20
- 21
- 22
- 23
- 24
- 25
- 26
- 27
- 28
- 29
- 30
- 31
- 32
- 33
- 34
- 35
- 36
二、二元二次多项式回归
已知数据 x 1 x_1 x1、 x 2 x_2 x2 和 y y y,求 b b b 和系数 k k k
公式: y = b + k 1 ∗ x 1 + k 2 ∗ x 1 2 + k 3 ∗ x 2 + k 4 ∗ x 2 2 + k 5 ∗ x 1 ∗ x 2 y=b + k_1 * x_1 + k_2 * x_1^2 + k_3 * x_2 + k_4 * x_2^2 + k_5 * x_1 * x_2 y=b+k1∗x1+k2∗x12+k3∗x2+k4∗x22+k5∗x1∗x2
令方程为: y = 1 + x 1 − 2 ∗ x 1 2 + x 2 − x 2 2 + x 1 ∗ x 2 y=1 + x_1 -2 * x_1^2 + x_2 -x_2^2 + x_1*x_2 y=1+x1−2∗x12+x2−x22+x1∗x2 (使用np.random.rand造一些数据,测试多项式回归)2.1 可视化
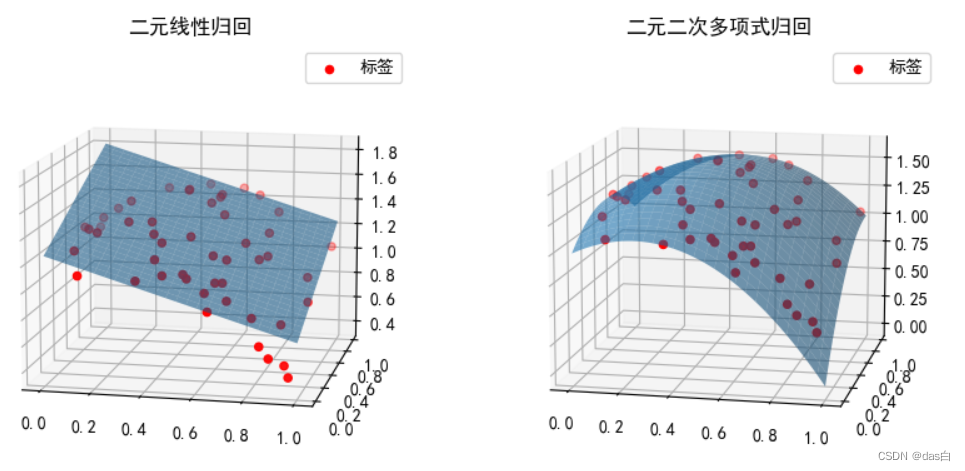
2.2 代码
代码实现:2import numpy as np import matplotlib.pyplot as plt from numpy.linalg import lstsq plt.rcParams["font.sans-serif"] = ["SimHei"] plt.rcParams["axes.unicode_minus"] = False # 1. 造50对数据 np.random.seed(0) x_1 = np.random.rand(50).reshape(50, -1) x_2 = np.random.rand(50).reshape(50, -1) y_t = 1 + x_1 + -2 * x_1 ** 2 + x_2 + -1 * x_2 ** 2 + x_1*x_2 # + np.random.rand(50).reshape(50, -1) / 3 # 2. 尝试求解 以及 可视化 fig = plt.figure(figsize=(10, 5)) m = np.ones(x_1.shape) m = np.hstack((m, x_1, x_1 ** 2, x_2, x_2 ** 2, x_1*x_2)) k = lstsq(m, y_t, rcond=None)[0].reshape(-1) print(k) # 可视化 ax = fig.add_subplot(1, 2, 2, projection='3d') ax.scatter(x_1.reshape(-1), x_2.reshape(-1), y_t.reshape(-1), c='red', s=20, label='标签') x1 = np.linspace(0, 1, 100) x2 = np.linspace(0, 1, 100) x, y =np.meshgrid(x1, x2) z = k[0] + k[1] * x + k[2] * x ** 2 + k[3] * y + k[4] * y**2 + k[5] * x * y ax.plot_surface(x, y, z,rstride=4,cstride=4,alpha=0.6) ax.legend() ax.set_title('二元二次多项式归回') ax.view_init(12,-78) # 3. 增加一个对比 二元线性回归 ax = fig.add_subplot(1, 2, 1, projection='3d') ax.scatter(x_1.reshape(-1), x_2.reshape(-1), y_t.reshape(-1), c='red', s=20, label='标签') m = np.ones(x_1.shape) m = np.hstack((m, x_1, x_2)) k = lstsq(m, y_t, rcond=None)[0].reshape(-1) print(k) x1 = np.linspace(0, 1, 100) x2 = np.linspace(0, 1, 100) x, y =np.meshgrid(x1, x2) z = k[0] + k[1] * x + k[2] * y ax.plot_surface(x, y, z,rstride=4,cstride=4,alpha=0.6) ax.legend() ax.set_title('二元线性归回') ax.view_init(12,-78) plt.show()- 1
- 2
- 3
- 4
- 5
- 6
- 7
- 8
- 9
- 10
- 11
- 12
- 13
- 14
- 15
- 16
- 17
- 18
- 19
- 20
- 21
- 22
- 23
- 24
- 25
- 26
- 27
- 28
- 29
- 30
- 31
- 32
- 33
- 34
- 35
- 36
- 37
- 38
- 39
- 40
- 41
- 42
- 43
- 44
- 45
- 46
- 47
-
相关阅读:
一文带你梳理Python的中级知识
The 2022 ICPC Asia Regionals Online Contest (II) G
微信小程序常用标签及其用法
同态加密:正则嵌入、理想格和RLWE问题
系列十一、阻塞队列
栈的应用场景(二)
Python自动化测试框架有哪些?
【基础】JDK新特性
剑指offer 17. 删除链表中重复的节点
[设计模式] 装饰器模式
- 原文地址:https://blog.csdn.net/qq_38204686/article/details/126276228
