-
实战PyQt5: 141-QChart图表之箱形图
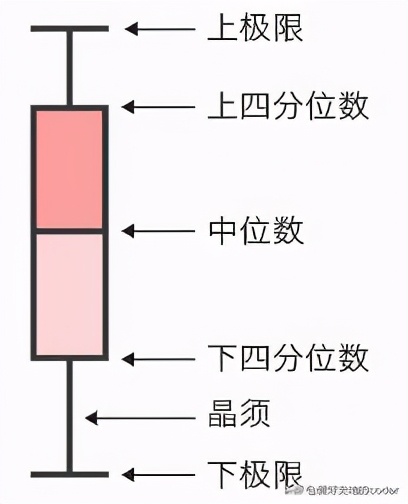
箱形图(英文:Box plot),又称为盒须图、盒式图、盒状图或箱线图,也称箱须图(Box-whisker Plot)。是一种用作显示一组数据分散情况资料的统计图,经常被使用于各种领域,因形状如箱子而得名。它主要用于反映原始数据分布的特征,还可以进行多组数据分布特征的比较。箱形图的绘制方法是:先找出一组数据的上边缘、下边缘、中位数和两个四分位数;然后, 连接两个四分位数画出箱体;再将上边缘和下边缘与箱体相连接,中位数在箱体中间。

QChart提供QBoxPlotSeries, QBoxSet类来实现箱形图的绘制。
QBoxPlotSeries
QBoxPlotSeries类在箱形图中显示数据。QBoxPlotSeries充当箱形数据集的容器。在QBoxPlotSeries可添加多个箱形数据集QBoxPlotSet。
QBoxPlotSeries 常用函数:
- append(self, set):将由set指定的单个条目添加到箱形图序列中,并获得其所有权。如果该项为空或已在系列中,则不会附加该项。如果添加成功返回True,否则返回False。
- insert(self, index, set):在图中指定索引index处插入set指定的条目。
- remove(self, set):从图中删除set指定的条目。
- clear(self):永久删除图中的所有条目。
- take(self, set):从图中获取由set指定的单个条目。但不删除该条目。
- setBoxOutlineVisible(self, visible):设置箱形轮廓是否可见。
- setBoxWidth(self, width):设置条目的相对宽度,范围为0.0到1.0。
- setBrush(self, brush):设置条目的画刷。
- setPen(self,pen):设置条目线条的画笔。
QBoxPlotSeries常用信号:
- boxOutlineVisibilityChanged(self):盒子的轮廓可见性更改时,将发出此信号。
- boxWidthChanged(self):当箱形图形状的宽度发生变化时,将发出此信号。
- boxsetsAdded(self, sets):当sets指定的条目添加到箱形图序列中时,将发出此信号。
- boxsetsRemoved(self, sets):当sets指定的条目移除箱形图序列时,将发出此信号。
- countChanged(self):当箱形图中的条目数量发生改变时,将发出此信号。
- brushChanged(self):当用于填充箱形图的画刷发生改变时,将发出此信号。
- penChanged(self):箱形图的画笔发生更改时会发出此信号。
- clicked(self, boxset):当用户单击由boxset指定的条目时,将发出此信号。
- doubleClicked(self, boxset):当用户双击由boxset指定的条目时,将发出此信号。
- hovered(self, status, boxset):当鼠标悬停在所指定的条目boxset上时,这个信号被发射。当鼠标移至该条目上方时,state变为True,而当鼠标再次移开时,state变为False。
- pressed(self, boxset):当用户单击boxset指定的条目并按住鼠标按钮时,将发出此信号。
- released(self, boxset):当用户释放boxset所指定的条目上的鼠标时,将发出此信号。
BoxSet
QBoxSet类代表箱形图中的一个条目。箱形条目是范围和由五个不同值构成的三个中值的图形表示。有两种指定值的方法。第一个是通过使用构造函数或流运算符(<<)。必须按以下顺序指定值:下极值,下四分位数,中位数,上四分位数和上限。第二种方法是创建一个空的QBoxSet实例,并使用setValue()方法指定值。
QBoxSet常用函数:
- append(self, value):添加由value指定值到条目的末尾处。
- at(self, index):返回条目中由index指定位置的值。如果index超出范围,则返回0.0。
- clear(self): 将条目中的所有值都设置为0。
- setBrush(self, brush):设置条目的画刷。
- setPen(self, pen):设置条目的画笔。
- setLabel(self, label):设置条目的标签。
- setValue(self, index, value):设置条目中由index指定位置的值为value。
QBoxSet常用信号:
- brushChanged(self):条目的画刷发生改变时,将发出此信号。
- penChanged(self):条目的画笔发生改变时,将发出此信号。
- cleared(self):当条目的所有值都设置为0时,将发出此信号。
- clicked(self):当用户单击图中的条目时,将发出此信号。
- doubleClicked(self):当用户双击图中的条目时,将发出此信号。
- hovered(self,status):当鼠标悬停在条目上时,将发出此信号。
- pressed(self):当用户单击条并按住鼠标按钮时,将发出此信号。
- released(self):当用户释放对条目的释放鼠标时,将发出此信号。
- valueChanged(self, index):当index指定的条目的值发生改变时,将发出此信号。
- valuesChanged(self):当条目中的多个值发生改变时,将发出此信号。
箱形图示例
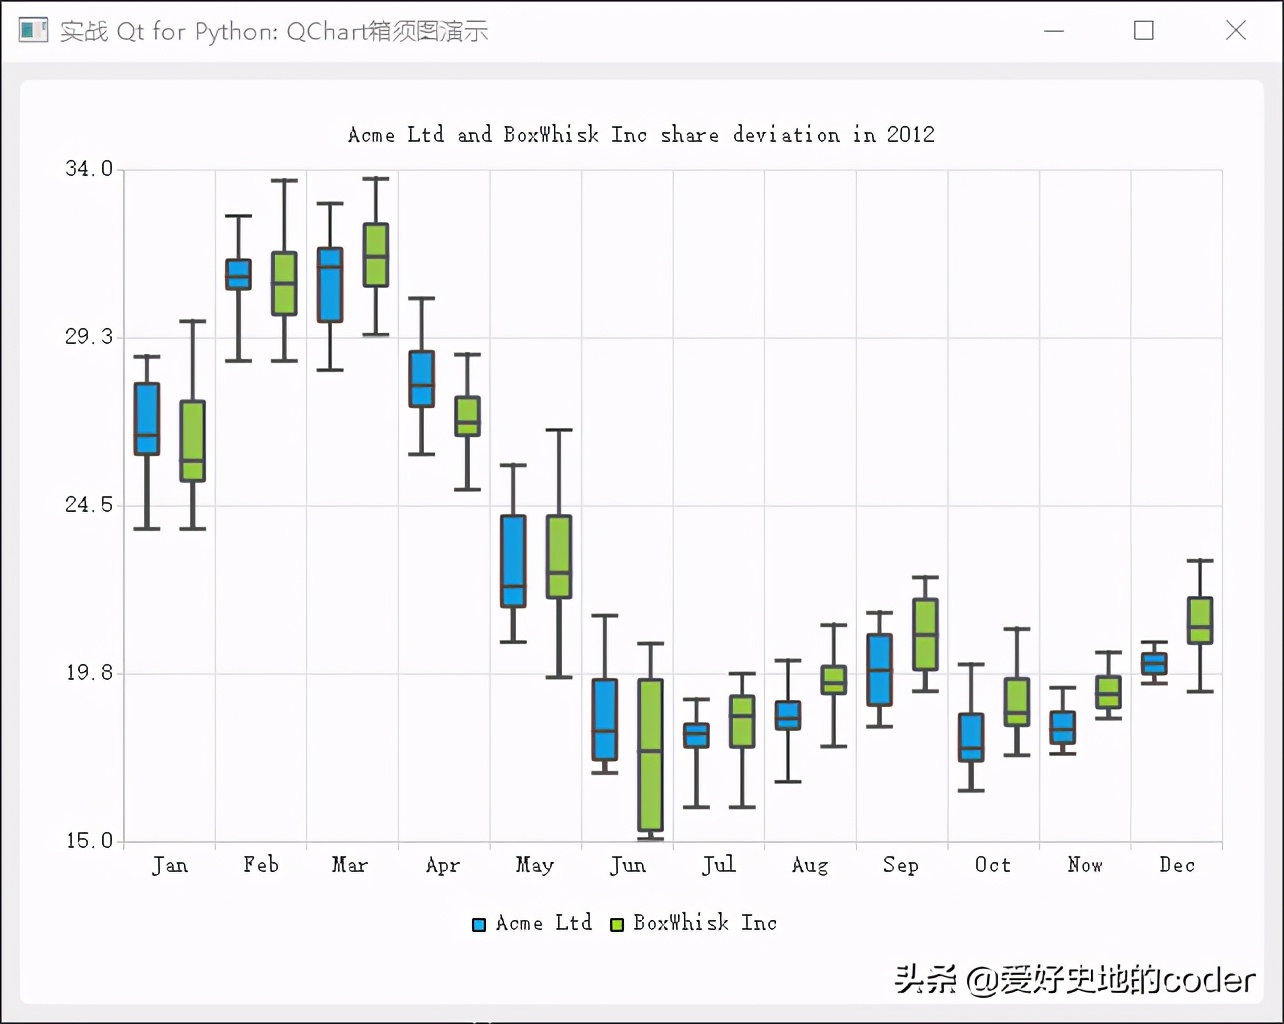
在QChart C++演示代码为基础上改写,示例代码显示了如何创建一个箱形图,同时也显示了如何从文件中读取数据,并对其进行排列然后查找出箱形图的中位数。最终图形显示了两个公司一年中月度股票数据偏差。
两公司月度股票数据如下图所示:

acme_data.txt

boxwhisk_data.txt
资源文件boxplotdata.qrc文件:
- <RCC>
- <qresource prefix="/">
- <file alias="acme">acme_data.txt</file>
- <file alias="boxwhisk">boxwhisk_data.txt</file>
- </qresource>
- </RCC>
完整代码如下:
- import sys
- from PyQt5.QtCore import Qt, QIODevice, QTextStream, QFile, QDateTime
- from PyQt5.QtGui import QPainter
- from PyQt5.QtWidgets import QApplication, QMainWindow, QMessageBox
- from PyQt5.QtChart import QChart, QChartView, QBoxPlotSeries, QBoxSet, QValueAxis
- import boxplotdata_rc
- #读取文本文件并从数据中查找极值和中值
- class BoxDataReader(QTextStream):
- def __init__(self, device, parent = None):
- super(BoxDataReader, self).__init__(parent)
- self.setDevice(device)
- self.sortedList = []
- def readFile(self, device):
- self.setDevice(device)
- def readBox(self):
- line = self.readLine()
- if line.startswith('#'):
- return None
- strList = line.split(' ')
- self.sortedList.clear()
- for i in range(1,len(strList)):
- self.sortedList.append(float(strList[i]))
- self.sortedList.sort() #从小到大排序
- count = len(self.sortedList)
- box = QBoxSet(strList[0])
- box.setValue(QBoxSet.LowerExtreme, self.sortedList[0]) #下边沿
- box.setValue(QBoxSet.UpperExtreme, self.sortedList[-1]) #上边沿
- box.setValue(QBoxSet.Median, self.findMedian(0, count)) # 中位数
- box.setValue(QBoxSet.LowerQuartile, self.findMedian(0, count//2)) #下四分位数
- box.setValue(QBoxSet.UpperQuartile, self.findMedian(count//2 + count%2, count)) #上四分位数
- return box
- #获得中值
- def findMedian(self, begin, end):
- count = begin - end
- if count % 2:
- return self.sortedList[count//2 + begin]
- else:
- right = self.sortedList[count//2 + begin]
- left = self.sortedList[count//2 - 1 + begin]
- return (right + left) / 2.0
- class DemoChartBoxWhisk(QMainWindow):
- def __init__(self, parent=None):
- super(DemoChartBoxWhisk, self).__init__(parent)
- # 设置窗口标题
- self.setWindowTitle('实战 Qt for Python: QChart箱须图演示')
- # 设置窗口大小
- self.resize(640, 480)
- self.createChart()
- def createChart(self):
- #创建box-whisk
- acmeSeries = QBoxPlotSeries()
- acmeSeries.setName('Acme Ltd')
- boxWhiskSeries = QBoxPlotSeries()
- boxWhiskSeries.setName('BoxWhisk Inc')
- #从文件中读取数据
- acmeData = QFile(':acme')
- if not acmeData.open(QIODevice.ReadOnly | QIODevice.Text):
- QMessageBox.information(self, '读数据', '不合法的数据文件')
- return
- dataReader = BoxDataReader(acmeData)
- while not dataReader.atEnd():
- boxSet = dataReader.readBox()
- if not boxSet is None:
- acmeSeries.append(boxSet)
- boxwhiskData = QFile(':boxwhisk')
- if not boxwhiskData.open(QIODevice.ReadOnly | QIODevice.Text):
- QMessageBox.information(self, '读数据', '不合法的数据文件')
- return
- dataReader.readFile(boxwhiskData)
- while not dataReader.atEnd():
- boxSet = dataReader.readBox()
- if not boxSet is None:
- boxWhiskSeries.append(boxSet)
- #创建图表
- chart = QChart()
- chart.addSeries(acmeSeries)
- chart.addSeries(boxWhiskSeries)
- chart.setTitle('Acme Ltd and BoxWhisk Inc share deviation in 2012')
- chart.setAnimationOptions(QChart.SeriesAnimations)
- #坐标轴设置
- chart.createDefaultAxes()
- axisY = chart.axes(Qt.Vertical)[0]
- axisY.setMin(15.0)
- axisY.setMax(34.0)
- #图例
- chart.legend().setVisible(True)
- chart.legend().setAlignment(Qt.AlignBottom)
- #图表视图
- chartView = QChartView(chart)
- chartView.setRenderHint(QPainter.Antialiasing)
- self.setCentralWidget(chartView)
- if __name__ == '__main__':
- app = QApplication(sys.argv)
- window = DemoChartBoxWhisk()
- window.show()
- sys.exit(app.exec())
运行结果如下图:

QChart箱形图示例
本文知识点
- 箱形图是什么,如何绘制获得箱形图所需要的五个数据。
- 使用QBoxPlotSeries, QBoxSet绘制箱形图。
-
相关阅读:
网络编程 day05 (linux )数据库 sqlite3 的下载 与使用命令,和在程序中运用sqlite3
基于C语言开发实现的港口调度问题
centos服务器a.sh内如何 在指令中自动加入当前时间?
基于单片机PM2.5监测系统仿真设计
linux快捷操作方式
【Linux】GDB保姆级调试指南(什么是GDB?GDB如何使用?)
自动驾驶争议不断,距离落地还有几道坎?|上云那些事
WRF进阶:WRF中Noah-MP地面方案中雪反照率的计算
QT(37)-mosquitto-MQTT客户端
【C++天梯计划】1.9 回溯法(bark tracking method)
- 原文地址:https://blog.csdn.net/seniorwizard/article/details/125557948
