-
Prometheus+Grafana监控MySQL
一、准备
- grafana服务器:192.168.48.136
- Prometheus服务器:192.168.48.136
- 被监控服务器:192.168.48.134、192.168.48.135
- 查看时间是否同步



二、安装prometheus server
【2.1】安装
- # 解压安装包
- tar -zxvf prometheus-2.52.0.linux-amd64.tar.gz -C /opt
- # 创建链接目录
- cd /opt
- ln -s prometheus-2.52.0.linux-amd64.tar.gz prometheus
- # 直接使用默认配置文件启动
- /opt/prometheus/prometheus --config.file="/opt/prometheus/prometheus.yml" &
- # 确认是否正常启动(默认端口9090)
- netstat -lnptu | grep 9090
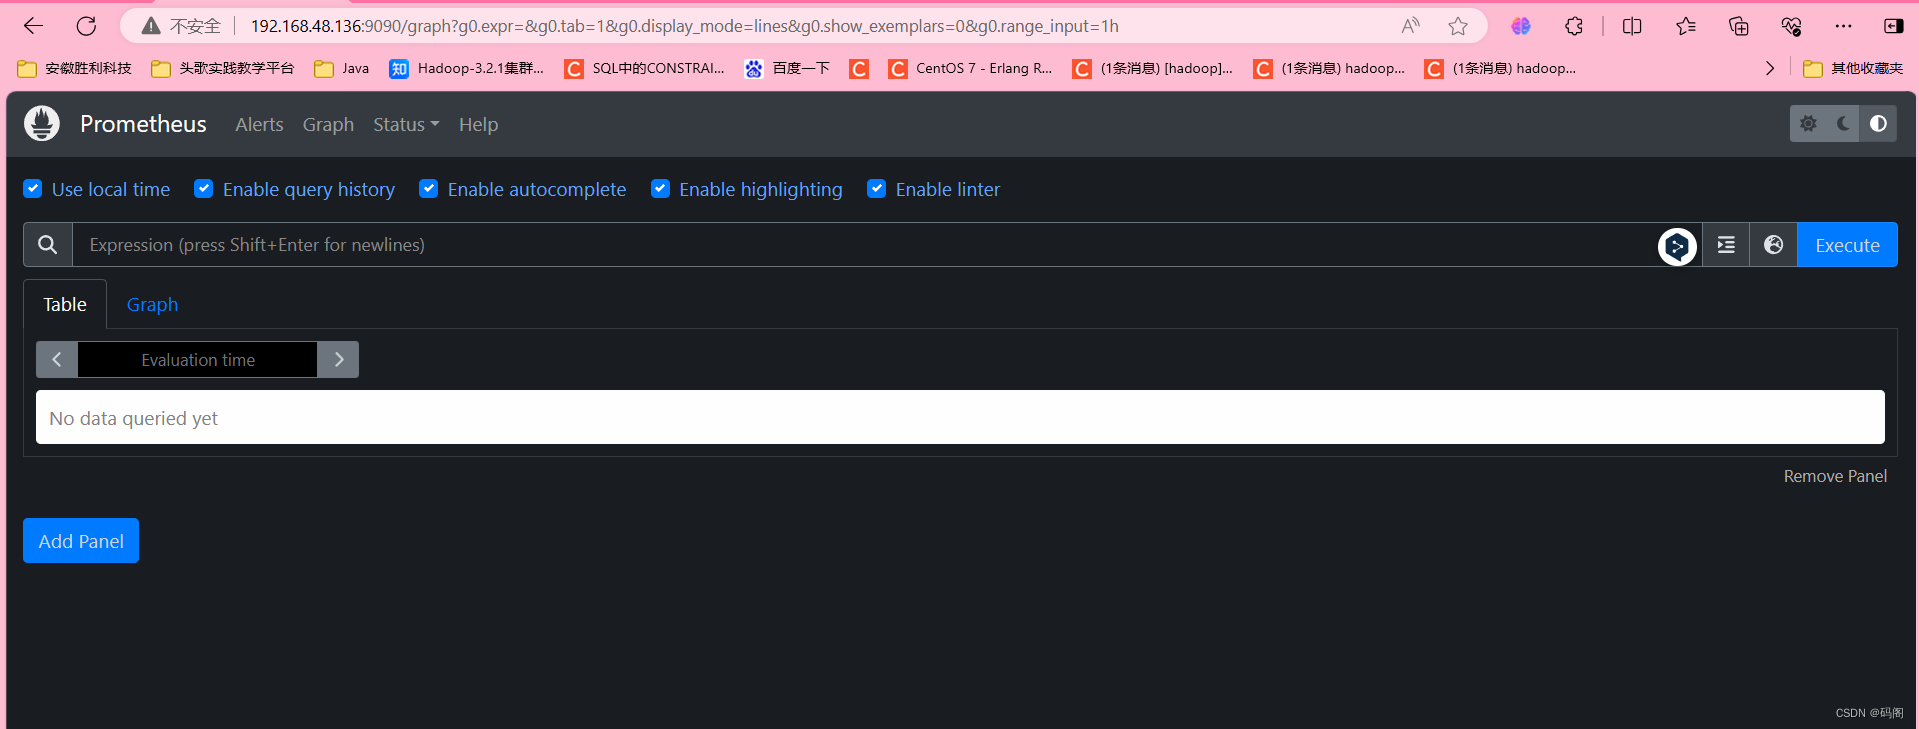
【2.2】prometheus界面访问
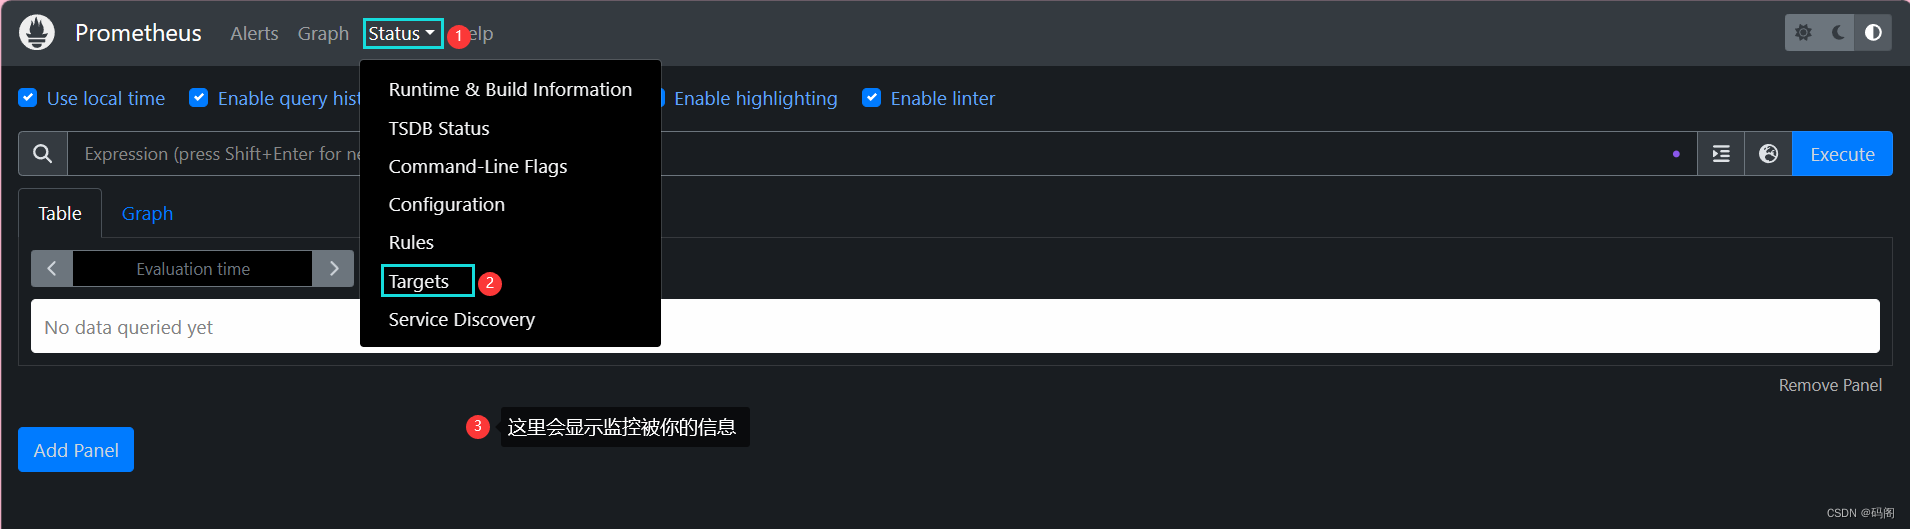
【2.3】查看监控本机
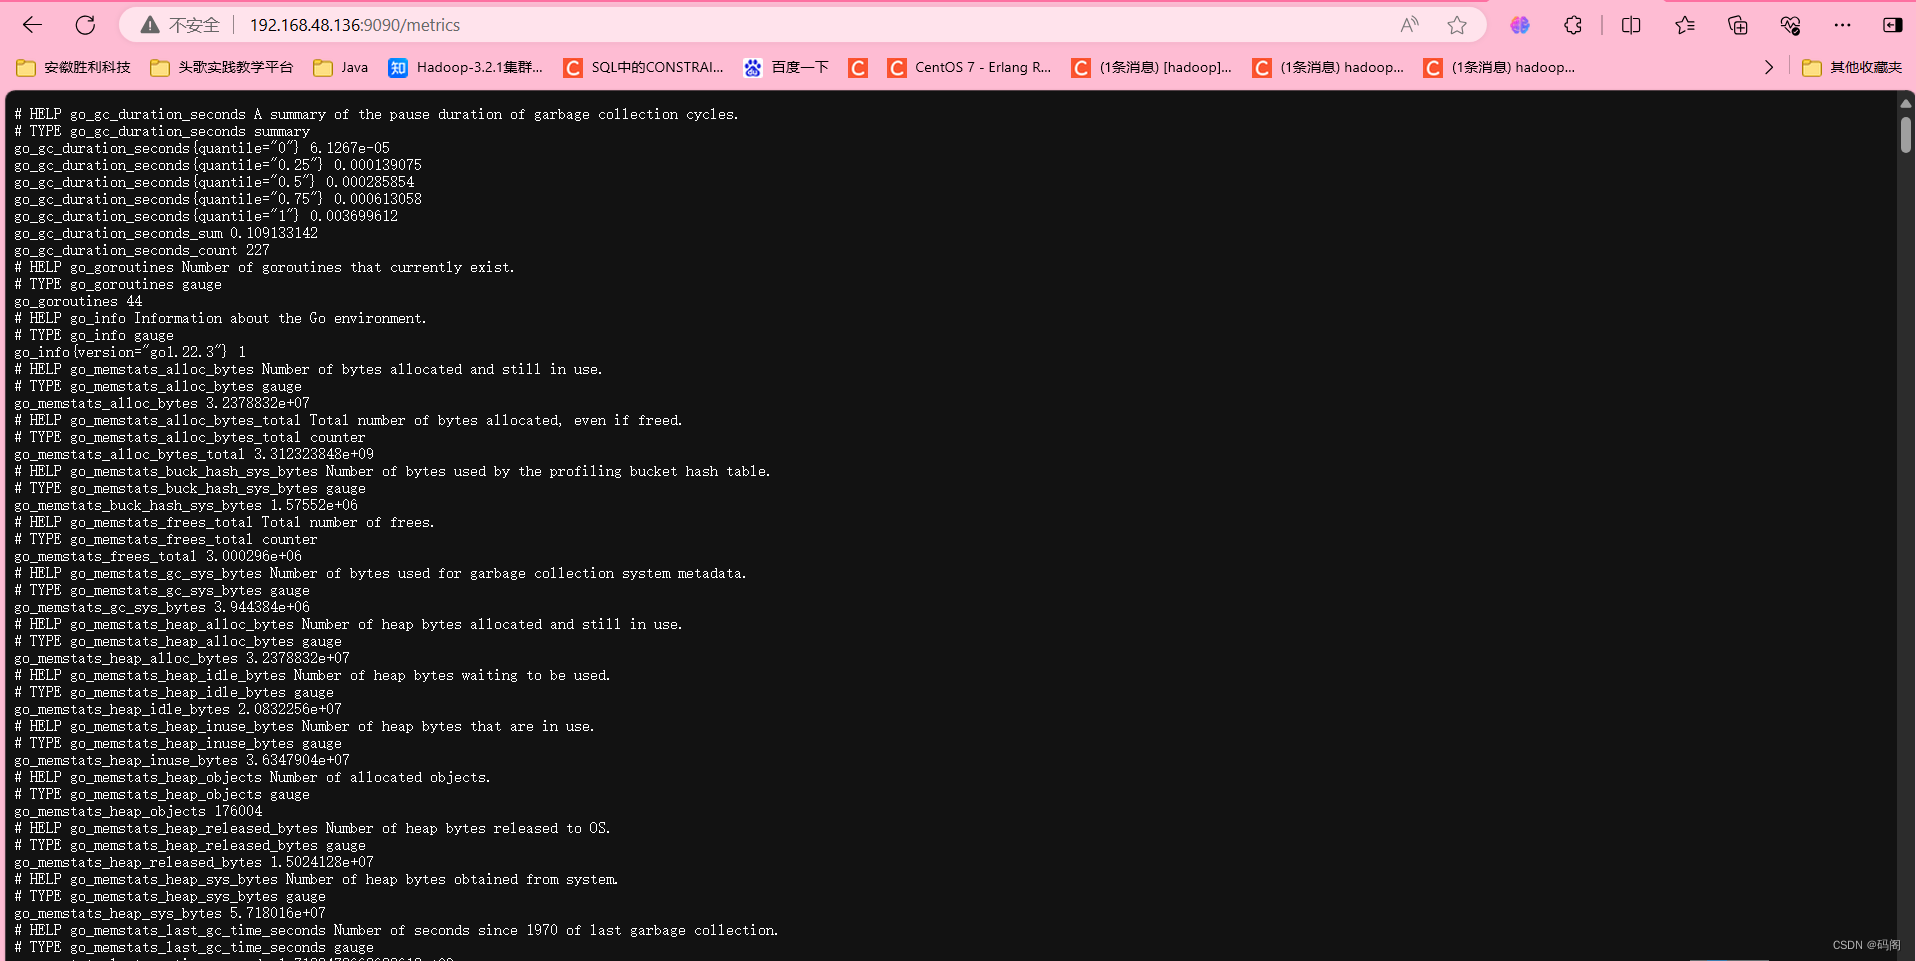
【2.4】监控本机数据展示
通过http://服务器IP:9090/metrics可以查看到监控的数据
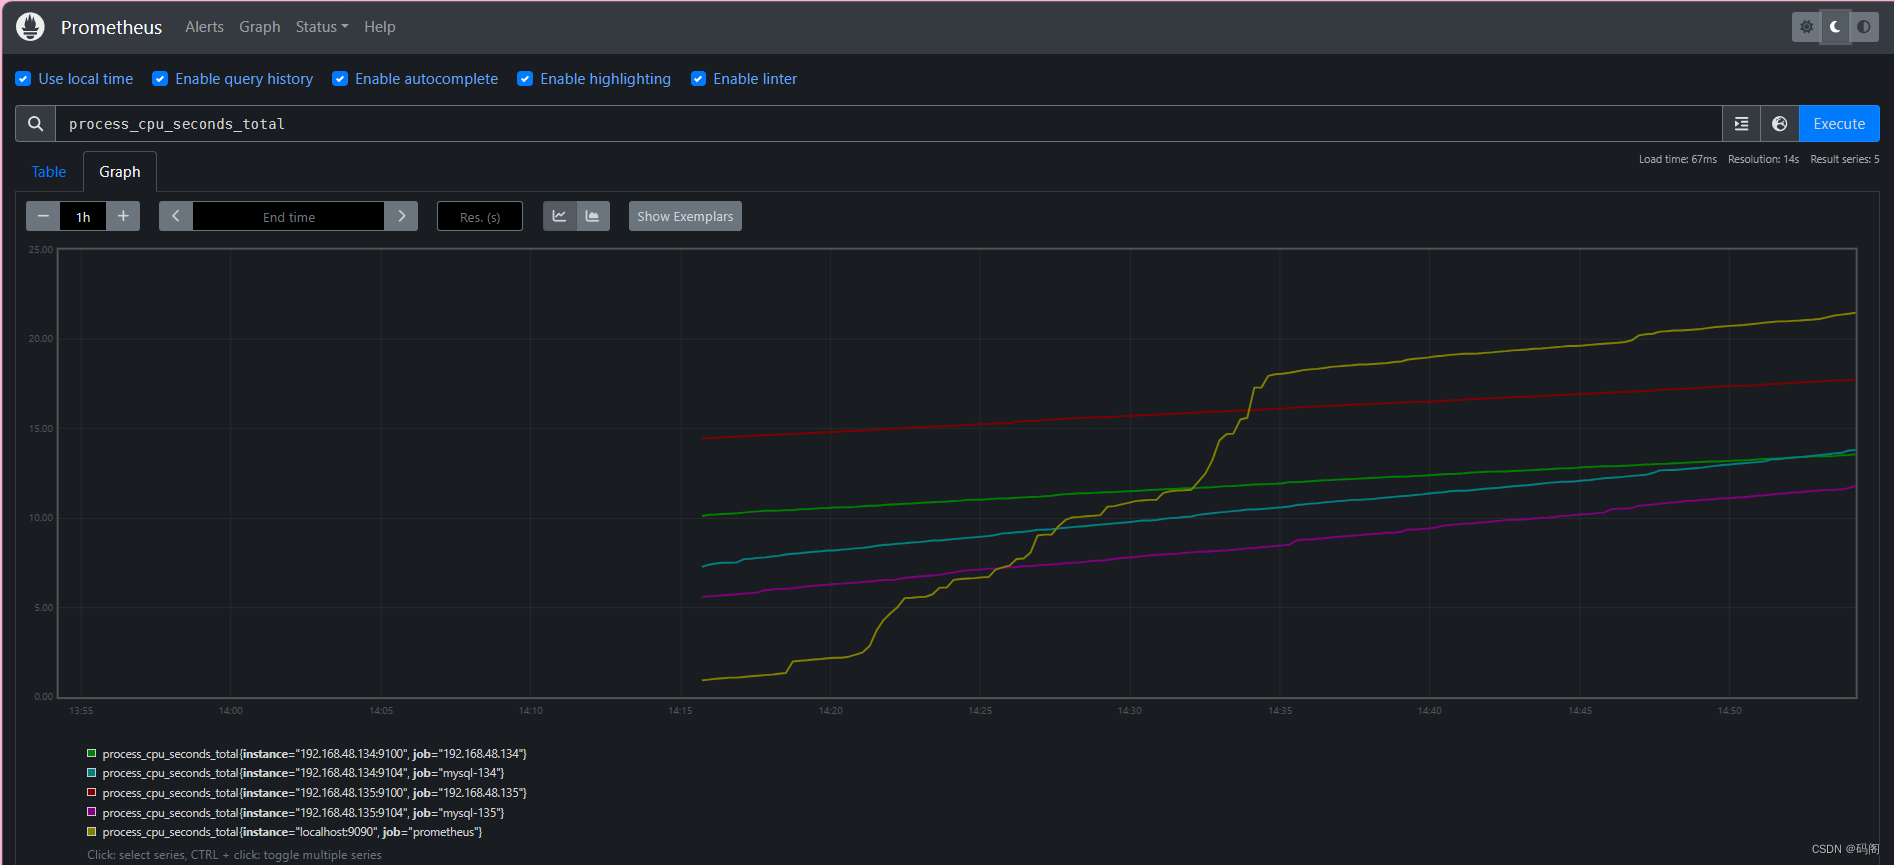
【2.5】在web主界面可以通过关键字查询监控项
三、监控远程Linux主机
【3.1】在被监控端上安装node_exporter组件
- # 解压安装包
- tar -xf node_exporter-1.8.1.linux-amd64.tar.gz -C /opt
- # 创建链接目录
- cd /opt
- ln -s node_exporter-1.8.1.linux-amd64.tar.gz node_exporter
- # 使用nohup后台运行
- nohup /opt/node_exporter/node_exporter &
- # 确认是否正常启动(默认端口9100)
- netstat -lnptu | grep 9100
- 扩展: nohup命令: 如果把启动node_exporter的终端给关闭,那么进程也会随之关闭。nohup命令会帮你解决这个问题。
同样操作,将所有需要被监控主机安装node_exporter组件
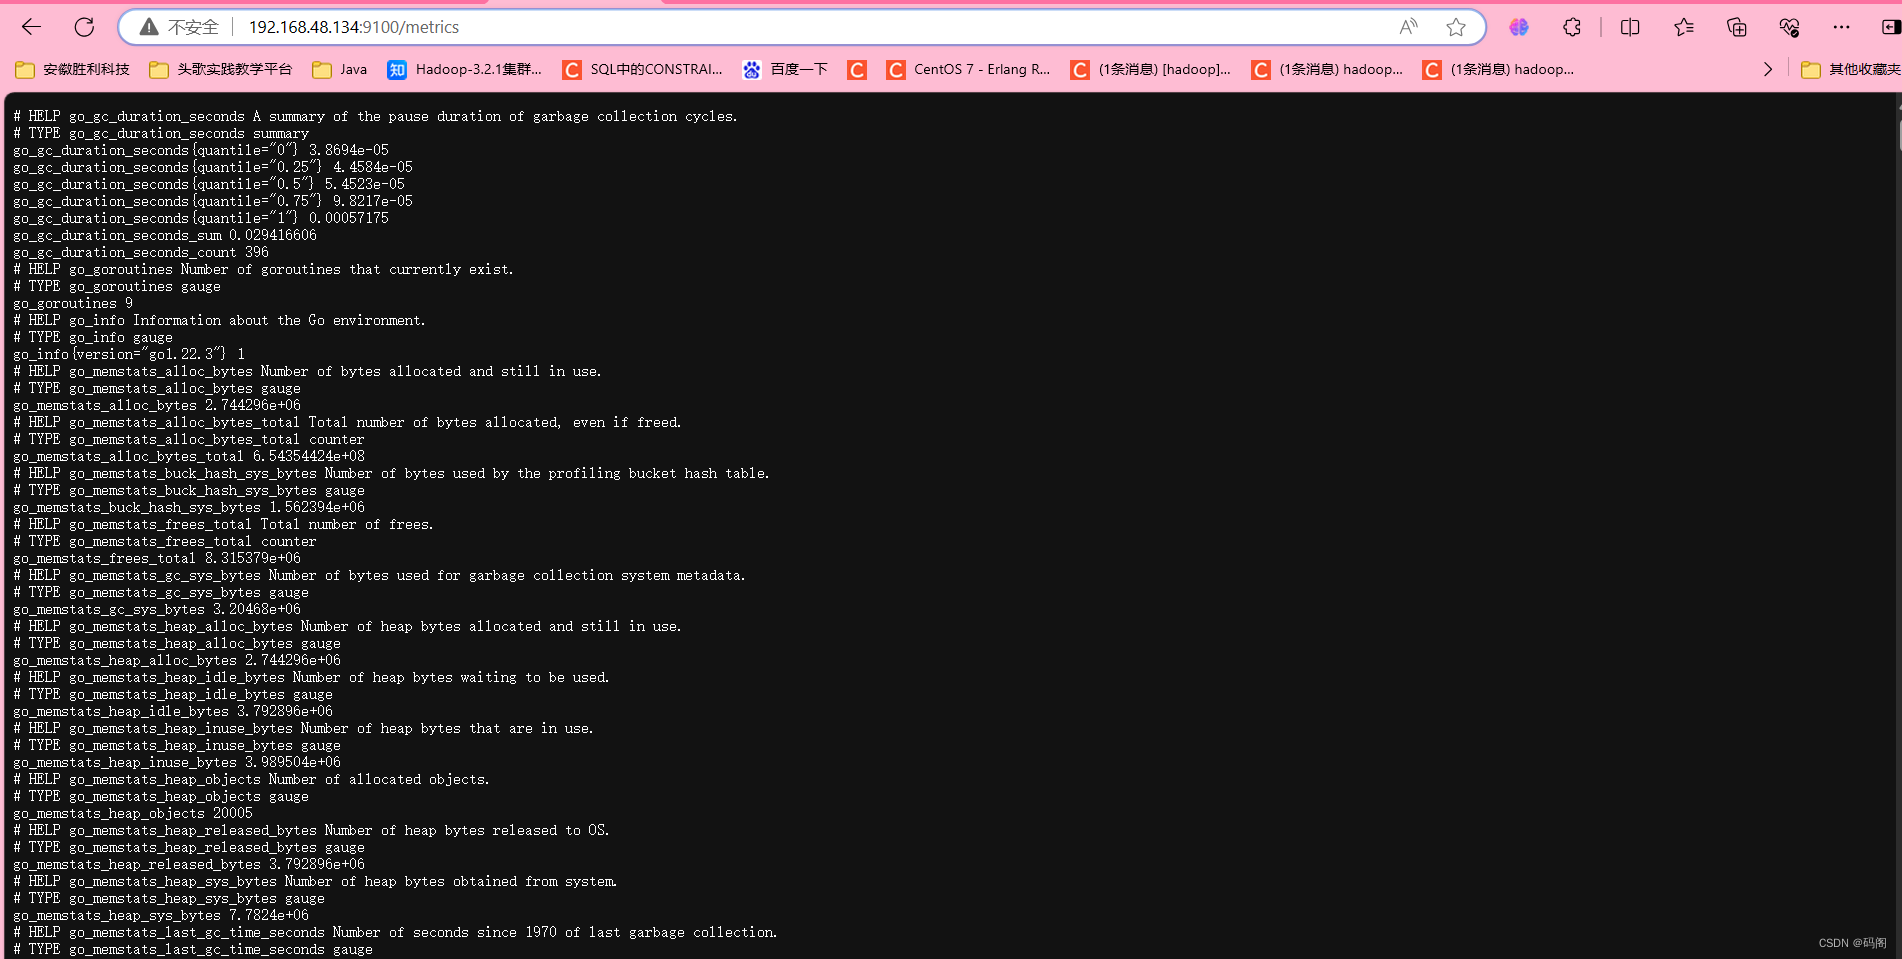
【3.2】通过浏览器访问http://被监控端IP:9100/metrics就可以查看到node_exporter在被监控端收集的监控信息
【3.3】 回到prometheus服务器的配置文件里添加被监控机器的配置段
- # my global config
- global:
- scrape_interval: 15s # Set the scrape interval to every 15 seconds. Default is every 1 minute.
- evaluation_interval: 15s # Evaluate rules every 15 seconds. The default is every 1 minute.
- # scrape_timeout is set to the global default (10s).
- # Alertmanager configuration
- alerting:
- alertmanagers:
- - static_configs:
- - targets:
- # - alertmanager:9093
- # Load rules once and periodically evaluate them according to the global 'evaluation_interval'.
- rule_files:
- # - "first_rules.yml"
- # - "second_rules.yml"
- # A scrape configuration containing exactly one endpoint to scrape:
- # Here it's Prometheus itself.
- scrape_configs:
- # The job name is added as a label `job=
` to any timeseries scraped from this config. - - job_name: "prometheus"
- static_configs:
- - targets: ["localhost:9090"]
- - job_name: '192.168.48.134' # 给被监控主机取个名字,我这里直接填的IP
- static_configs:
- - targets: ['192.168.48.134:9100'] # 这里填写被监控主机的IP和端口
- - job_name: '192.168.48.135'
- static_configs:
- - targets: ['192.168.48.135:9100']
- # scheme defaults to 'http'.
重启服务
- pkill prometheus
- /opt/prometheus/prometheus --config.file="/opt/prometheus/prometheus.yml" &
- netstat -lnptu | grep 9090
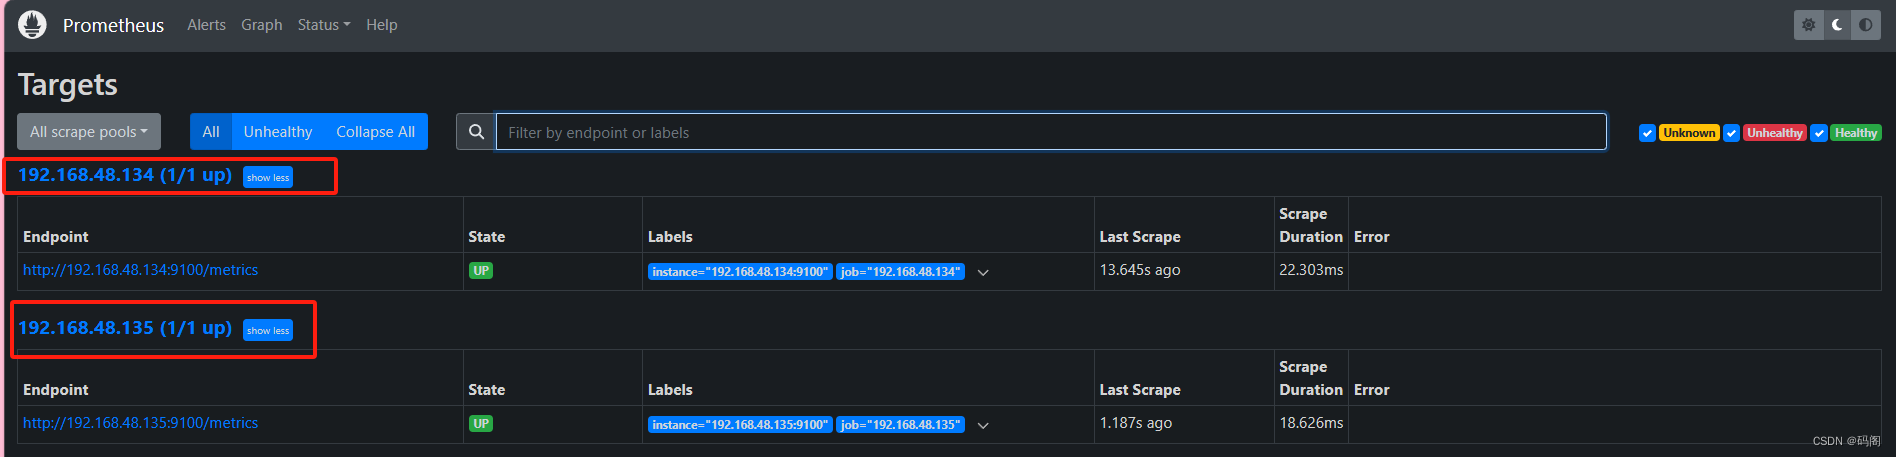
【3.4】回到web管理界面,可以看到多了两台监控主机
四、监控远程MySQL
【4.1】 在被管理MySQL服务器上安装mysqld_exporter组件
- # 解压安装包
- tar -xf mysqld_exporter-0.12.1.linux-amd64.tar.gz -C /opt
- # 创建链接目录
- cd /opt
- ln -s mysqld_exporter-0.12.1.linux-amd64 mysqld_exporter
- # 在MySQL服务器上创建监控用户
- mysql> grant select,replication client, process on *.* to 'mysql_monitor'@'localhost' identified by 'xxxxxxxxxxxxx';
- Query OK, 0 rows affected, 1 warning (0.00 sec)
- mysql> flush privileges;
- Query OK, 0 rows affected (0.03 sec)
- mysql> exit
- Bye
- # 将上面创建的mysql用户信息写入mysqld_exporter配置文件
- vim /opt/mysqld_exporter/.my.cnf
- [client]
- user=mysql_monitor
- password=xxxxxxxxxxx
- # 启动mysqld_exporter
- nohup /opt/mysqld_exporter/mysqld_exporter --config.my-cnf=/opt/mysqld_exporter/.my.cnf &
- # 确认是否正常启动(默认端口9104)
- netstat -lnptu | grep 9104
【5.2】回到prometheus服务器的配置文件里添加被监控的mariadb的配置段
- # my global config
- global:
- scrape_interval: 15s # Set the scrape interval to every 15 seconds. Default is every 1 minute.
- evaluation_interval: 15s # Evaluate rules every 15 seconds. The default is every 1 minute.
- # scrape_timeout is set to the global default (10s).
- # Alertmanager configuration
- alerting:
- alertmanagers:
- - static_configs:
- - targets:
- # - alertmanager:9093
- # Load rules once and periodically evaluate them according to the global 'evaluation_interval'.
- rule_files:
- # - "first_rules.yml"
- # - "second_rules.yml"
- # A scrape configuration containing exactly one endpoint to scrape:
- # Here it's Prometheus itself.
- scrape_configs:
- # The job name is added as a label `job=
` to any timeseries scraped from this config. - - job_name: "prometheus"
- static_configs:
- - targets: ["localhost:9090"]
- - job_name: '192.168.48.134' # 给被监控主机取个名字,我这里直接填的IP
- static_configs:
- - targets: ['192.168.48.134:9100'] # 这里填写被监控主机的IP和端口
- - job_name: '192.168.48.135'
- static_configs:
- - targets: ['192.168.48.135:9100']
- - job_name: 'mysql-134' # 给被监控主机取个名字
- static_configs:
- - targets: ['192.168.48.134:9104'] # 这里填写被监控主机的IP和端口
- - job_name: 'mysql-135'
- static_configs:
- - targets: ['192.168.48.135:9104']
- # metrics_path defaults to '/metrics'
- # scheme defaults to 'http'.
重启服务
- pkill prometheus
- /opt/prometheus/prometheus --config.file="/opt/prometheus/prometheus.yml" &
- netstat -lnptu | grep 9090
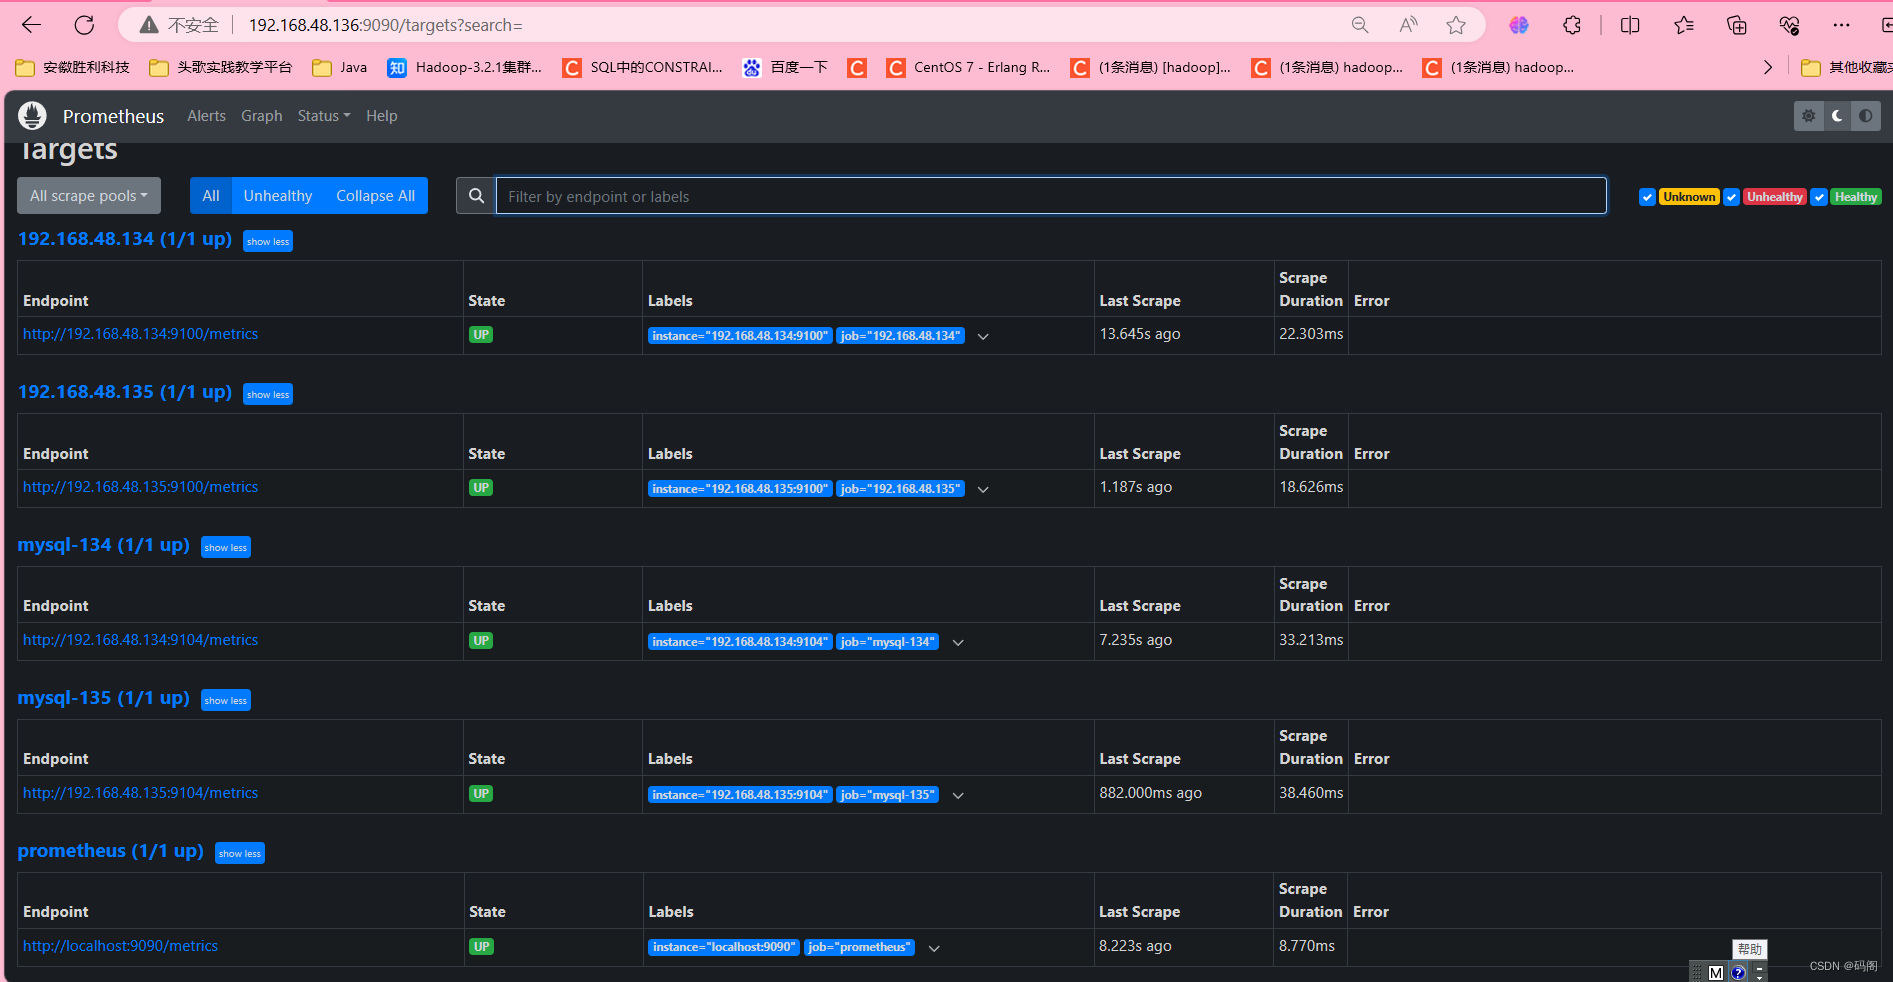
【5.3】回到web管理界面点Status-->Targets-->就可以看到监控的MySQL服务器了
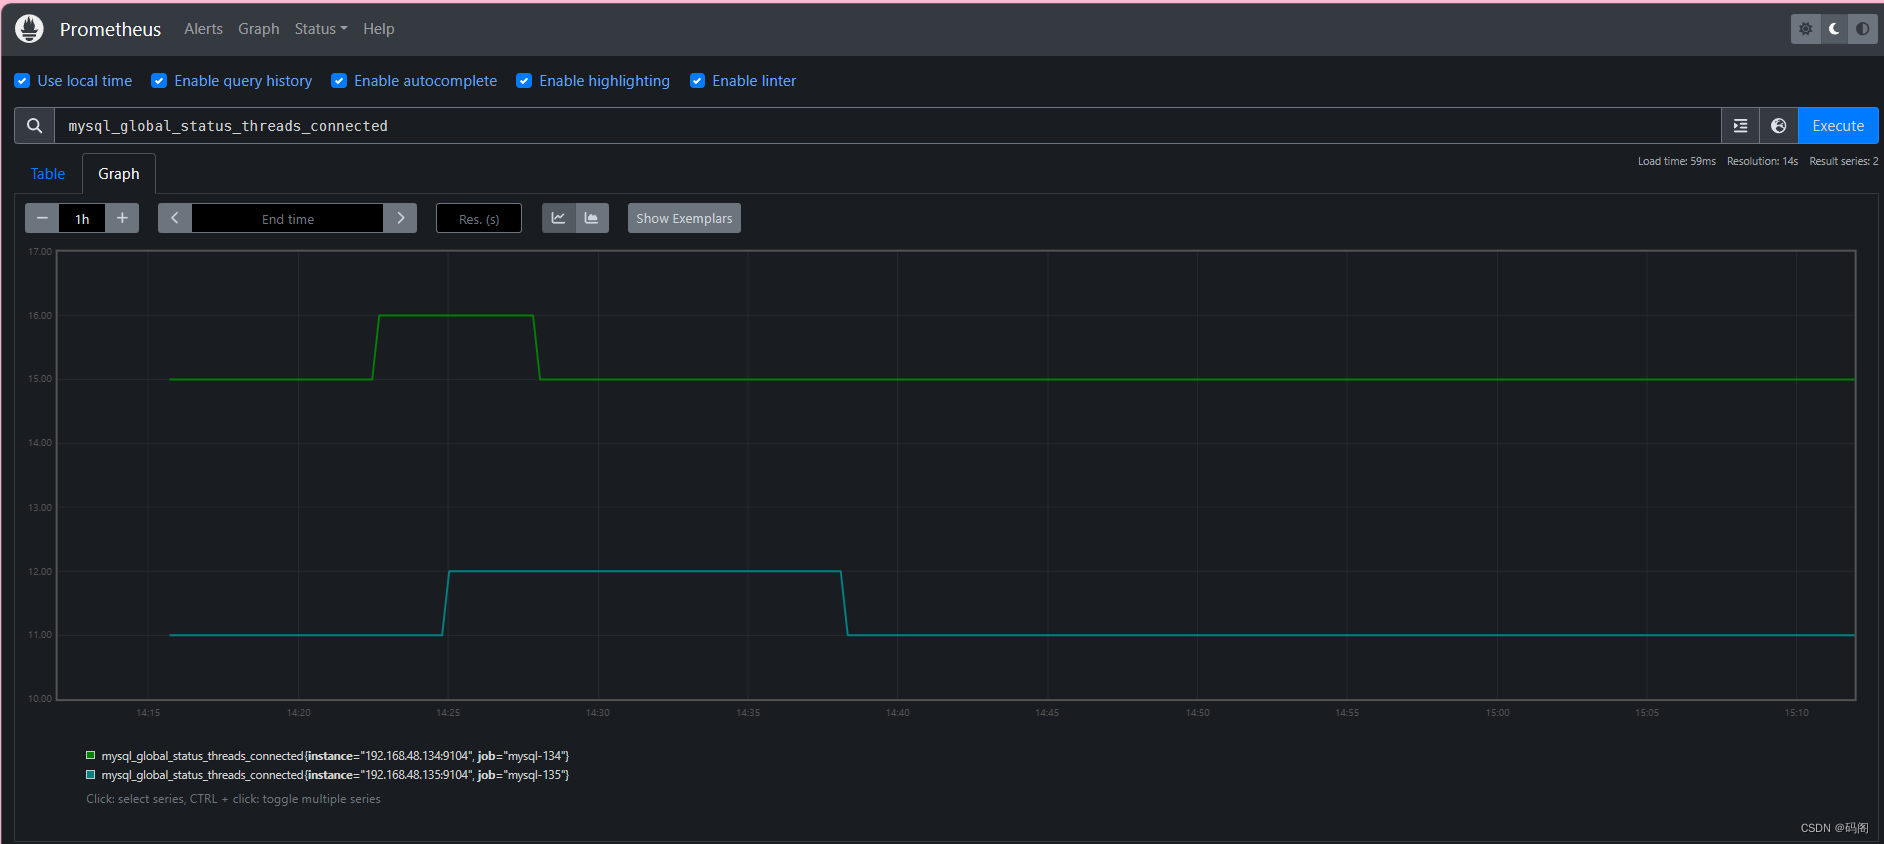
回到主界面搜索mysql相关参数
五、Grafana可视化图形工具
【5.1】安装grafana服务器
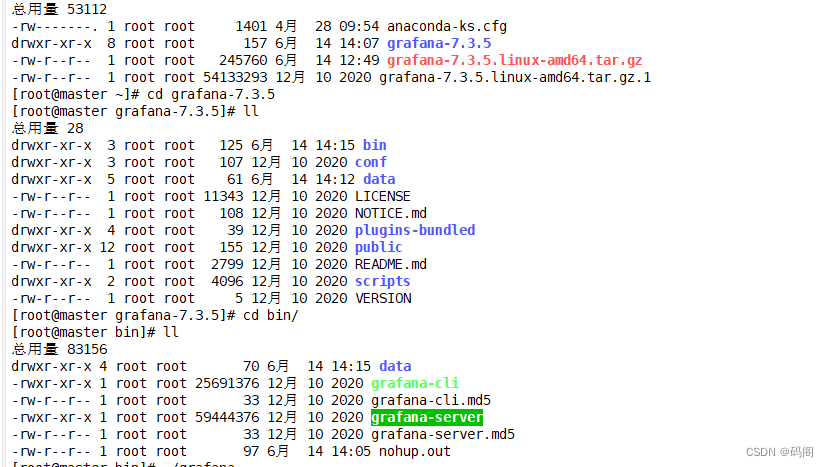
- #解压grafana安装包
- tar -zxvf grafana-7.3.5.linux-amd64.tar.gz -C /opt
- cd /opt/grafana-7.3.5/bin/
- #启动
- ./grafana-server
- 查看端口
- netstat -lnptu | grep 3000
 通过浏览器访问 http:// ip服务器IP:3000就到了登录界面,使用默认用户名admin,密码admin
登录进入首页
 六、在Grafana上添加Prometheus数据源
【6.1】我们把prometheus服务器收集的数据做为一个数据源添加到grafana,让grafana可以得到prometheus的数据
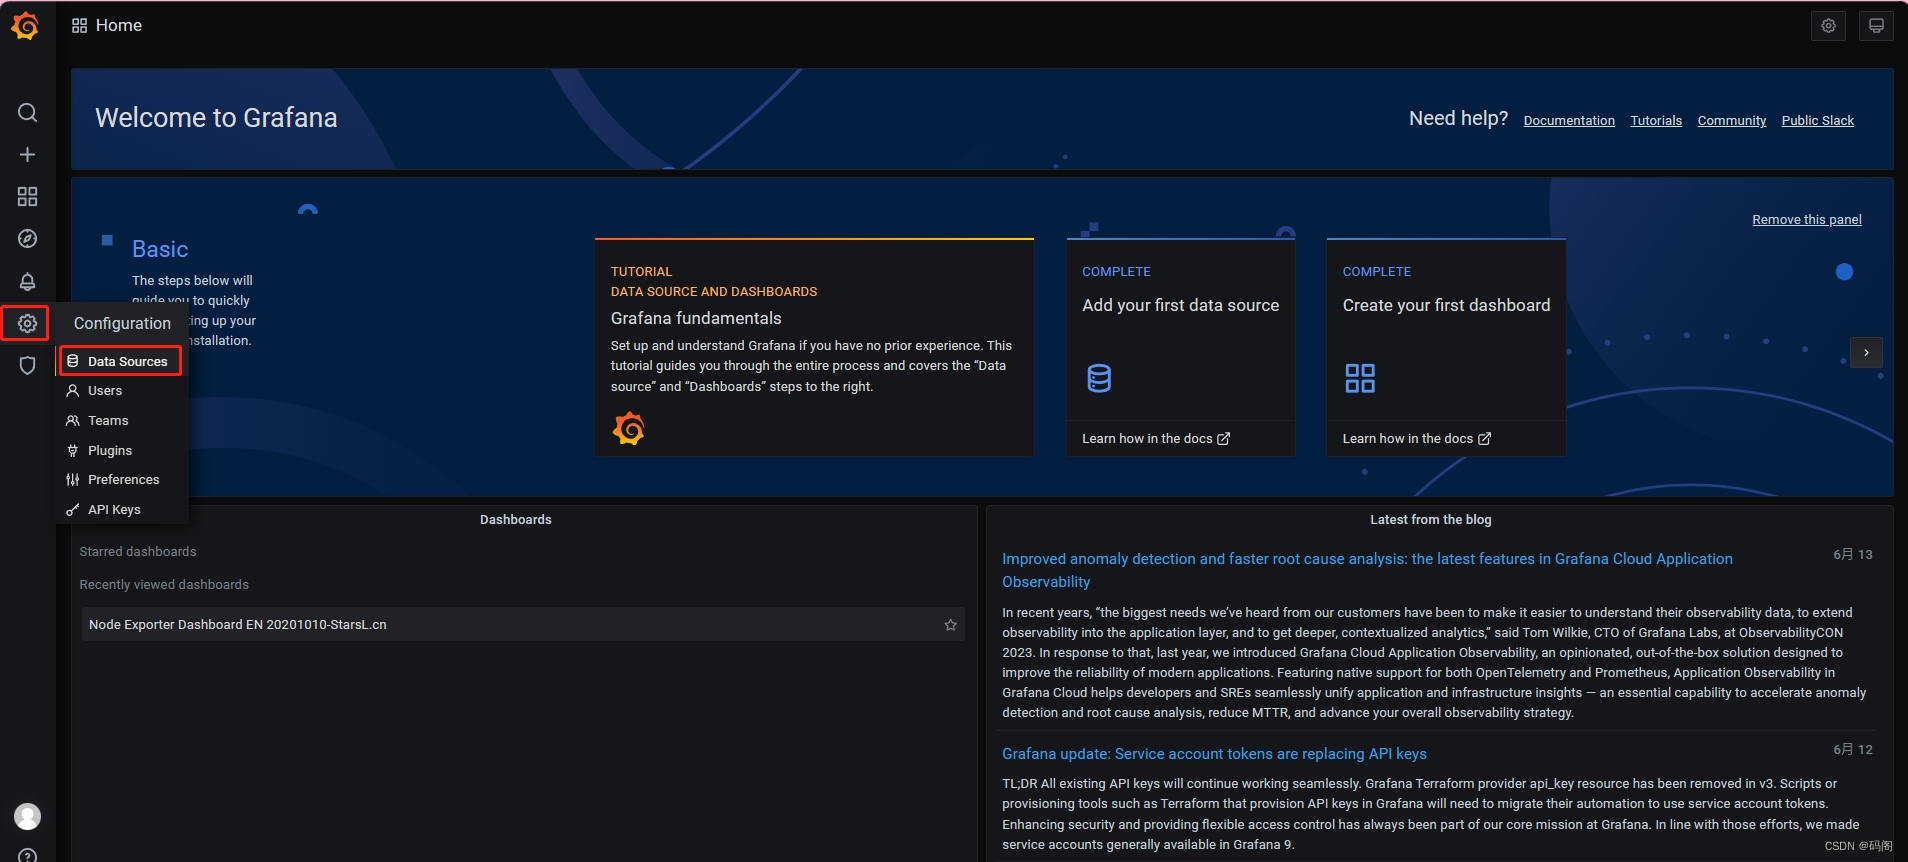
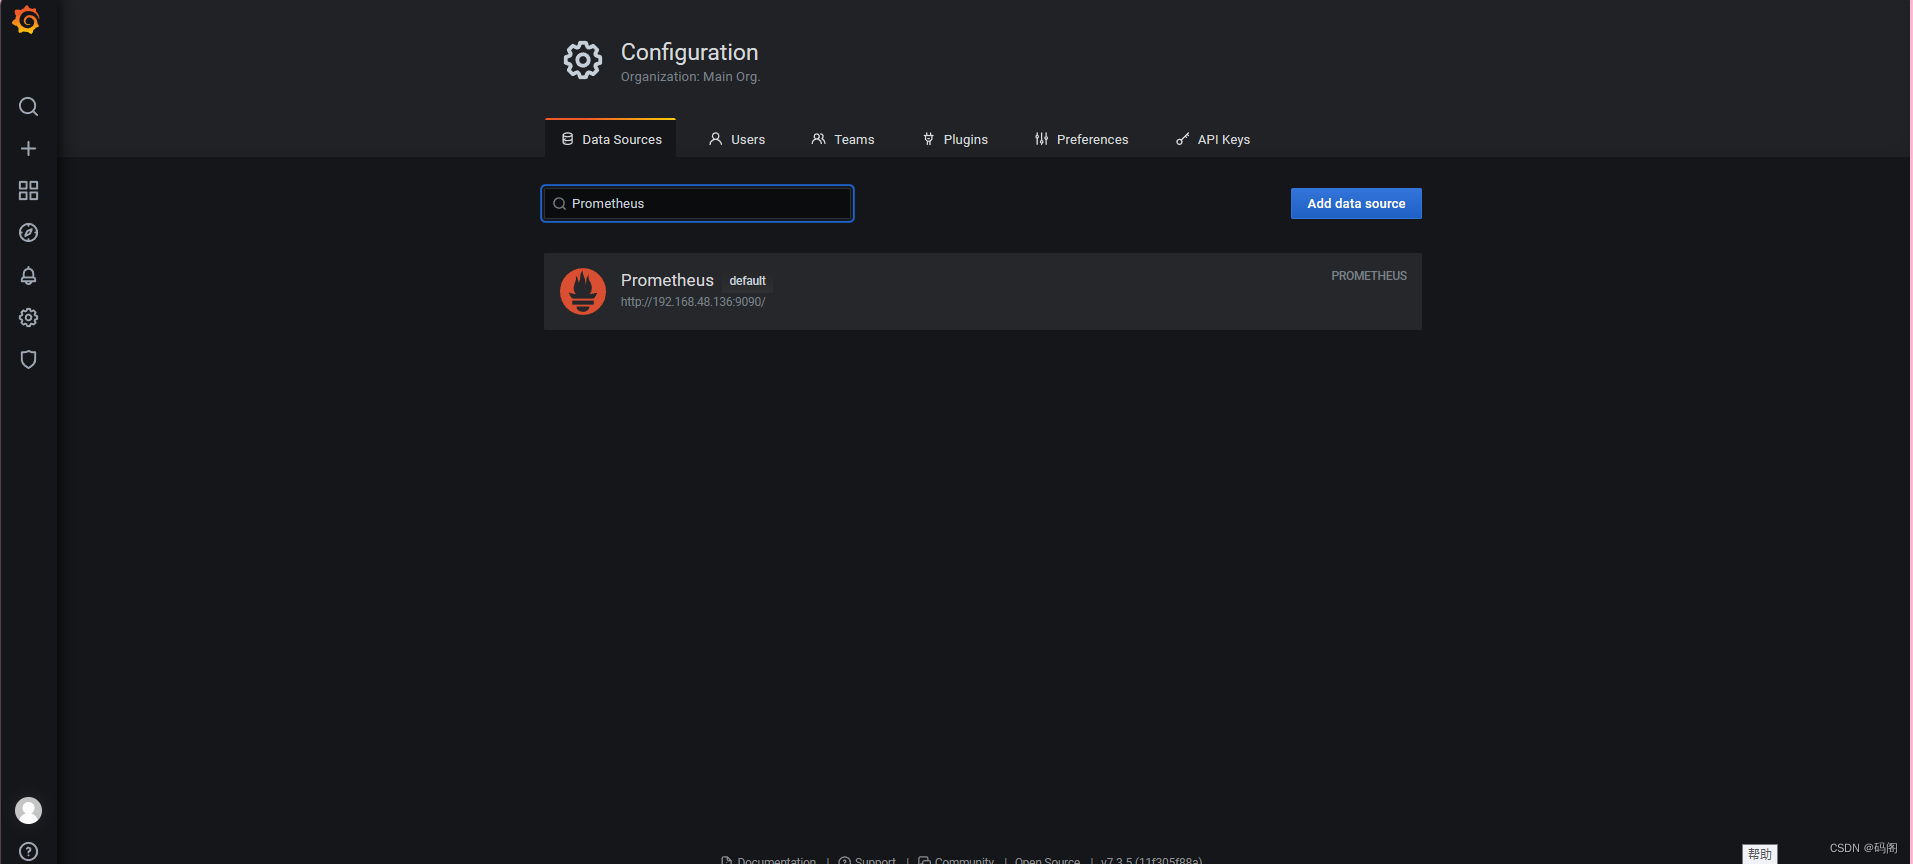
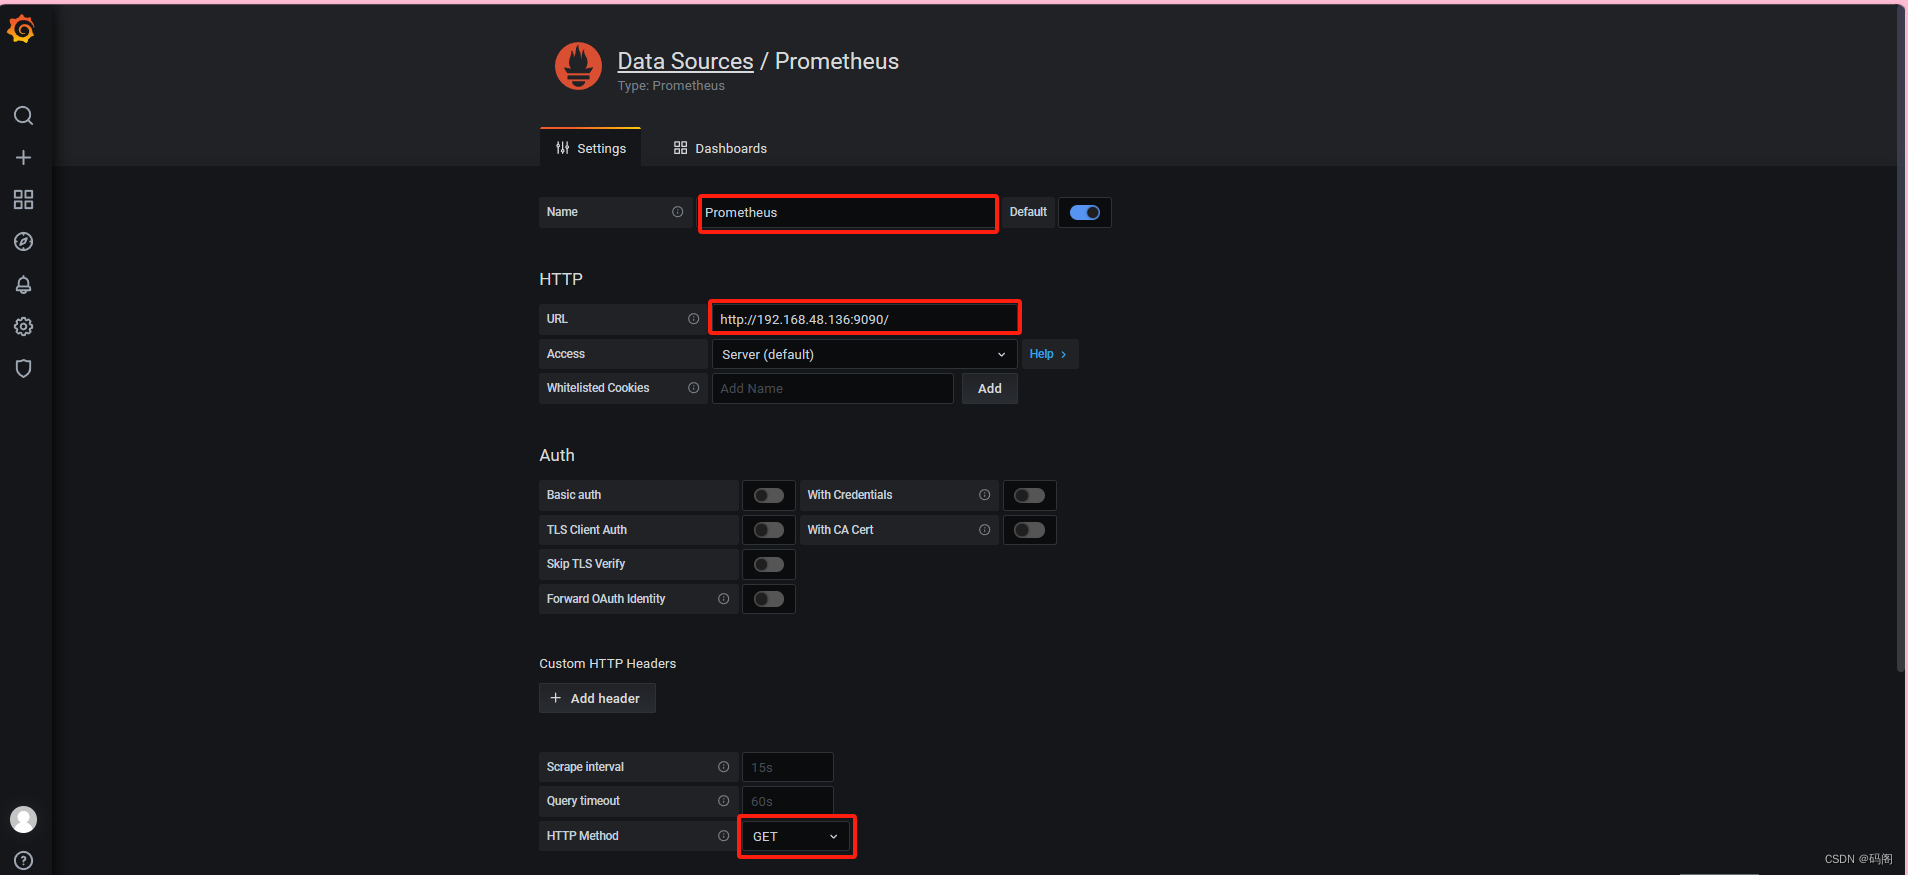
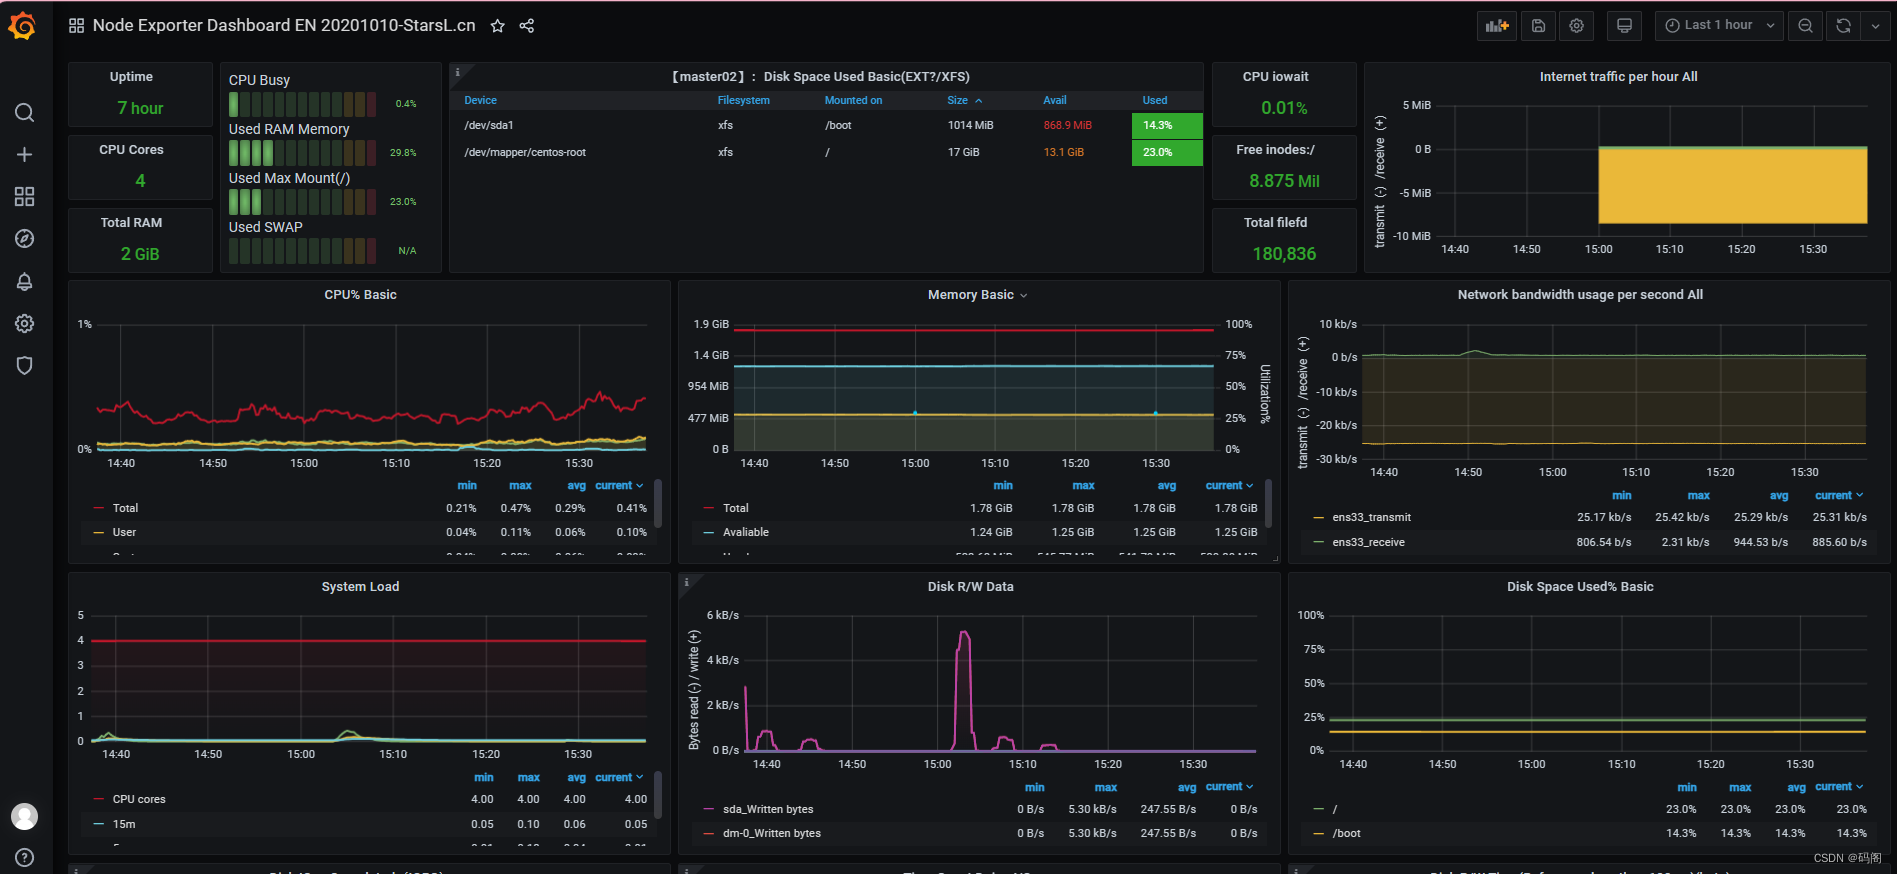
七、Grafana图形显示Linux硬件信息
- Grafana官方提供模板地址:Grafana dashboards | Grafana Labs
- 本次要导入的模板:Node Exporter Dashboard EN 20201010-StarsL.cn | Grafana Labs
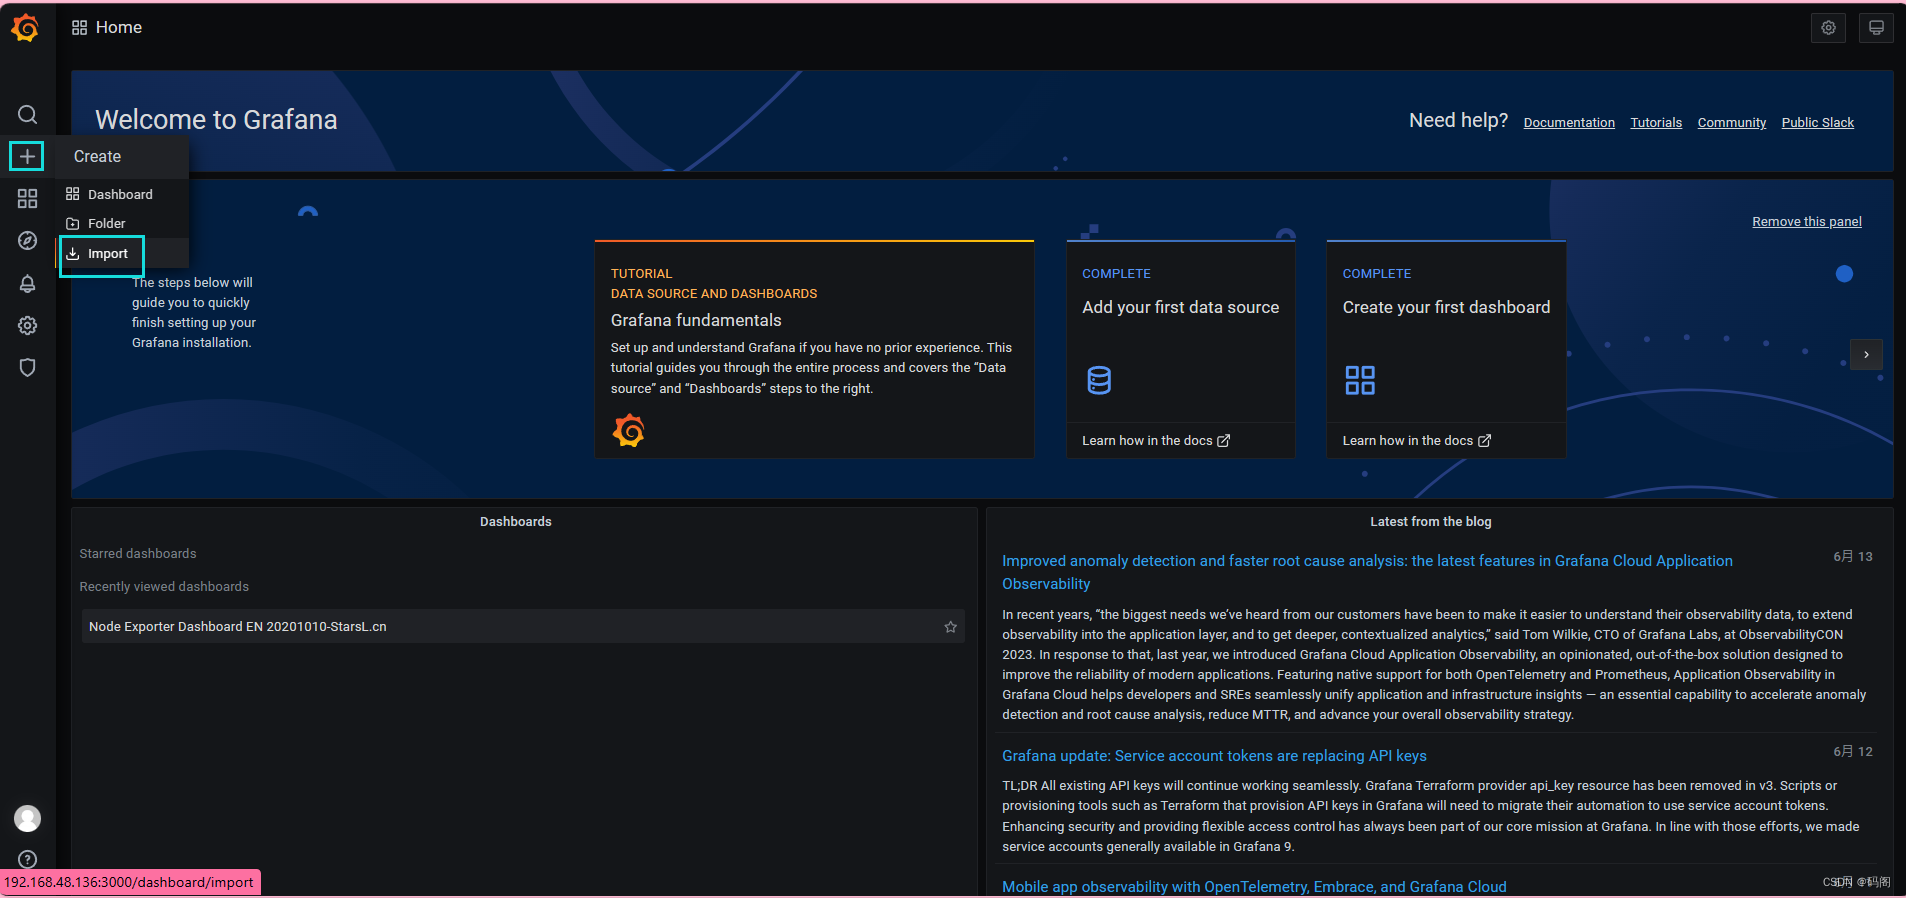
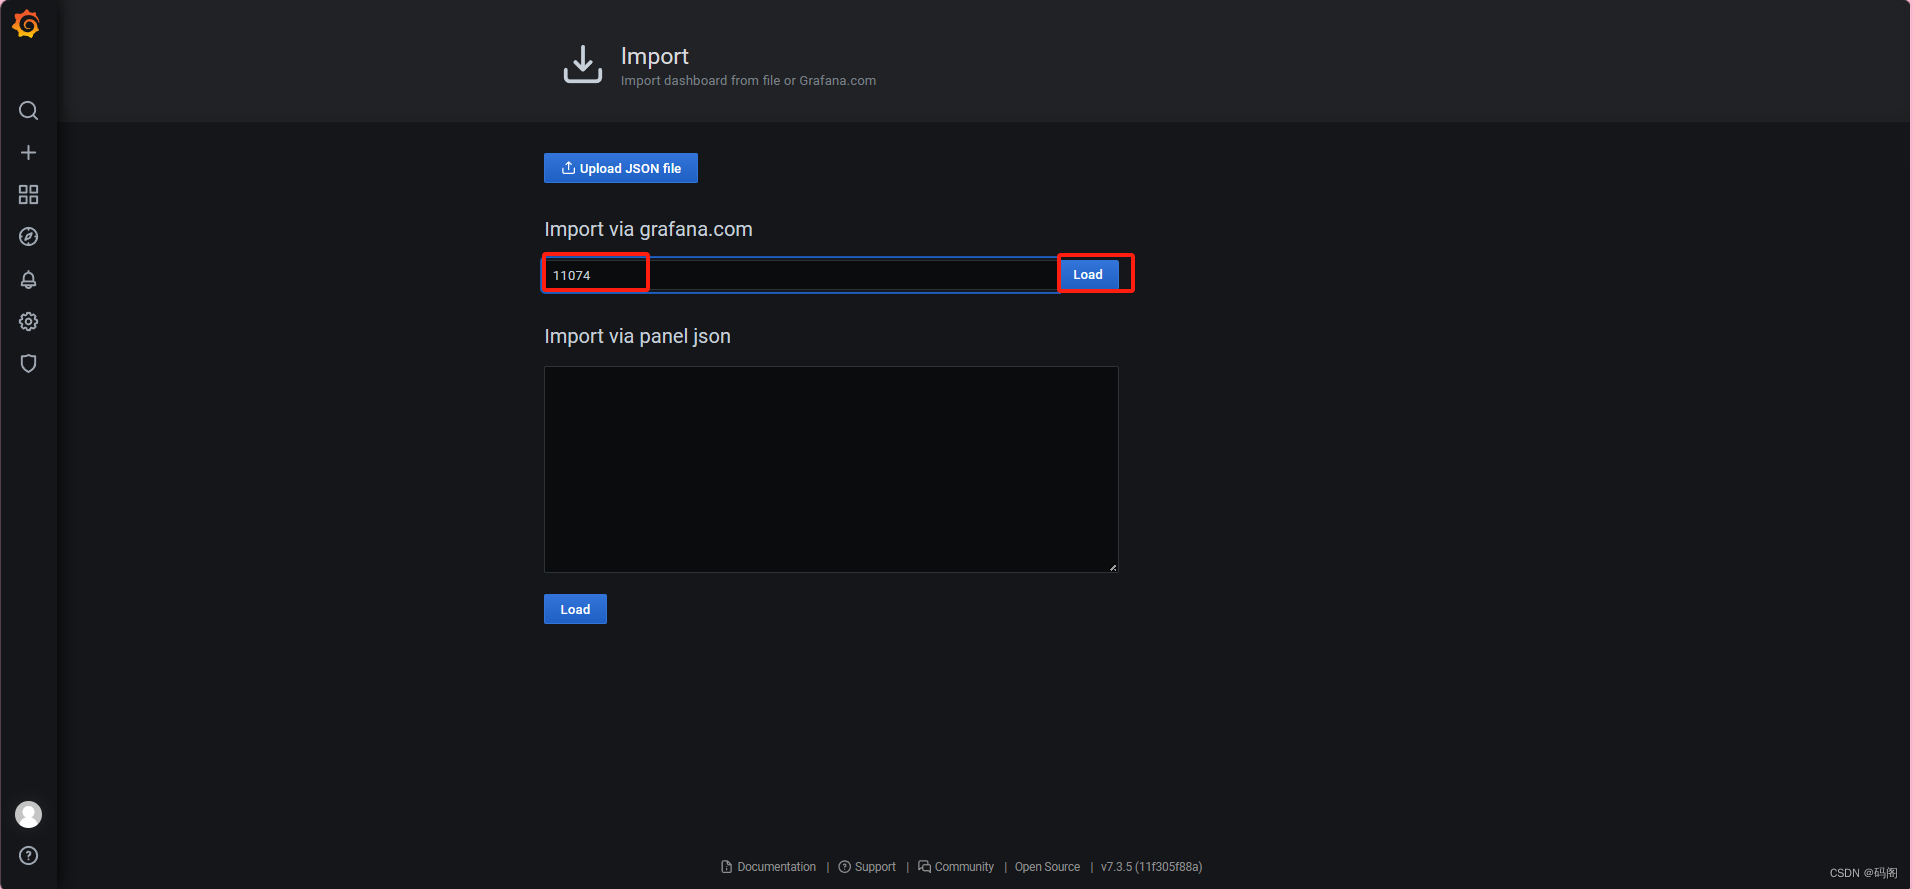
刚刚添加的
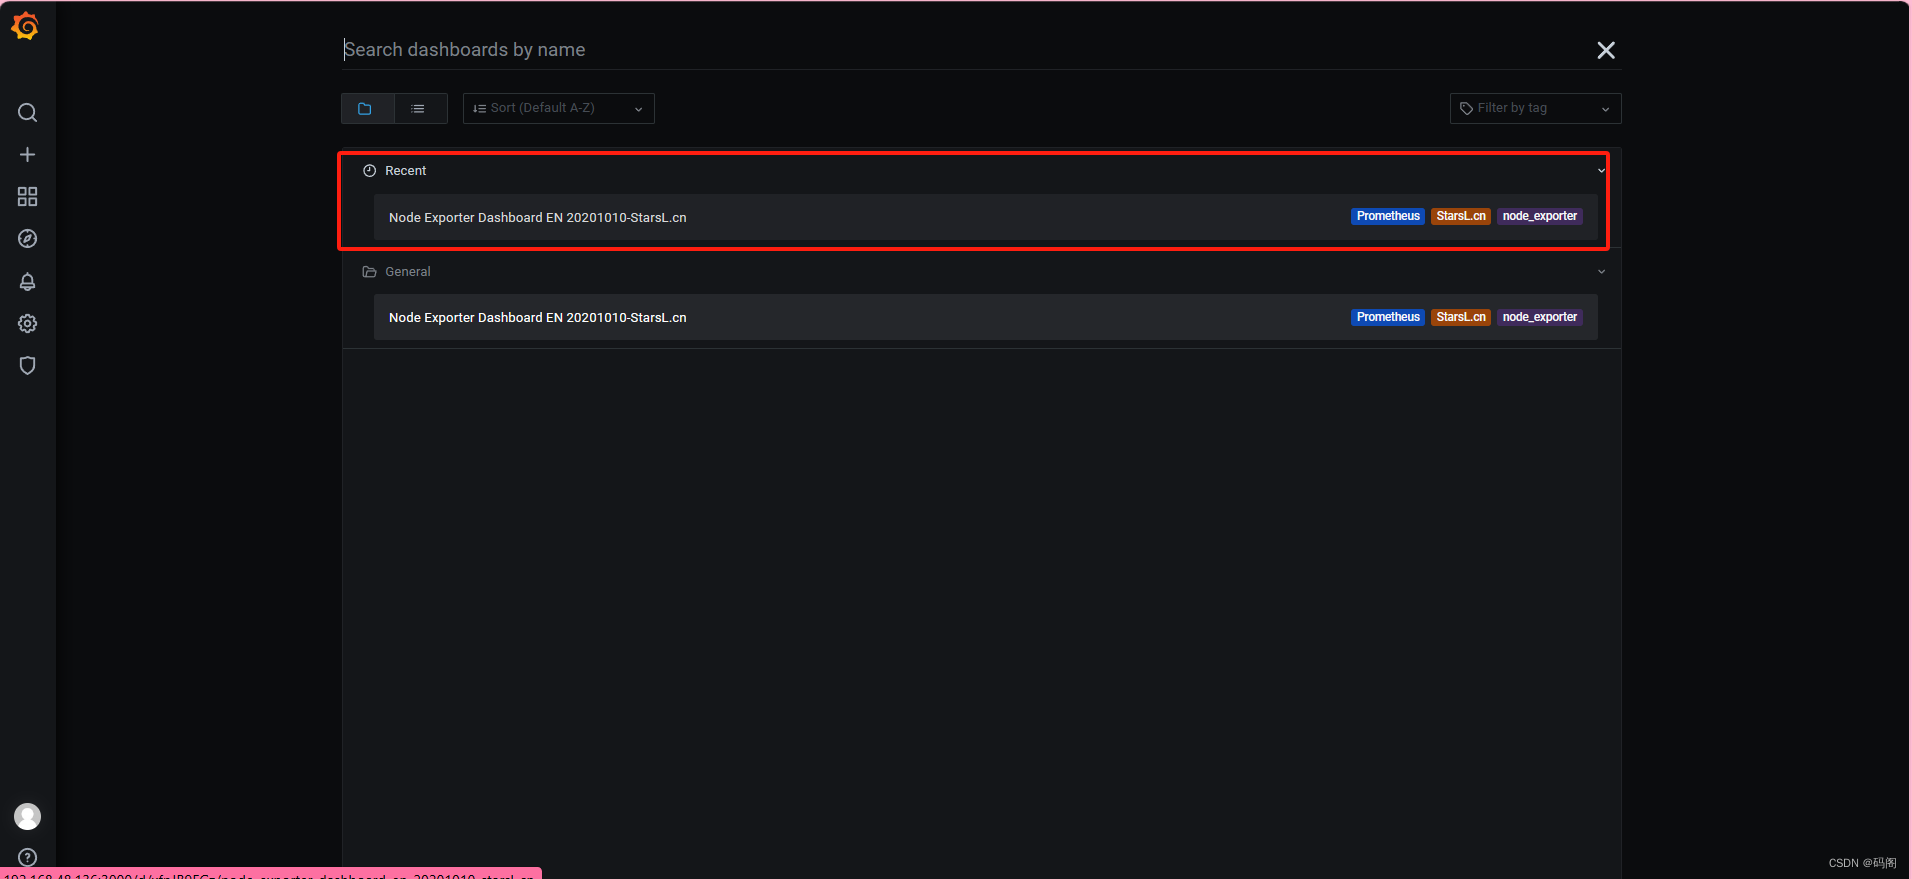
查看效果
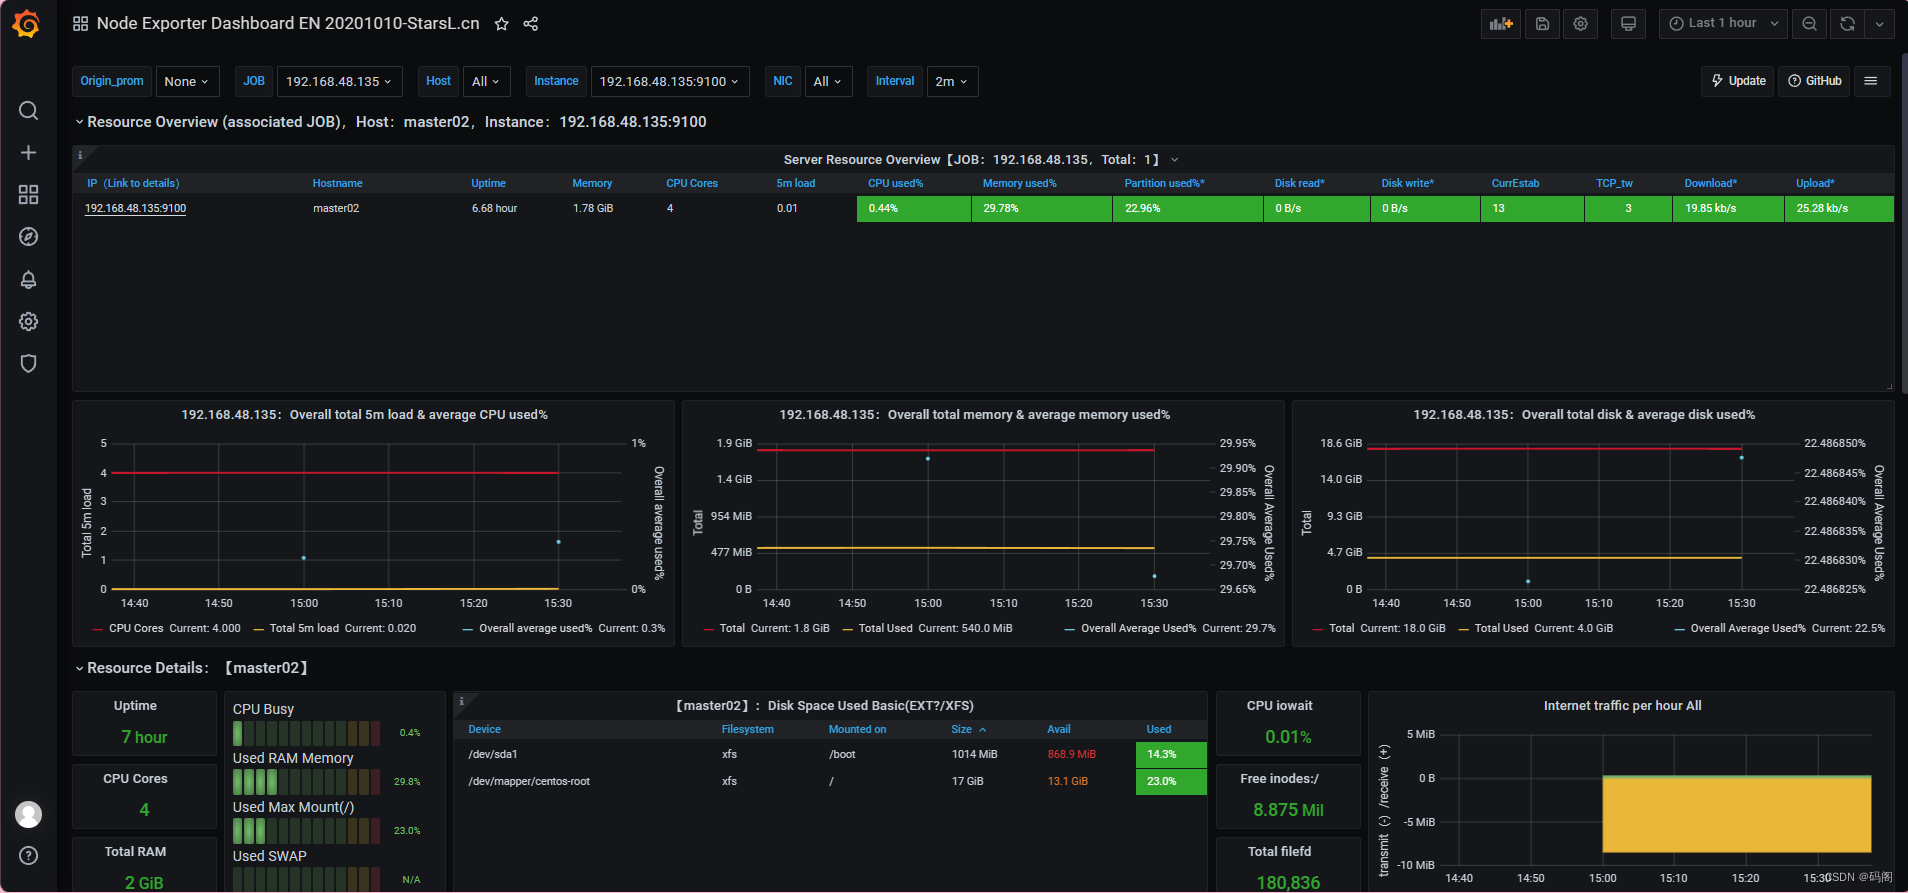

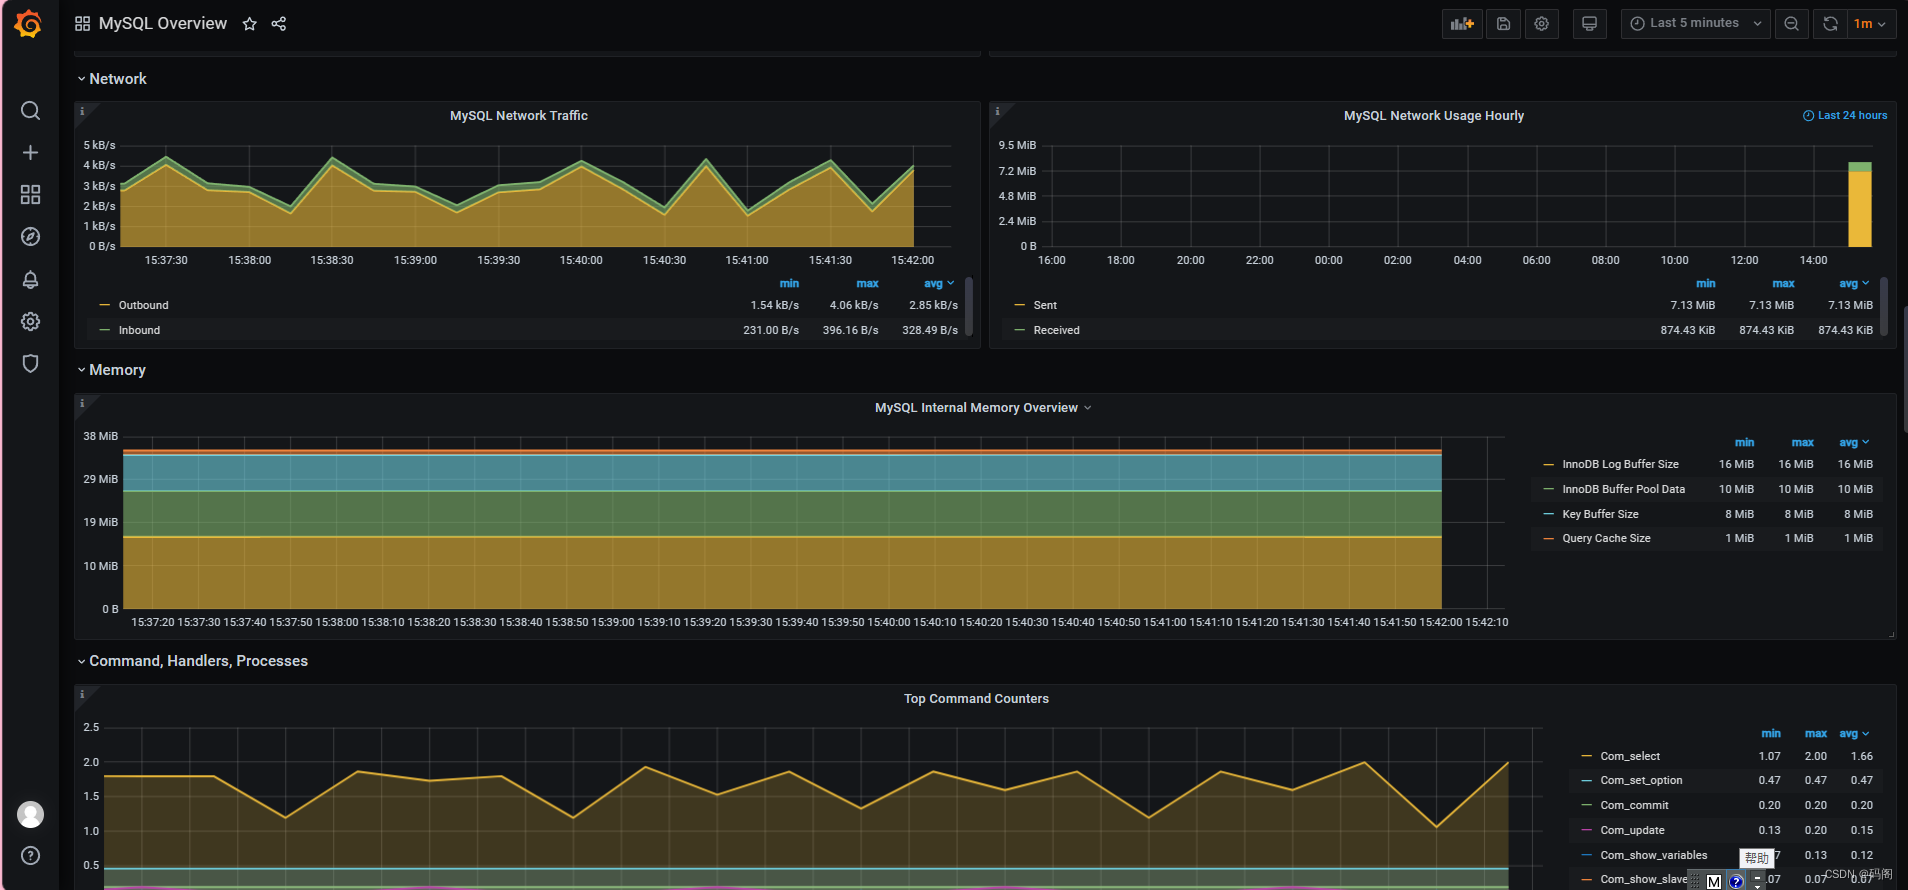
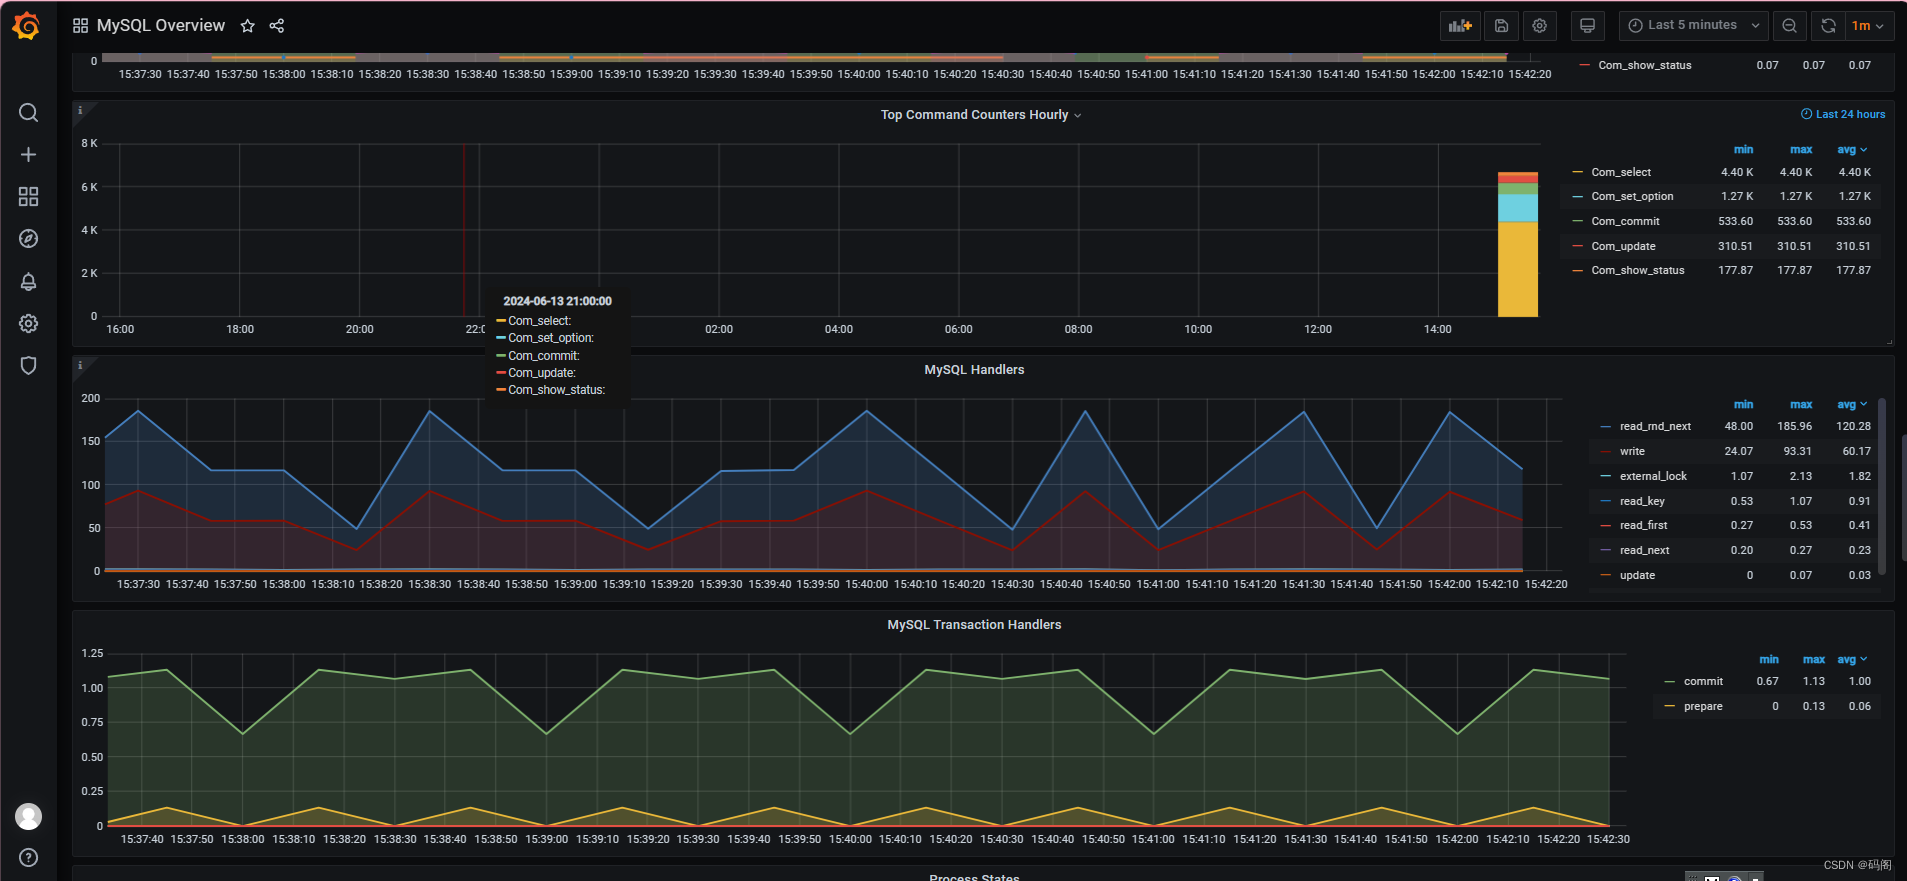
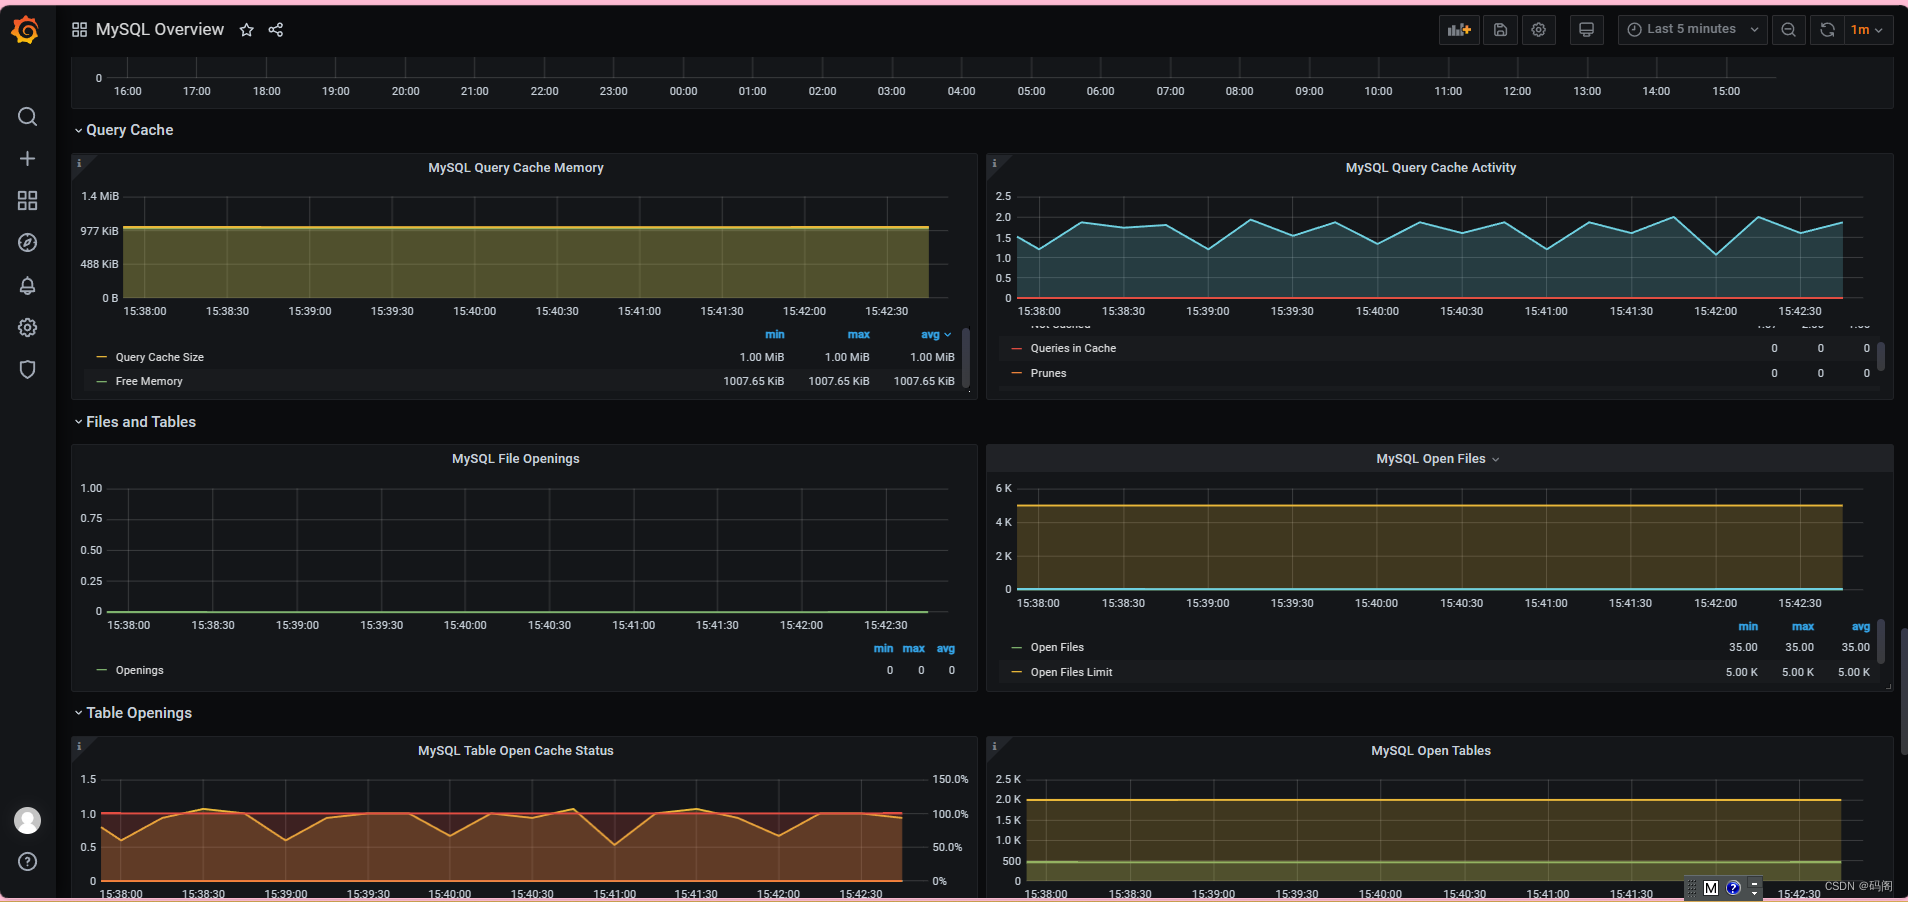
八、 Grafana图形显示MySQL监控数据
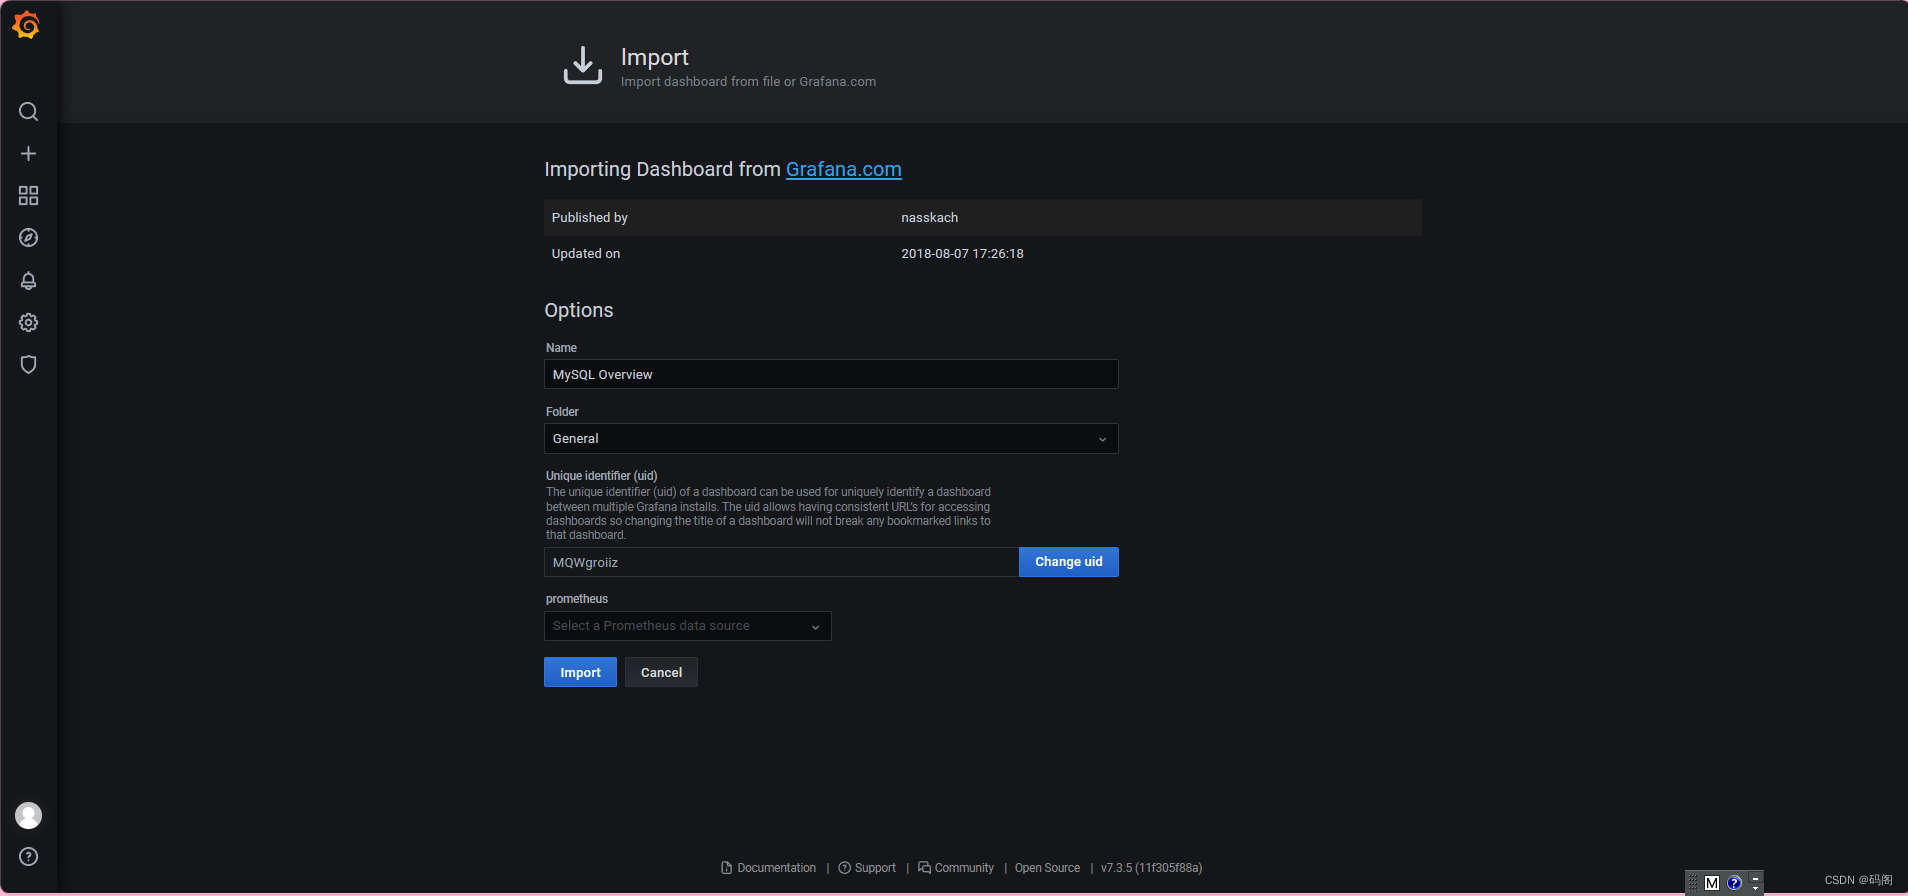
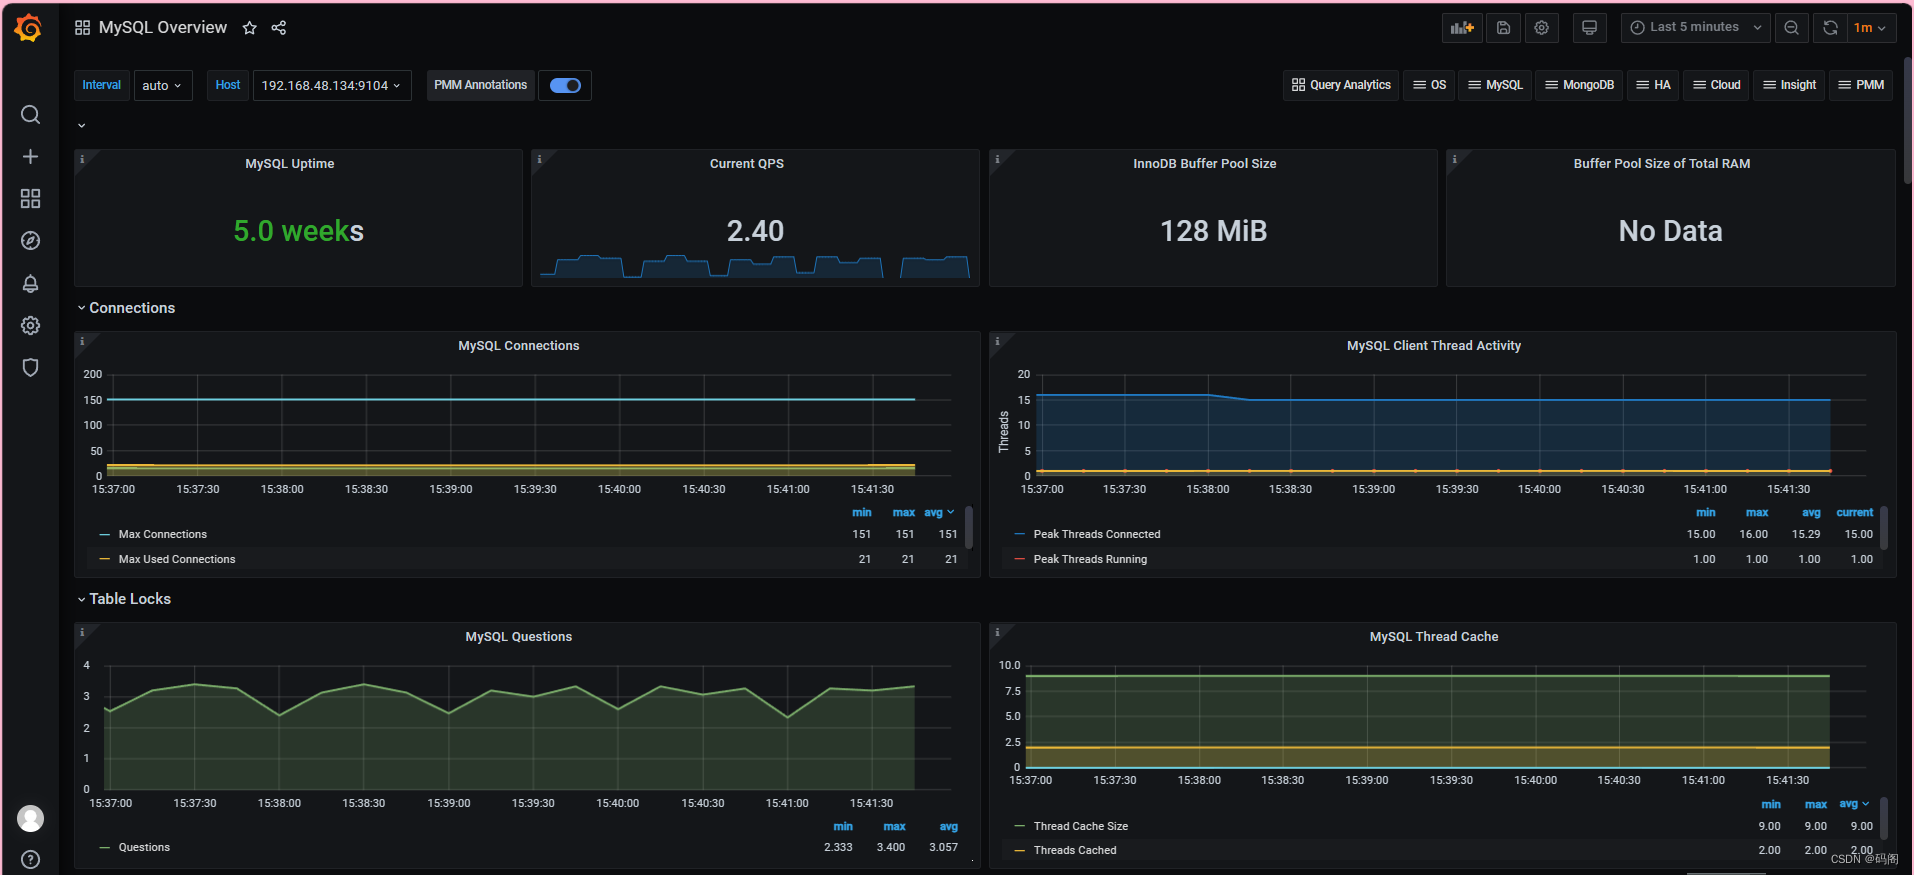
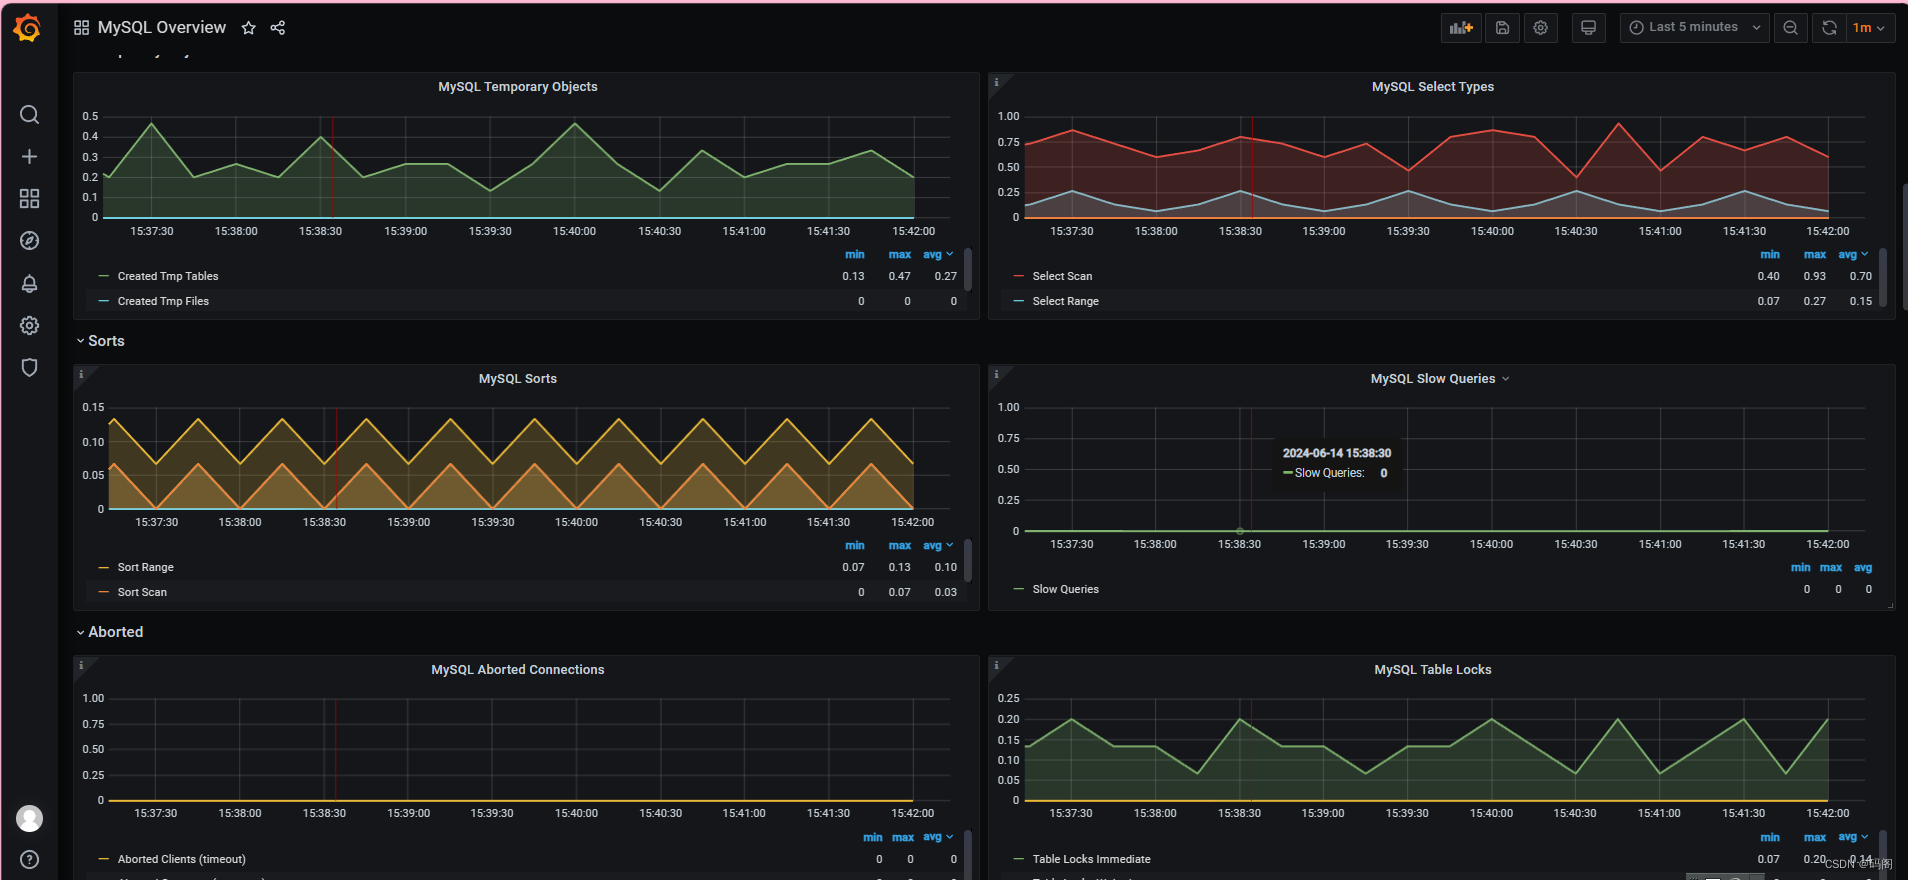
【8.1】通过Grafana官网导入模板
九、修改grafana配置文件,添加发件邮箱
- vim /etc/grafana/grafana.ini # 找到smtp关键字
- #################################### SMTP / Emailing ##########################
- [smtp]
- enabled = true # 改成true
- host = smtp.exmail.qq.com:465 # 发送服务器地址和端口
- user = # 这里填写发件邮箱
- # If the password contains # or ; you have to wrap it with triple quotes. Ex """#password;"""
- password = # 这里填写发件邮箱密码或授权密码
- ;cert_file =
- ;key_file =
- skip_verify = true # 改成true
- from_address = # 这里填写发件邮箱
- ;from_name = Grafana
- # EHLO identity in SMTP dialog (defaults to instance_name)
- ;ehlo_identity = dashboard.example.com
- # SMTP startTLS policy (defaults to 'OpportunisticStartTLS')
- ;startTLS_policy = NoStartTLS
后面的发件邮箱就不在说明了
参考博客:Prometheus+Grafana监控MySQL - easydba - 博客园 (cnblogs.com)
-
相关阅读:
《爱在 ZStack Cube 超融合》三部曲
使用HTML制作静态网站:传统文化戏剧锡剧带psd设计图(2个页面)
ThreadPool实现机制
el-input输入框涉及到scope的校验问题
Oracle GoldenGate实现数据同步(Windows环境下的内外网同步)
gRPC 自定义负载均衡算法
Prompt-Tuning源码分析
Linux常用命令
8月算法训练------第十四天(数学)解题报告
基于Python实现的糖尿病预测系统
- 原文地址:https://blog.csdn.net/qq_60275529/article/details/139681093
- 最新文章
-
【FHE】我们如何实现同态加密推理(八):SiLU 的密文化——两条路径,和一个 8 字节的开关
SQLcl 中 c/old/new 替换变量为何失效?先定位再替换
不让模型写作文,直接从它脑子里读答案:Jev 决策在 .NET 的两条路线
Halo插件:支持GitHub的图床附件策略
电视投屏界的“一股清流”!SimpleTVCast 6.0.0-beta 抢先体验:无需TV端App,界面大换血!✨
华三VXLAN集中式网关实战指南:Spine多活网关 + 双活接入(M-LAG)
软件更好写之后口碑会更重要
大 O、大 Omega、大 Theta 的区别,O(n) 复杂度是什么意思
Java标签跳转:一个鲜为人知但却很实用的小技巧
多智能体系统论文速读