-
[云原生] Prometheus自动服务发现部署
一、部署服务发现
1.1 基于文件的服务发现
基于文件的服务发现是仅仅略优于静态配置的服务发现方式,它不依赖于任何平台或第三方服务,因而也是最为简单和通用的实现方式。
Prometheus Server 会定期从文件中加载 Target 信息,文件可使用 YAML 和 JSON 格式,它含有定义的 Target 列表,以及可选的标签信息。(1)创建用于服务发现的文件,在文件中配置所需的 target
- cd /usr/local/prometheus
- mkdir targets
- vim targets/node-exporter.yaml
- - targets:
- - 192.168.80.130:9100
- labels:
- from: node-exporter
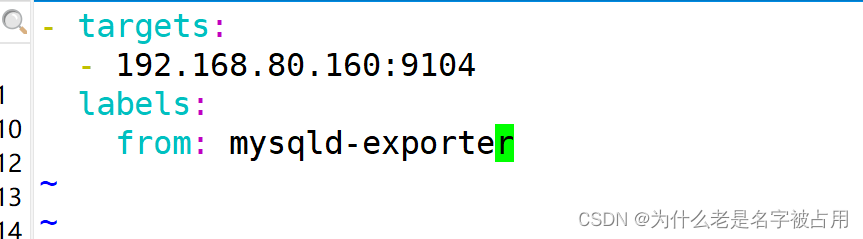
- vim targets/mysqld-exporter.yaml
- - targets:
- - 192.168.80.160:9104
- labels:
- from: mysqld-exporter


(2)修改 prometheus 配置文件,发现 target 的配置,定义在配置文件的 job 之中
- vim /usr/local/prometheus/prometheus.yml
- ......
- scrape_configs:
- - job_name: nodes
- file_sd_configs: #指定使用文件服务发现
- - files: #指定要加载的文件列表
- - targets/node*.yaml #文件加载支持通配符
- refresh_interval: 2m #每隔 2 分钟重新加载一次文件中定义的 Targets,默认为 5m
- - job_name: mysqld
- file_sd_configs:
- - files:
- - targets/mysqld*.yaml
- refresh_interval: 2m
- systemctl reload prometheus
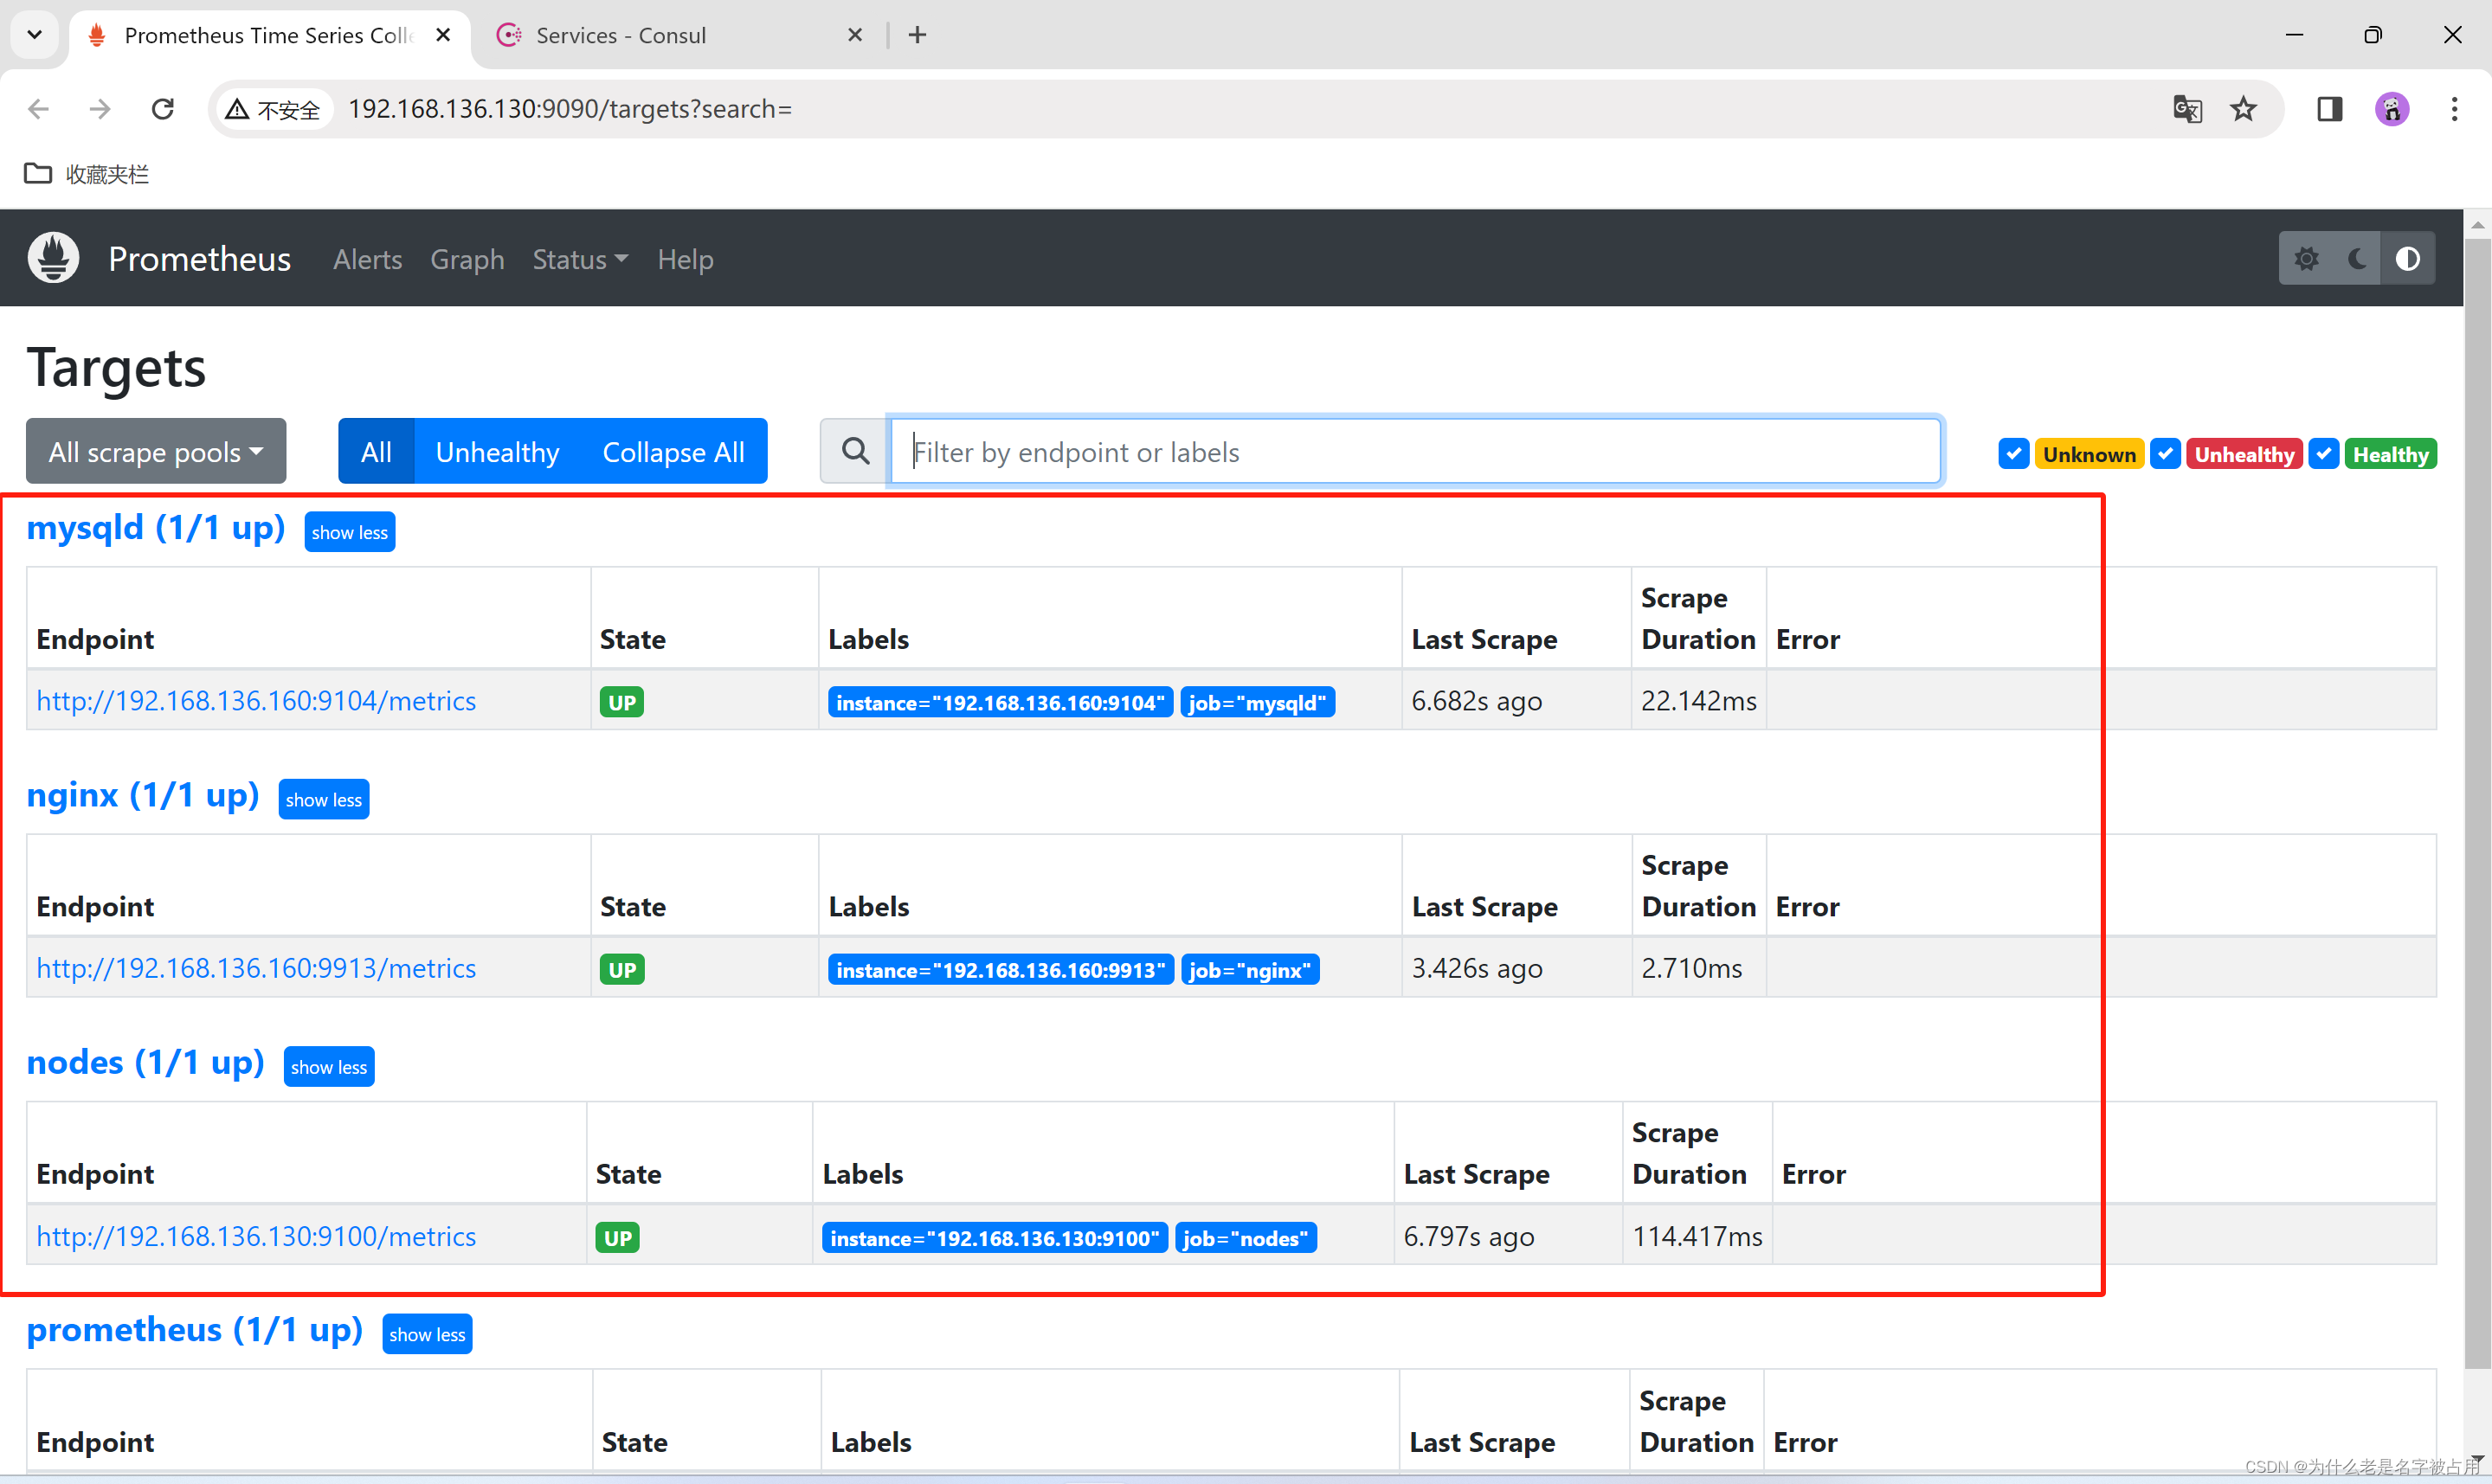
- 浏览器查看 Prometheus 页面的 Status -> Targets


1.2 基于 Consul 的服务发现
Consul 是一款基于 golang 开发的开源工具,主要面向分布式,服务化的系统提供服务注册、服务发现和配置管理的功能。
提供服务注册/发现、健康检查、Key/Value存储、多数据中心和分布式一致性保证等功能。下载地址:https://www.consul.io/downloads/
(1)部署 Consul 服务
- cd /opt/
- mkdir cnsul
- unzip consul_1.9.2_linux_amd64.zip
- mv consul /usr/local/bin/
- #创建 Consul 服务的数据目录和配置目录
- mkdir data logs conf
- #使用 server 模式启动 Consul 服务
- consul agent -server -bootstrap -ui -data-dir=./data -config-dir=./conf -bind=192.168.136.160 -client=0.0.0.0 -node=consul-server01 &> ./logs/consul.log &
- #查看 consul 集群成员
- consul members


(2)在 Consul 上注册 Services
- #在配置目录中添加文件
- cd conf/
- vim nodes.json
- {
- "services": [
- {
- "id": "node_exporter-node01",
- "name": "node01",
- "address": "192.168.136.130",
- "port": 9100,
- "tags": ["nodes"],
- "checks": [{
- "http": "http://192.168.136.130:9100/metrics",
- "interval": "5s"
- }]
- }
- ]
- }
- vim mysqld.json
- {
- "services": [
- {
- "id": "mysqld_exporter-node01",
- "name": "node02",
- "address": "192.168.136.160",
- "port": 9104,
- "tags": ["mysqld"],
- "checks": [{
- "http": "http://192.168.136.160:9104/metrics",
- "interval": "5s"
- }]
- }
- ]
- }
- vim nginx.json
- {
- "services": [
- {
- "id": "nginx_exporter-node01",
- "name": "node03",
- "address": "192.168.136.160",
- "port": 9913,
- "tags": ["nginx"],
- "checks": [{
- "http": "http://192.168.136.160:9913/metrics",
- "interval": "5s"
- }]
- }
- ]
- }


 (3)修改 prometheus 配置文件
 - vim /usr/local/prometheus/prometheus.yml
- ......
- - job_name: nodes
- consul_sd_configs: #指定使用 consul 服务发现
- - server: 192.168.136.160:8500 #指定 consul 服务的端点列表
- tags: #指定 consul 服务发现的 services 中哪些 service 能够加入到 prometheus 监控的标签
- - nodes
- refresh_interval: 1m
- ........
- systemctl reload prometheus
- 浏览器查看 Prometheus 页面的 Status -> Targets
- #让 consul 注销 Service
- consul services deregister -id="node_exporter-node02"
- #重新注册
- consul services register /etc/consul/nodes.json


1.3 基于 Kubernetes API 的服务发现
基于 Kubernetes API 的服务发现机制,支持将API Server 中 Node、Service、Endpoint、Pod 和 Ingress 等资源类型下相应的各资源对象视作 target, 并持续监视相关资源的变动
●Node、Service、Endpoint、Pod 和 Ingress 资源分别由各自的发现机制进行定义
●负责发现每种类型资源对象的组件,在 Prometheus 中称为一个 role
●支持在集群上基于 DaemonSet 控制器部署 node-exporter 后发现各 Node 节点,也可以通过 kubelet 来作为 Prometheus 发现各 Node 节点的入口
- #基于 Kubernetes 发现机制的部分配置参数
- # The API server addresses. If left empty, Prometheus is assumed to run inside of the cluster and will discover API servers automatically
- and use the pod's
- # CA certificate and bearer token file at /var/run/secrets/kubernetes.io/serviceaccount/.
- [ api_server:
] - # The Kubernetes role of entities that should be discovered. One of endpoints, service, pod, node, or ingress.
- role: <string>
- # Optional authentication information used to authenticate to the API server.
- # Note that 'basic_auth', 'bearer_token'和'bearer_token_file' 等认证方式互斥;
- [ bearer_token:
] - [ bearer_token_file:
] - # TLS configuration.
- tls_config:
- # CA certificate to validate API server certificate with.
- [ ca_file:
] - # Certificate and key files for client cert authentication to the server.
- [ cert_file:
] - [ key_file:
] - # ServerName extension to indicate the name of the server.
- [ server_name: <string> ]
- # Optional namespace discovery. If omitted, all namespaces are used.
- namespaces:
- names:
- [ - <string> ]
在K8S节点上
如果Prometheus是部署在k8s集群内部的,可以直接和apiserver通信。如果是集群外部的Prometheus可以通过以下步骤配置通过API Server实现服务发现。
RBAC授权
集群外部的Prometheus访问apiserver需要认证,还需要一定权限查询对应的资源对象。所以,这里先创建一个ServiceAccount和一个ClusterRole,并将它们绑定,之后集群外的Prometheus会以此ServiceAccount的身份访问apiserver。yaml文件内容如下:- apiVersion: v1
- kind: Namespace
- metadata:
- name: monitoring
- ---
- apiVersion: v1
- kind: ServiceAccount
- metadata:
- name: outside-prometheus
- namespace: monitoring
- ---
- apiVersion: rbac.authorization.k8s.io/v1
- kind: ClusterRole
- metadata:
- name: outside-prometheus
- rules:
- - apiGroups:
- - ""
- resources:
- - nodes
- - services
- - endpoints
- - pods
- - nodes/proxy
- verbs:
- - get
- - list
- - watch
- - apiGroups:
- - "networking.k8s.io"
- resources:
- - ingresses
- verbs:
- - get
- - list
- - watch
- - apiGroups:
- - ""
- resources:
- - configmaps
- - nodes/metrics
- verbs:
- - get
- - nonResourceURLs:
- - /metrics
- verbs:
- - get
- ---
- apiVersion: rbac.authorization.k8s.io/v1
- kind: ClusterRoleBinding
- metadata:
- name: outside-prometheus
- roleRef:
- apiGroup: rbac.authorization.k8s.io
- kind: ClusterRole
- name: outside-prometheus
- subjects:
- - kind: ServiceAccount
- name: outside-prometheus
- namespace: monitoring

- 获取ServiceAccount对应Secret资源对象中保存的token,然后将token保存到Prometheus节点上的文件里。
- TOKEN=`kubectl get secret/$(kubectl -n monitoring get secret | awk '/outside-prometheus/{print $1}') -n monitoring -o jsonpath={.data.token} | base64 -d`

scp /etc/kubernetes/pki/ca.crt <prometheus_node>:/usr/local/prometheus/在Prometheus 节点上
- echo <token-value> > /usr/local/prometheus/kubernetes-api-token
- cat /usr/local/prometheus/kubernetes-api-token #和上面获取的对比是否一致
- 修改Prometheus配置,添加job
- #集群api-server自动发现job
- - job_name: kubenetes-apiserver
- kubernetes_sd_configs:
- - role: endpoints
- api_server: https://192.168.80.10:6443 #指定API Server地址
- #这里的配置证书和token是连接API Server做服务发现时使用
- tls_config:
- ca_file: /usr/local/prometheus/pki/ca.crt #指定kubernetes ca根证书,用于验证api-server证书
- # insecure_skip_verify: true #也可以使用此选项跳过证书验证
- authorization:
- credentials_file: /usr/local/prometheus/kubernetes-api-token #指定访问api-server时使用的token文件
- scheme: https
- #这里的配置证书和token是连接从api-server抓取数据时使用
- tls_config:
- ca_file: /usr/local/prometheus/pki/ca.crt
- authorization:
- credentials_file: /usr/local/prometheus/kubernetes-api-token
- relabel_configs:
- - source_labels: ["__meta_kubernetes_namespace", "__meta_kubernetes_endpoints_name", "__meta_kubernetes_endpoint_port_name"]
- regex: default;kubernetes;https
- action: keep
- #集群节点自动发现job
- - job_name: "kubernetes-nodes"
- kubernetes_sd_configs:
- - role: node #指定发现类型为node
- api_server: https://192.168.80.10:6443
- tls_config:
- ca_file: /usr/local/prometheus/pki/ca.crt
- authorization:
- credentials_file: /usr/local/prometheus/kubernetes-api-token
- relabel_configs:
- - source_labels: ["__address__"] #重写target地址,默认端口是kubelet端口10250,修改为node-exporter端口9100
- regex: (.*):10250
- action: replace
- target_label: __address__
- replacement: $1:9100
- - action: labelmap #保留之前存在的__meta_kubernetes_node_label开头的标签
- regex: __meta_kubernetes_node_label_(.+)
- 验证
- 配置修改完成后,重载Prometheus,然后在界面查看target状态。
- 其实除了需要额外配置访问 API Server的证书外,其余配置和集群内的Prometheus服务发现配置基本一致。
- 另外,没有配置关于Pod的服务发现job,因为集群外的Prometheus无法访问集群内的Pod,需要添加路由规则才能实现互通。
-
相关阅读:
VMWare Ubuntu压缩虚拟磁盘
ABAP 调用HTTP上传附件(二)之中文乱码
学完就干的Linux常用命令
linux7上powerpath卸载
快乐数(C++解法)
Spring
nginx反向代理实例
期中考Web复现
Pycharm中使用远程JupyterLab以及JupyterHub登录问题
一些流程图(自用)
- 原文地址:https://blog.csdn.net/Cnm_147258/article/details/136702934
