-
【动手学深度学习-Pytorch版】注意力汇聚:Nadaraya-Watson 核回归
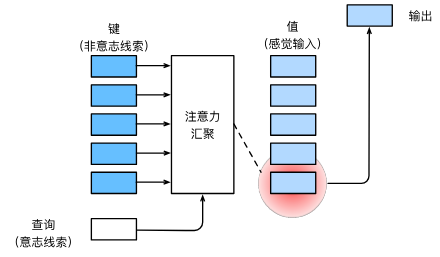
注意力机制中的查询、键、值
在注意力机制的框架中包含了键、值与查询三个主要的部分,其中键与查询构成了注意力汇聚(有的也叫作注意力池化)。
键是指一些非意识的线索,例如在序列到序列的学习中,特别是机器翻译,键是指除了文本序列自身信息外的其他信息,例如人工翻译或者语言学习情况。
查询则是与键(非意识提示)相反的,它常被称为意识提示或者自主提示。这体现在文本序列翻译中,则是文本序列的context上下文信息,该上下文信息包含了词元与词元之间的自主线索。
值是通过设计注意力的汇聚方式,将给定的查询与键进行匹配,得出的最匹配的值的信息。平均汇聚
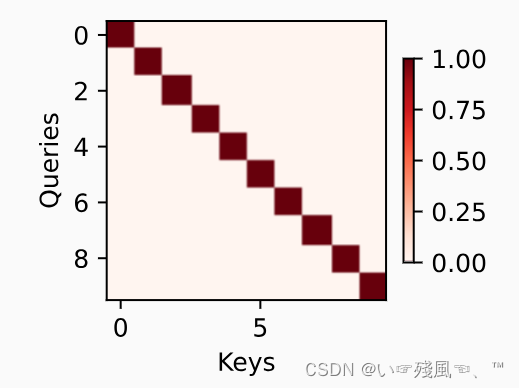
平均汇聚是对输入进行加权取平均值,其中各输入的权重保持平衡。下面是d2l给出的一个实例:
导包
import torch from d2l import torch as d2l- 1
- 2
可视化注意力权重
#@save def show_heatmaps(matrices, xlabel, ylabel, titles=None, figsize=(2.5, 2.5), cmap='Reds'): """显示矩阵热图""" d2l.use_svg_display() num_rows, num_cols = matrices.shape[0], matrices.shape[1] fig, axes = d2l.plt.subplots(num_rows, num_cols, figsize=figsize, sharex=True, sharey=True, squeeze=False) for i, (row_axes, row_matrices) in enumerate(zip(axes, matrices)): for j, (ax, matrix) in enumerate(zip(row_axes, row_matrices)): pcm = ax.imshow(matrix.detach().numpy(), cmap=cmap) if i == num_rows - 1: ax.set_xlabel(xlabel) if j == 0: ax.set_ylabel(ylabel) if titles: ax.set_title(titles[j]) fig.colorbar(pcm, ax=axes, shrink=0.6);- 1
- 2
- 3
- 4
- 5
- 6
- 7
- 8
- 9
- 10
- 11
- 12
- 13
- 14
- 15
- 16
- 17
- 18
示例
attention_weights = torch.eye(10).reshape((1, 1, 10, 10)) show_heatmaps(attention_weights, xlabel='Keys', ylabel='Queries')- 1
- 2
结果
Nadaraya-Watson 核回归
具体来说,1964年提出的Nadaraya-Watson核回归模型 是一个简单但完整的例子,可以用于演示具有注意力机制的机器学习。
导包
import matplotlib.pyplot as plt import torch from torch import nn from d2l import torch as d2l- 1
- 2
- 3
- 4
生成数据集
给定“输入-输出”数据集 ( x 1 , y 1 ) , . . . ( x n , y n ) {(x_1,y1),...(x_n,y_n)} (x1,y1),...(xn,yn),其Y通过以下函数生成,其中包含了噪声ε(服从均值为0和标准差为0.5的正态分布):

训练样本数 = 测试样本数 = 50;训练样本通过torch.sort()排序后输出,结果含有噪声;而测试样本采用的是不含噪声点。# 生成数据集 n_train = 50 # 训练样本数 x_train, _ = torch.sort(torch.rand(n_train) * 5) # 排序后的训练样本 with open('D://pythonProject//f-write//Nadaraya-forward-x_train_sort.txt', 'w') as f: f.write(str(x_train)) def f(x): return 2 * torch.sin(x) + x**0.8 y_train = f(x_train) + torch.normal(0.0, 0.5, (n_train,)) # 训练样本的输出 x_test = torch.arange(0, 5, 0.1) # 测试样本 y_truth = f(x_test) # 测试样本的真实输出 n_test = len(x_test) # 测试样本数 print('y_train_shape: ',y_train.size()) # y_train_shape: torch.Size([50])- 1
- 2
- 3
- 4
- 5
- 6
- 7
- 8
- 9
- 10
- 11
- 12
- 13
- 14
- 15
- 16
- 17
- 18
可视化注意力权重函数
#@save def show_heatmaps(matrices, xlabel, ylabel, titles=None, figsize=(2.5, 2.5), cmap='Reds'): print('Shape of matrices is',matrices.shape) # Shape of matrices is torch.Size([1, 1, 50, 50]) """其输入matrices的形状是(要显示的行数,要显示的列数,查询的数目,键的数目)""" """显示矩阵热图""" d2l.use_svg_display() num_rows, num_cols = matrices.shape[0], matrices.shape[1] fig, axes = d2l.plt.subplots(num_rows, num_cols, figsize=figsize, sharex=True, sharey=True, squeeze=False) for i, (row_axes, row_matrices) in enumerate(zip(axes, matrices)): for j, (ax, matrix) in enumerate(zip(row_axes, row_matrices)): pcm = ax.imshow(matrix.detach().numpy(), cmap=cmap) if i == num_rows - 1: ax.set_xlabel(xlabel) if j == 0: ax.set_ylabel(ylabel) if titles: ax.set_title(titles[j]) fig.colorbar(pcm, ax=axes, shrink=0.5) plt.show()- 1
- 2
- 3
- 4
- 5
- 6
- 7
- 8
- 9
- 10
- 11
- 12
- 13
- 14
- 15
- 16
- 17
- 18
- 19
- 20
- 21
- 22
绘制训练样本、真实数据生成函数以及预测函数
def plot_kernel_reg(y_hat): d2l.plot(x_test, [y_truth, y_hat], 'x', 'y', legend=['Truth', 'Pred'], xlim=[0, 5], ylim=[-1, 5]) d2l.plt.plot(x_train, y_train, 'o', alpha=0.5);- 1
- 2
- 3
- 4
实现平均汇聚
平均汇聚是一种最简单的估计器,它是直接计算所有训练样本输出值的平均值:
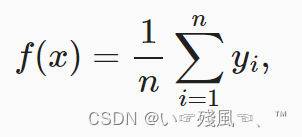
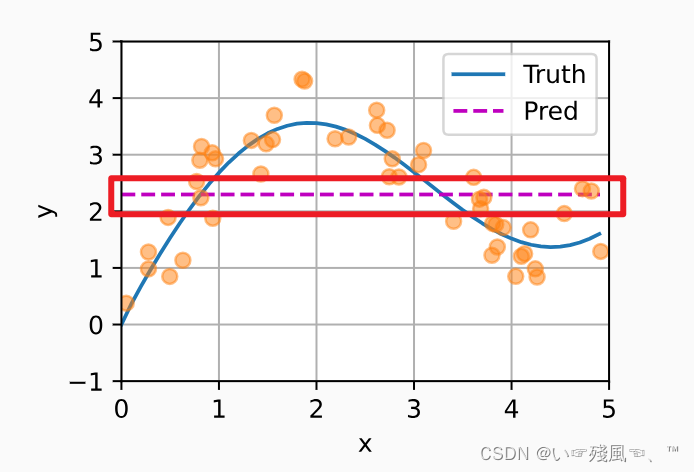
但是通过绘制图像上的对比发现:平均汇聚的图像与真实值之间存在极大的偏差:y_hat = torch.repeat_interleave(y_train.mean(), n_test) plot_kernel_reg(y_hat)- 1
- 2
使用非参数注意力汇聚
这里采用的注意力函数为核函数,具体表达式为:

这里的K即为核函数,基于上述的核函数的启发,可以根据下图注意力机制框架的角度重写,成为一个更加通用的注意力汇聚公式。
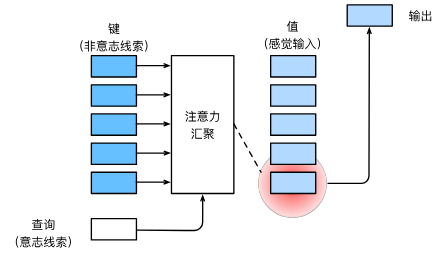
通用的注意力公式:

其中 X X X代表查询, ( x i , y i ) (x_i,y_i) (xi,yi)是键值对。注意力汇聚是对值的加权平均。α是根据查询与键形成的注意力权重,下面将会利用高斯核作为注意力权重。
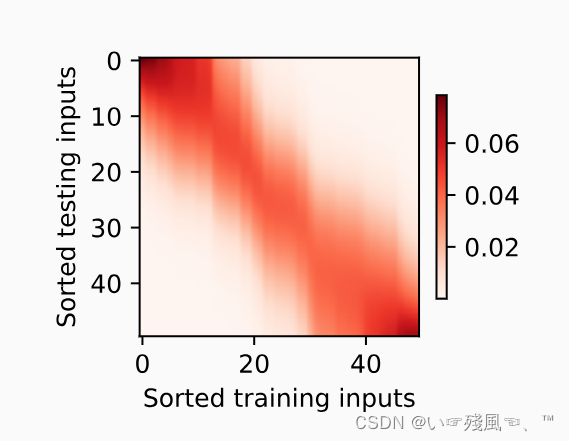
给定一个键 x i x_i xi,如果它接近于给定的查询 X X X,则分配给 Y i Y_i Yi的权重越大。下面是根据此非参数的注意力汇聚形成的预测结果:
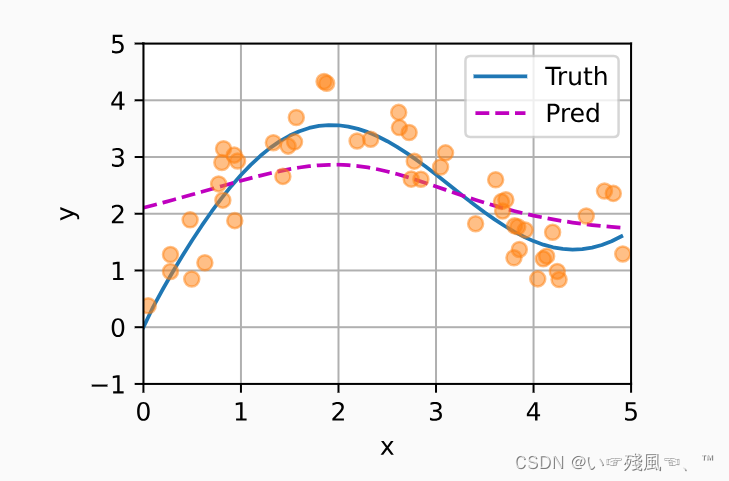
绘制代码:# X_repeat的形状:(n_test,n_train), # 每一行都包含着相同的测试输入(例如:同样的查询) X_repeat = x_test.repeat_interleave(n_train).reshape((-1, n_train)) print('Size of X_repeat is:',X_repeat.shape) # Size of X_repeat is: torch.Size([50, 50]) # x_train包含着键。attention_weights的形状:(n_test,n_train), # 每一行都包含着要在给定的每个查询的值(y_train)之间分配的注意力权重 attention_weights = nn.functional.softmax(-(X_repeat - x_train)**2 / 2, dim=1) print('Size of attention_weights is:',attention_weights.shape) # Size of attention_weights is: torch.Size([50, 50]) # y_hat的每个元素都是值的加权平均值,其中的权重是注意力权重 y_hat = torch.matmul(attention_weights, y_train) plot_kernel_reg(y_hat)- 1
- 2
- 3
- 4
- 5
- 6
- 7
- 8
- 9
- 10
- 11
- 12
- 13
- 14
- 15
- 16
- 17
测试数据的输入相当于查询,而训练数据的输入相当于键,下面可以使用热力图发现“查询-键”对越接近,注意力汇聚的注意力权重α越高。
print('attention_weights.unsqueeze(0).unsqueeze(0)',attention_weights.unsqueeze(0).unsqueeze(0).shape) # attention_weights.unsqueeze(0).unsqueeze(0) torch.Size([1, 1, 50, 50]) # unsqueeze(0)两次相当于增加两次第一个维度 show_heatmaps(attention_weights.unsqueeze(0).unsqueeze(0), xlabel='Sorted training inputs', ylabel='Sorted testing inputs')- 1
- 2
- 3
- 4
- 5
- 6
- 7
- 8

带参数的注意力汇聚
与非参数的注意力汇聚不同,带参数的注意力汇聚在查询和键 x i x_i xi之间加入了可学习参数w:w控制的是高斯核的窗口大小,可以通过W控制曲线平滑一点或者不平滑。
小批量矩阵的乘法
# 实现小批量矩阵的乘法 X = torch.ones((2,1,4)) Y = torch.ones((2,4,6)) print('小批量矩阵乘法测试:',torch.bmm(X,Y).shape) # 小批量矩阵乘法测试: torch.Size([2, 1, 6])- 1
- 2
- 3
- 4
- 5
在注意力机制的背景中,我们可以使用小批量矩阵乘法来计算小批量数据中的加权平均值。
"""利用小批量矩阵乘法计算小批量数据中的加权平均值""" weights = torch.ones((2,10)) * 0.1 values = torch.arange(20.0).reshape((2,10)) print('Init shape of weights: ',weights.shape,'Init shape of values: ',values.shape) # Init shape of weights: torch.Size([2, 10]) Init shape of values: torch.Size([2, 10]) weights = weights.unsqueeze(1) values = values.unsqueeze(-1) print('New shape of weights: ',weights.shape,'New shape of values: ',values.shape) # New shape of weights: torch.Size([2, 1, 10]) New shape of values: torch.Size([2, 10, 1]) res = torch.bmm(weights,values) print('加权平均值示例:',res) # 加权平均值示例: tensor([[[ 4.5000]], # # [[14.5000]]])- 1
- 2
- 3
- 4
- 5
- 6
- 7
- 8
- 9
- 10
- 11
- 12
- 13
- 14
- 15
- 16
定义模型
该模型中直接使用的是上述提到的核,同时在进入模型初始化函数中,查询的初始化大小为测试数据输入大小,而键与值是成对出现的,所以两者大小是相同的。后面将查询的大小更改成(查询个数,“键-值”对数),注意力权重也是该形状。
"""定义模型""" # w控制的是高斯核的窗口大小,可以通过W控制曲线平滑一点或者不平滑 class NWKernelRegression(nn.Module): def __init__(self,**kwargs): super().__init__(**kwargs) self.w = nn.Parameter(torch.rand((1,),requires_grad=True)) def forward(self,queries,keys,values): with open('D://pythonProject//f-write//Nadaraya-forward-init-queries.txt', 'w') as f: f.write(str(queries.shape)) with open('D://pythonProject//f-write//Nadaraya-forward-init-keys.txt', 'w') as f: f.write(str(keys.shape)) with open('D://pythonProject//f-write//Nadaraya-forward-init-values.txt', 'w') as f: f.write(str(values.shape)) # init-queries ---> torch.Size([50]) # init-keys ---> torch.Size([50, 49]) # init-values ---> torch.Size([50, 49]) # queries和attention_weights的形状为(查询个数,“键-值”对数) queries = queries.repeat_interleave(keys.shape[1]).reshape((-1,keys.shape[1])) with open('D://pythonProject//f-write//Nadaraya-forward-changed-queries.txt', 'w') as f: f.write(str(queries.shape)) # changed-queries ---> torch.Size([50, 49]) self.attention_weights = nn.functional.softmax( -((queries - keys) * self.w)**2/2,dim=1) # attention的形状也是(查询个数,“键-值”对个数) with open('D://pythonProject//f-write//Nadaraya-forward--attention.txt', 'w') as f: f.write(str(self.attention_weights.shape)) # forward-attention ---> torch.Size([50, 49]) # values的形状为(查询个数,“键-值”对个数) with open('D://pythonProject//f-write//Nadaraya-changed--values.txt', 'w') as f: f.write(str(values.unsqueeze(-1).shape)) # torch.Size([50, 49, 1]) return torch.bmm(self.attention_weights.unsqueeze(1),values.unsqueeze(-1)).reshape(-1)- 1
- 2
- 3
- 4
- 5
- 6
- 7
- 8
- 9
- 10
- 11
- 12
- 13
- 14
- 15
- 16
- 17
- 18
- 19
- 20
- 21
- 22
- 23
- 24
- 25
- 26
- 27
- 28
- 29
- 30
- 31
- 32
- 33
- 34
- 35
- 36
训练
重点:keys的形状:(‘n-train’ , ‘n-train’ -1)与values的形状:(‘n-train’ , ‘n-train’ -1)如何理解?
为了说明该问题,下面代码将生成key与value的关键代码拿出,并根据其矩阵相乘的思路降维形成另外一个示例代码:import numpy as np import torch x_train,_ = torch.sort(torch.rand(3) * 5) X_title = x_train.repeat((3,1)) print('X_title',X_title) print(X_title.shape) print(type(X_title)) print(1-torch.eye(3)) keys = X_title[(1-torch.eye(3)).type(torch.bool)].reshape((3,-1)) print('keys:',keys) print(keys.shape) arr1 = np.array([[1, 2, 3], [4, 5, 6],[7,8,9]]) x = torch.from_numpy(arr1) print('x.size',x.size()) arr2 = np.array([[0, 1, 1], [1, 0, 1],[1,1,0]]) y = torch.from_numpy(arr2) print('y.size',y.size()) print(x[y.type(torch.bool)].reshape((3,-1)) )- 1
- 2
- 3
- 4
- 5
- 6
- 7
- 8
- 9
- 10
- 11
- 12
- 13
- 14
- 15
- 16
- 17
- 18
- 19
- 20
- 21
- 22
- 23
在原来代码里面
key是通过
X_title[(1-torch.eye(3)).type(torch.bool)].reshape((3,-1))形成的,但是高维度的数据分析起来有点繁杂,这里进行了降维,其中x代表的是原来的X_tile,y代表的是原有的1-torch.eye(3)——这里通过打印后可以发现y与1-torch.eye(3)只是维度上的区别,元素规律保持不变,即都是一个对角矩阵。通过打印可知:
X_title[(1-torch.eye(3)).type(torch.bool)].reshape((3,-1))的操作是将两个矩阵进行点乘,并且最后reshape点乘后的矩阵,因为
1-torch.eye(3)中恰含有一列的零元素,所以点乘后二维元素少了一列,这就是[50,49]的来源。"""训练""" # 将训练数据集变换为键和值用于训练注意力模型 # 任何一个训练样本的输入都会和除了自身以外的其他训练样本的键值对进行计算 从而得到其对应的预测输出 # X_tile的形状: (n_train,n_train) 每一个行都包含着相同的训练输入 X_title = x_train.repeat((n_train,1)) with open('D://pythonProject//f-write//Nadaraya-X_title.txt', 'w') as f: f.write(str(X_title.shape)) # X_title ---> torch.Size([50,50] # Y_tile的形状: (n_train,n_train) 每一个行都包含着相同的训练输出 Y_title = y_train.repeat((n_train,1)) with open('D://pythonProject//f-write//Nadaraya-Y_title.txt', 'w') as f: f.write(str(Y_title.shape)) # Y_title ---> torch.Size([50, 50]) # keys的形状:('n-train' , 'n-train' -1) # keys ---> torch.Size([50, 49]) with open('D://pythonProject//f-write//Nadaraya-torch.eye(n_train).txt', 'w') as f: f.write(str(torch.eye(n_train).size())) res_eye = (1-torch.eye(n_train)).type(torch.bool) print(res_eye.size()) test_res = X_title[(1-torch.eye(n_train)).type(torch.bool)] with open('D://pythonProject//f-write//Nadaraya-1-torch.eye(n_train).txt', 'w') as f: f.write(str(test_res)) """---将X_title与1-torch.eye(n_train)哈达玛积后元素个数少了一列""" keys = X_title[(1-torch.eye(n_train)).type(torch.bool)].reshape((n_train,-1)) with open('D://pythonProject//f-write//Nadaraya-keys.txt', 'w') as f: f.write(str(keys.shape)) # values ---> torch.Size([50, 49]) # values的形状:('n-train' , 'n-train' -1) values = Y_title[(1-torch.eye(n_train)).type(torch.bool)].reshape((n_train,-1)) with open('D://pythonProject//f-write//Nadaraya-values.txt', 'w') as f: f.write(str(values.shape)) """训练带参数的注意力汇聚模型时,使用平方损失函数和随机梯度下降""" net = NWKernelRegression() loss = nn.MSELoss(reduction='none') trainer = torch.optim.SGD(net.parameters(), lr=0.5) animator = d2l.Animator(xlabel='epoch', ylabel='loss', xlim=[1, 5]) for epoch in range(5): trainer.zero_grad() l = loss(net(x_train, keys, values), y_train) l.sum().backward() trainer.step() print(f'epoch {epoch + 1}, loss {float(l.sum()):.6f}') animator.add(epoch + 1, float(l.sum()))- 1
- 2
- 3
- 4
- 5
- 6
- 7
- 8
- 9
- 10
- 11
- 12
- 13
- 14
- 15
- 16
- 17
- 18
- 19
- 20
- 21
- 22
- 23
- 24
- 25
- 26
- 27
- 28
- 29
- 30
- 31
- 32
- 33
- 34
- 35
- 36
- 37
- 38
- 39
- 40
- 41
- 42
- 43
- 44
- 45
- 46
- 47
- 48
- 49
- 50
绘制散点图与热力图
# keys的形状:(n_test,n_train),每一行包含着相同的训练输入(例如,相同的键) keys = x_train.repeat((n_test, 1)) # value的形状:(n_test,n_train) values = y_train.repeat((n_test, 1)) y_hat = net(x_test, keys, values).unsqueeze(1).detach() plot_kernel_reg(y_hat)- 1
- 2
- 3
- 4
- 5
- 6
# keys的形状:(n_test,n_train),每一行包含着相同的训练输入(例如,相同的键) keys = x_train.repeat((n_test, 1)) # value的形状:(n_test,n_train) values = y_train.repeat((n_test, 1)) y_hat = net(x_test, keys, values).unsqueeze(1).detach() plot_kernel_reg(y_hat) show_heatmaps(net.attention_weights.unsqueeze(0).unsqueeze(0), xlabel='Sorted training inputs', ylabel='Sorted testing inputs')- 1
- 2
- 3
- 4
- 5
- 6
- 7
- 8
- 9
- 10
-
相关阅读:
数据结构(郝斌)】03线性结构-数组[连续存储数组的算法演示]
Linux命令-which whereis find的区别
51单片机的智能浇花系统【含proteus仿真+程序+报告+原理图】
平均分(C++)
IP地址和MAC地址
智能合约平台开发方案:构建可靠且高效的区块链应用
洛谷 P1962 斐波那契数列(矩阵快速幂, 水题)
知识付费的时代,哪些应该付费学习?
Unity3d C#使用Screen.SetResolution设置无效的问题(问题在于Screen.width、Screen.height)
cv面试百问学习day1
- 原文地址:https://blog.csdn.net/qq_43858783/article/details/133236869
