-
Pytorch从零开始实战02
Pytorch从零开始实战——彩色图像识别
本系列来源于365天深度学习训练营
原作者K同学
环境准备
本文基于Jupyter notebook,使用Python3.8,Pytorch2.0.1+cu118,torchvision0.15.2,需读者自行配置好环境且有一些深度学习理论基础。
老规矩,还是导入常用包import torch import torch.nn as nn import matplotlib.pyplot as plt import torchvision import torch.nn.functional as F import random import time import random import numpy as np import pandas as pd import datetime import gc import os os.environ['KMP_DUPLICATE_LIB_OK']='True' # 用于避免jupyter环境突然关闭 torch.backends.cudnn.benchmark=True # 用于加速GPU运算的代码- 1
- 2
- 3
- 4
- 5
- 6
- 7
- 8
- 9
- 10
- 11
- 12
- 13
- 14
- 15
创建设备对象
device = torch.device("cuda" if torch.cuda.is_available() else "cpu") device- 1
- 2
设置随机数种子
torch.manual_seed(428) torch.cuda.manual_seed(428) torch.cuda.manual_seed_all(428) random.seed(428) np.random.seed(428)- 1
- 2
- 3
- 4
- 5
数据集
本文使用CIFAR-10数据集,CIFAR-10数据集包含60000张 32x32的彩色图片,共分为10种类别,每种类别6000张。其中训练集包含50000张图片,测试机包含10000张图片。
我们使用torchvision.datasets下载数据集。train_ds = torchvision.datasets.CIFAR10('data', train=True, transform=torchvision.transforms.ToTensor(), download=True) test_ds = torchvision.datasets.CIFAR10('data', train=True, transform=torchvision.transforms.ToTensor(), download=True)- 1
- 2
随机展示五张图片,下面这个函数是从别人那里抄的,挺好用的。
def plotsample(data): fig, axs = plt.subplots(1, 5, figsize=(10, 10)) #建立子图 for i in range(5): num = random.randint(0, len(data) - 1) #首先选取随机数,随机选取五次 #抽取数据中对应的图像对象,make_grid函数可将任意格式的图像的通道数升为3,而不改变图像原始的数据 #而展示图像用的imshow函数最常见的输入格式也是3通道 npimg = torchvision.utils.make_grid(data[num][0]).numpy() nplabel = data[num][1] #提取标签 #将图像由(3, weight, height)转化为(weight, height, 3),并放入imshow函数中读取 axs[i].imshow(np.transpose(npimg, (1, 2, 0))) axs[i].set_title(nplabel) #给每个子图加上标签 axs[i].axis("off") #消除每个子图的坐标轴 plotsample(train_ds)- 1
- 2
- 3
- 4
- 5
- 6
- 7
- 8
- 9
- 10
- 11
- 12
- 13
- 14
展示出现有点模糊

还是之前的套路,使用DataLoder将它按照batch_size批量划分,并将训练集顺序打乱。batch_size = 32 train_dl = torch.utils.data.DataLoader(train_ds, batch_size=batch_size, shuffle=True) test_dl = torch.utils.data.DataLoader(test_ds, batch_size=batch_size, shuffle=True)- 1
- 2
- 3
查看dataloader的一个批次
imgs, label = next(iter(train_dl)) imgs.shape # 3通道 32 * 32- 1
- 2
模型选择
本文还是使用自定义简单的卷积神经网络,下面是两个函数原型,卷积函数默认步幅是1,padding是0,最大池化函数默认步长跟最大池化窗口大小一致。
torch.nn.Conv2d(in_channels, out_channels, kernel_size, stride=1, padding=0, dilation=1, groups=1, bias=True, padding_mode=‘zeros’, device=None, dtype=None)
torch.nn.MaxPool2d(kernel_size, stride=None, padding=0, dilation=1, return_indices=False, ceil_mode=False)
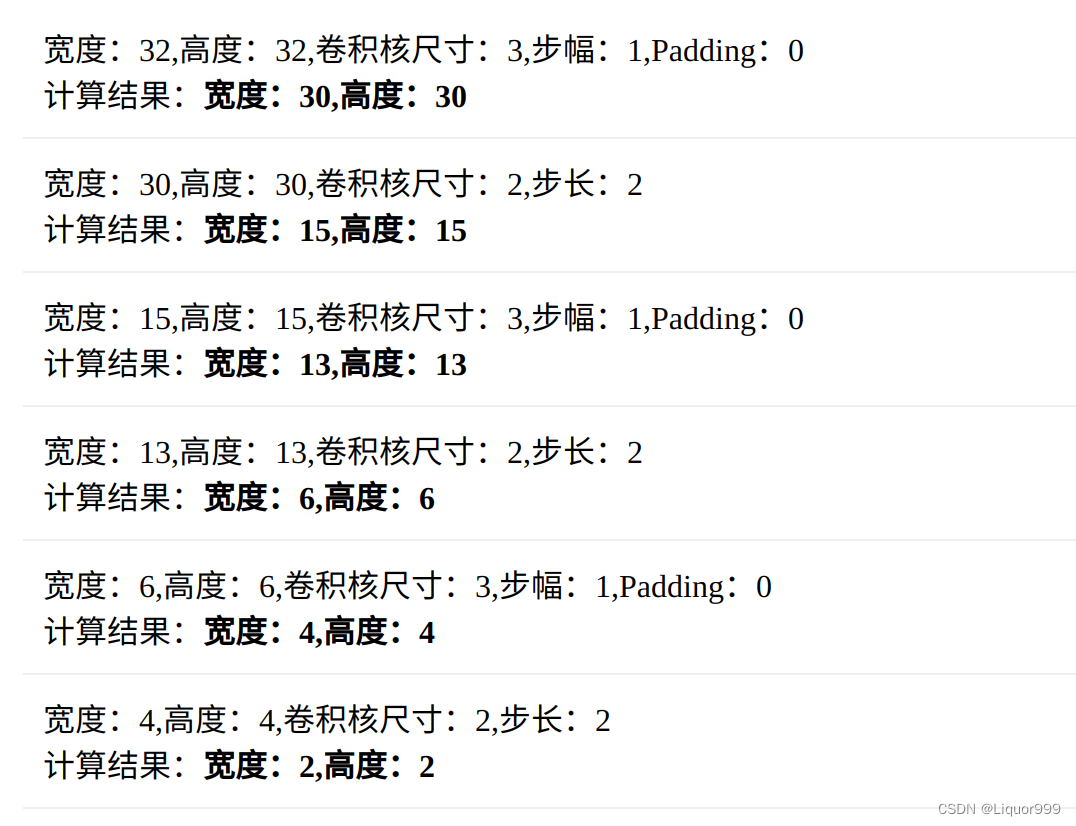
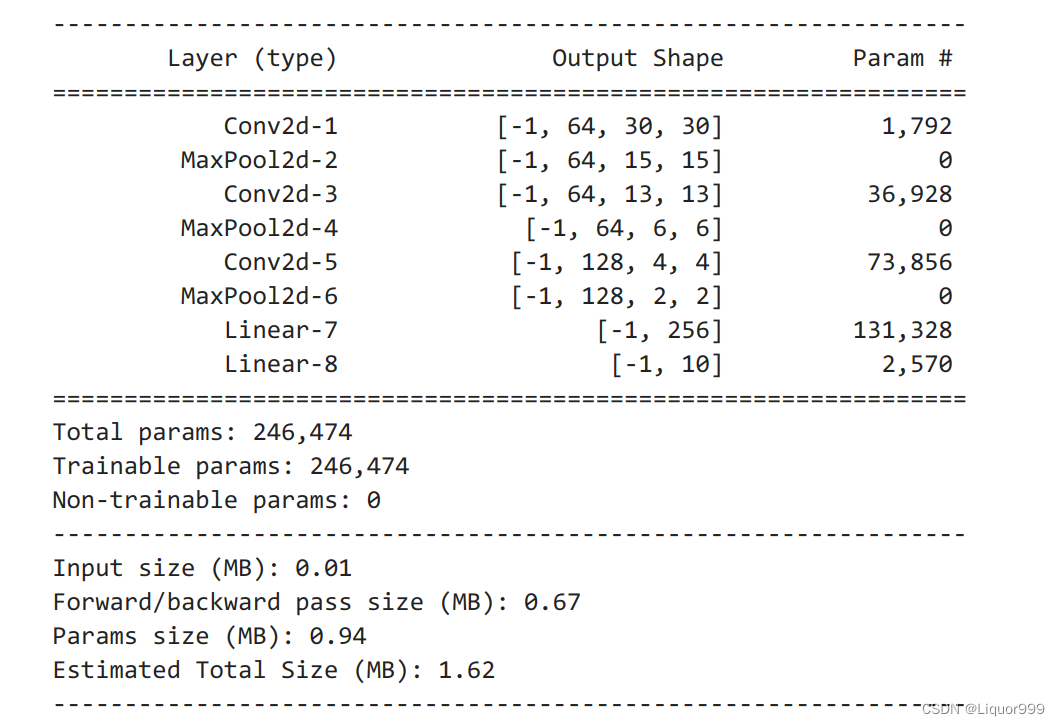
最后输出的图像尺寸是2 * 2,128通道,将它们拉平,线性层需要填入512来接收。

num_classes = 10 class Model(nn.Module): def __init__(self): super().__init__() self.conv1 = nn.Conv2d(3, 64, kernel_size=3) self.pool1 = nn.MaxPool2d(kernel_size=2) self.conv2 = nn.Conv2d(64, 64, kernel_size=3) self.pool2 = nn.MaxPool2d(kernel_size=2) self.conv3 = nn.Conv2d(64, 128, kernel_size=3) self.pool3 = nn.MaxPool2d(kernel_size=2) self.fc1 = nn.Linear(512, 256) self.fc2 = nn.Linear(256, 10) def forward(self, x): x = self.pool1(F.relu(self.conv1(x))) x = self.pool2(F.relu(self.conv2(x))) x = self.pool3(F.relu(self.conv3(x))) x = torch.flatten(x, start_dim=1) # 从第一个维度开始拉平 x = F.relu(self.fc1(x)) x = self.fc2(x) return x- 1
- 2
- 3
- 4
- 5
- 6
- 7
- 8
- 9
- 10
- 11
- 12
- 13
- 14
- 15
- 16
- 17
- 18
- 19
- 20
- 21
- 22
- 23
使用summary查看模型,这次用的是torchsummary,展示的也不错,可以看见每层结构。
from torchsummary import summary # 将模型转移到GPU中 model = Model().to(device) summary(model, input_size=(3, 32, 32))- 1
- 2
- 3
- 4

模型训练
定义损失函数、学习率、优化算法。
loss_fn = nn.CrossEntropyLoss() learn_rate = 0.01 opt = torch.optim.SGD(model.parameters(), lr=learn_rate)- 1
- 2
- 3
跟以前的文章一样,编写训练函数。
def train(dataloader, model, loss_fn, opt): size = len(dataloader.dataset) num_batches = len(dataloader) train_acc, train_loss = 0, 0 for X, y in dataloader: X, y = X.to(device), y.to(device) pred = model(X) loss = loss_fn(pred, y) opt.zero_grad() loss.backward() opt.step() train_acc += (pred.argmax(1) == y).type(torch.float).sum().item() train_loss += loss.item() train_acc /= size train_loss /= num_batches return train_acc, train_loss- 1
- 2
- 3
- 4
- 5
- 6
- 7
- 8
- 9
- 10
- 11
- 12
- 13
- 14
- 15
- 16
- 17
- 18
- 19
- 20
测试函数。
def test(dataloader, model, loss_fn): size = len(dataloader.dataset) num_batches = len(dataloader) test_acc, test_loss = 0, 0 with torch.no_grad(): for X, y in dataloader: X, y = X.to(device), y.to(device) pred = model(X) loss = loss_fn(pred, y) test_acc += (pred.argmax(1) == y).type(torch.float).sum().item() test_loss += loss.item() test_acc /= size test_loss /= num_batches return test_acc, test_loss- 1
- 2
- 3
- 4
- 5
- 6
- 7
- 8
- 9
- 10
- 11
- 12
- 13
- 14
- 15
- 16
开始训练,这次epochs设置为10轮。
import time epochs = 10 train_loss = [] train_acc = [] test_loss = [] test_acc = [] T1 = time.time() for epoch in range(epochs): model.train() epoch_train_acc, epoch_train_loss = train(train_dl, model, loss_fn, opt) model.eval() # 确保模型不会进行训练操作 epoch_test_acc, epoch_test_loss = test(test_dl, model, loss_fn) train_acc.append(epoch_train_acc) train_loss.append(epoch_train_loss) test_acc.append(epoch_test_acc) test_loss.append(epoch_test_loss) print("epoch:%d, train_acc:%.1f%%, train_loss:%.3f, test_acc:%.1f%%, test_loss:%.3f" % (epoch + 1, epoch_train_acc * 100, epoch_train_loss, epoch_test_acc * 100, epoch_test_loss)) print("Done") T2 = time.time() print('程序运行时间:%s毫秒' % ((T2 - T1)*1000))- 1
- 2
- 3
- 4
- 5
- 6
- 7
- 8
- 9
- 10
- 11
- 12
- 13
- 14
- 15
- 16
- 17
- 18
- 19
- 20
- 21
- 22
- 23
- 24
- 25
- 26
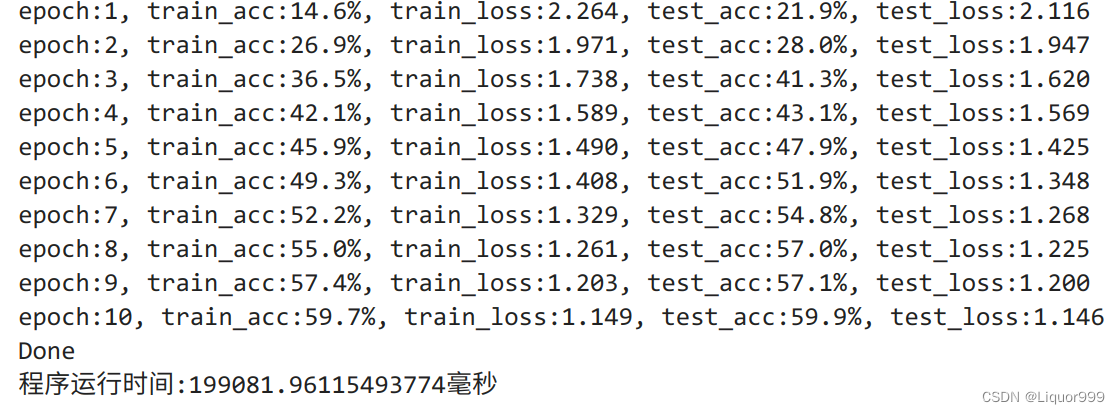
运行结果:在训练集上准确率达到59.7%,测试集达到59.9%,效果不是很好,说明还是欠拟合,需要未来改造模型或者增加训练轮数。

数据可视化
使用matplotlib进行训练数据、测试数据的可视化
import warnings warnings.filterwarnings("ignore") #忽略警告信息 plt.rcParams['font.sans-serif'] = ['SimHei'] # 用来正常显示中文标签 plt.rcParams['axes.unicode_minus'] = False # 用来正常显示负号 plt.rcParams['figure.dpi'] = 100 #分辨率 epochs_range = range(epochs) plt.figure(figsize=(12, 3)) plt.subplot(1, 2, 1) plt.plot(epochs_range, train_acc, label='Training Accuracy') plt.plot(epochs_range, test_acc, label='Test Accuracy') plt.legend(loc='lower right') plt.title('Training and Validation Accuracy') plt.subplot(1, 2, 2) plt.plot(epochs_range, train_loss, label='Training Loss') plt.plot(epochs_range, test_loss, label='Test Loss') plt.legend(loc='upper right') plt.title('Training and Validation Loss') plt.show()- 1
- 2
- 3
- 4
- 5
- 6
- 7
- 8
- 9
- 10
- 11
- 12
- 13
- 14
- 15
- 16
- 17
- 18
- 19
- 20
- 21
- 22

-
相关阅读:
今天步行数4000多
STM32F030F4驱动TIM1637数码管芯片
ACTF 2022圆满落幕,0ops战队二连冠!!
收录一些常见的算法题型
网络部分
【JAVA】编码表,字符流,对象流,其他流
EXSI 实用指南 2024 -编译环境 Mac OS 安装篇(一)
远程桌面连接接入路由器的电脑(Windows10)
Linux系统编程系列之进程间通信-信号量组
Geoserver发布shp、tiff、瓦片等格式的GIS数据
- 原文地址:https://blog.csdn.net/weixin_45959662/article/details/132842699
