-
【深度学习】 Python 和 NumPy 系列教程(廿四):Matplotlib详解:2、3d绘图类型(10)3D箱线图(3D Box Plot)
目录
6. 3D向量场图(3D Vector Field Plot)
7. 3D表面投影图(3D Surface Projection Plot)
9. 3D等高线投影图(3D Contour Projection Plot)
一、前言
Python是一种高级编程语言,由Guido van Rossum于1991年创建。它以简洁、易读的语法而闻名,并且具有强大的功能和广泛的应用领域。Python具有丰富的标准库和第三方库,可以用于开发各种类型的应用程序,包括Web开发、数据分析、人工智能、科学计算、自动化脚本等。
Python本身是一种伟大的通用编程语言,在一些流行的库(numpy,scipy,matplotlib)的帮助下,成为了科学计算的强大环境。本系列将介绍Python编程语言和使用Python进行科学计算的方法,主要包含以下内容:
- Python:基本数据类型、容器(列表、元组、集合、字典)、函数、类
- Numpy:数组创建、数组操作、数组数学、广播
- Matplotlib:2d绘图、3d绘图、图表自定义、多子图和布局、图表自定义、多子图和布局
- IPython:创建笔记本、典型工作流程
二、实验环境
matplotlib 3.5.3 numpy 1.21.6 python 3.7.16 - 运行下述命令检查Python版本
python --version- 运行下述代码检查Python、NumPy、Matplotlib版本
- import sys
- import numpy as np
- import matplotlib
- print("Python 版本:", sys.version)
- print("NumPy 版本:", np.__version__)
- print("matplotlib 版本:", matplotlib.__version__)

三、Matplotlib详解
Matplotlib是一个用于创建数据可视化的Python库。它提供了广泛的绘图选项,能够生成各种类型的图表、图形和可视化效果。下面是Matplotlib的一些主要功能:
-
绘图风格和类型:Matplotlib支持各种绘图风格和类型,包括线图、散点图、柱状图、饼图、等高线图、3D图等,可以根据需要选择适合的图表类型来展示和分析数据。
-
数据可视化:Matplotlib使得将数据转化为可视化表示变得简单,可以使用Matplotlib绘制图表来展示数据的分布、趋势、关系等,这有助于更好地理解数据和发现潜在的模式和关联。
-
图表自定义:Matplotlib提供了丰富的图表自定义选项,可以调整图表的标题、标签、坐标轴、线条样式、颜色等。这使得您能够创建符合特定需求和品味的高质量图表。
-
多子图和布局:Matplotlib允许您在单个图像中创建多个子图,以便同时展示多个相关的图表或数据视图。您可以自定义子图的布局和排列,以满足特定的展示需求。
-
导出图像:Matplotlib支持将图像导出为多种格式,包括PNG、JPEG、PDF、SVG等。这使得您可以方便地将生成的图表保存为文件,或嵌入到文档、报告和演示文稿中。
无论是进行科学研究、数据分析、报告撰写还是可视化展示,Matplotlib都是一个强大而灵活的工具。它广泛应用于各个领域,如数据科学、机器学习、金融分析、工程可视化等。
1、2d绘图类型
2、3d绘图类型
0. 设置中文字体
- import matplotlib
- matplotlib.rcParams['font.family'] = 'Microsoft YaHei' # 设置为微软雅黑字体
- matplotlib.rcParams['font.sans-serif'] = ['SimHei'] # 设置中文字体为黑体
若不进行该设置,会报错字体缺失
1. 3D线框图(3D Line Plot)
2. 3D散点图(3D Scatter Plot)
3. 3D条形图(3D Bar Plot)
4. 3D曲面图(3D Surface Plot)
5. 3D等高线图(3D Contour Plot)
6. 3D向量场图(3D Vector Field Plot)
7. 3D表面投影图(3D Surface Projection Plot)
8. 3D饼图(3D Pie Chart)
9. 3D等高线投影图(3D Contour Projection Plot)
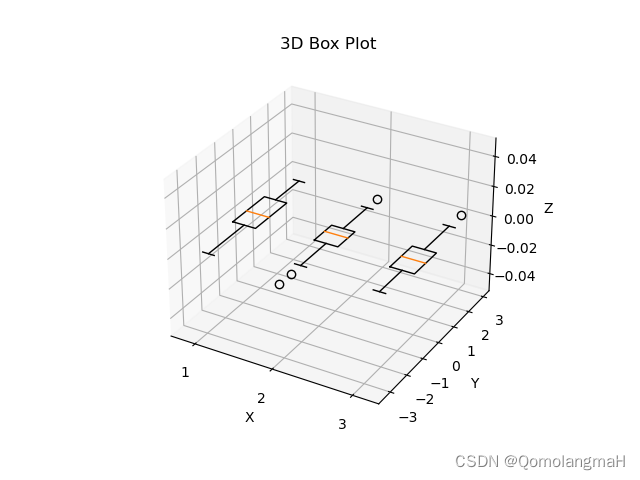
10. 3D箱线图(3D Box Plot)
- import numpy as np
- import matplotlib.pyplot as plt
- from mpl_toolkits.mplot3d import Axes3D
- # 准备数据
- np.random.seed(123)
- x = np.random.normal(0, 1, 100)
- y = np.random.normal(0, 1, 100)
- z = np.random.normal(0, 1, 100)
- # 创建3D图像对象
- fig = plt.figure()
- ax = fig.add_subplot(111, projection='3d')
- # 绘制3D Box Plot
- ax.boxplot([x, y, z])
- # 添加标签和标题
- ax.set_xlabel('X')
- ax.set_ylabel('Y')
- ax.set_zlabel('Z')
- ax.set_title('3D Box Plot')
- # 显示图像
- plt.show()

-
相关阅读:
Kubernetes 集群管理:Kurator or Kubespray
curl-带参数GET/POST请求
【服务器】服务器推荐
MySQL外键
RocketMQ自定义日志输出
【微服务】- 配置中心 - Nacos
文件中的关键字与对应的协议
[Err] 1093 - You can‘t specify target table ‘*****‘ for update in FROM clause
如何打开不同格式的图片?图片格式转换的方法又有哪些?
【Java语言】— 快速入门
- 原文地址:https://blog.csdn.net/m0_63834988/article/details/132906785
 https://blog.csdn.net/m0_63834988/article/details/132872575?spm=1001.2014.3001.5501