-
MATLAB | 绘图复刻(十二) | 桑基图+气泡图
hey 绘图复刻居然已经出到第十二期,破百指日可待hiahiahia,今天来复刻一下
- Yu, W., Wang, Z., Yu, X. et al. Kir2.1-mediated membrane potential promotes nutrient acquisition and inflammation through regulation of nutrient transporters. Nat Commun 13, 3544 (2022).
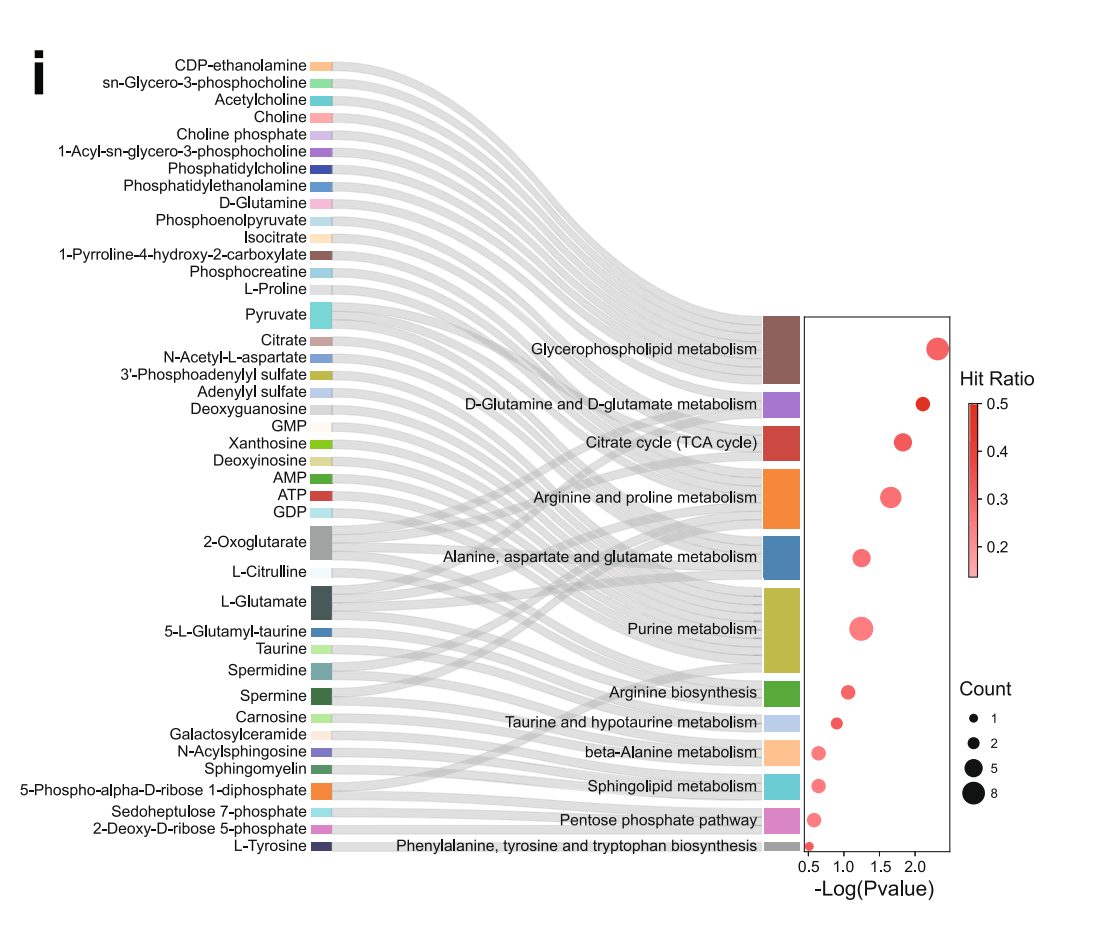
这篇论文中的Fig. 1的i图,大概长这样:
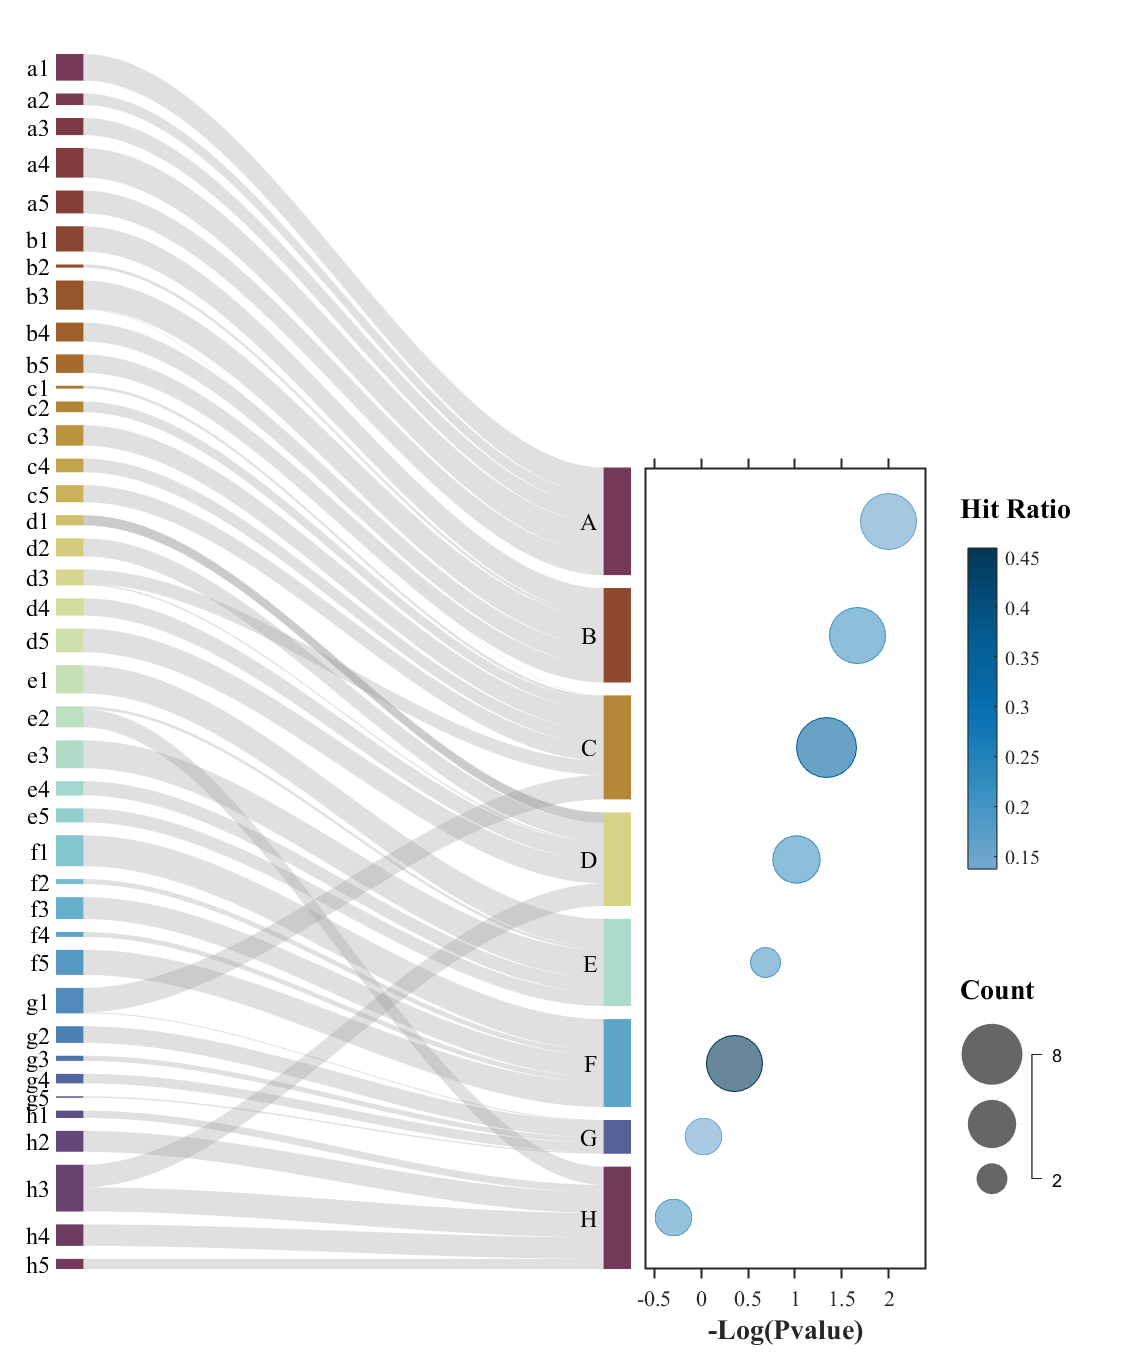
这里我们随便生成了点数据效果大概长这样:
原论文可以在以下地址下载:
- https://www.nature.com/articles/s41467-022-31149-y.pdf
本文用到了我以前写的文章中用到的工具,请将以下俩工具添加到路径或放在m文件所在文件夹内:
- https://slandarer.blog.csdn.net/article/details/130430147
- https://slandarer.blog.csdn.net/article/details/127719784
若是嫌麻烦可以直接移步文末去gitee仓库下载!!!!!!
若是嫌麻烦可以直接移步文末去gitee仓库下载!!!!!!
若是嫌麻烦可以直接移步文末去gitee仓库下载!!!!!!
1 桑基图
在左侧建立个axes并绘制桑基图。为了方便理解注释写的比较详细:
1.1 创建坐标区域部分代码
clc;clear;close all;rng(32) % sankeyBubble fig=figure('Name','sankey bubble','Units','normalized','Position',[.05,.05,.44,.85],'Color','w'); ax1=axes('Parent',fig,'Position',[1/20,1/15,2.8/5-1/20,1-1.6/15]); ax1.NextPlot='add';- 1
- 2
- 3
- 4
- 5
- 6
1.2 随机生成数据部分代码
LSet='ABCDEFGH'; links={'','',''}; for i=1:length(LSet) tLinks=[compose([char(LSet(i)+32),'%d'],(1:5)'),... num2cell(char(LSet(i).*ones(5,1))),num2cell(rand(5,1).*10)]; links=[links;tLinks]; end for i=1:6 links=[links; [char('A'+32+randi([0,7],[1,1])),... num2str(randi([1,5],[1,1]))],... char('A'+randi([0,7],[1,1])),... num2cell(rand(1,1).*10)]; end links(1,:)=[];- 1
- 2
- 3
- 4
- 5
- 6
- 7
- 8
- 9
- 10
- 11
- 12
- 13
- 14
- 15
1.3 实际绘图代码
% 创建桑基图对象(Create a Sankey diagram object) SK=SSankey(links(:,1),links(:,2),links(:,3)); % 修改对齐方式(Set alignment) % 'up'/'down'/'center'(default) SK.Align='down'; SK.Sep=.12; % 设置颜色(Set color) SK.ColorList=[slanCM(134,40);slanCM(134,8)]; % 修改链接颜色渲染方式(Set link color rendering method) % 'left'/'right'/'interp'(default)/'map'/'simple' SK.RenderingMethod='simple'; % 开始绘图(Start drawing) SK.draw(); for i=1:48 SK.setLabel(i,'FontSize',12) end- 1
- 2
- 3
- 4
- 5
- 6
- 7
- 8
- 9
- 10
- 11
- 12
- 13
- 14
- 15
- 16
- 17
- 18
- 19
- 20
- 21
- 22

桑基图更详细的用法请去以下推送获取查看哇:
下面几个图都是我写的这个桑基图工具能实现的可以去瞅瞅~


而配色使用的是我写的
slanCM工具包:


2 右侧axes创建
2.1 定位axes
因为我们是随机生成的数据,我们不知道右侧实际会有多宽,我们想要对齐就要获取一下数据范围,并计算一下右侧axes应该在的位置:
PatchSet=findobj(ax1,'Type','Patch'); Patch2Y=ones(0,4); for i=length(PatchSet):-1:1 if PatchSet(i).XData(1)==2 Patch2Y=[Patch2Y;PatchSet(i).YData(:)']; end end %% ======================================================================== % 构建右侧坐标区域并基础修饰 Patch2Lim=max(max(Patch2Y))-min(min(Patch2Y)); ax2=axes('Parent',fig,'Position',[2.8/5+1/80,1/15,1.5/5-1/20,Patch2Lim./diff(ax1.YLim).*(1-1.6/15)]); ax2.YLim=[min(min(Patch2Y)),max(max(Patch2Y))];- 1
- 2
- 3
- 4
- 5
- 6
- 7
- 8
- 9
- 10
- 11
- 12
- 13
2.2 右侧axes修饰
左侧我自己写的工具会自带修饰,因此只修饰右侧就好啦~
ax2.NextPlot='add'; ax2.Box='on'; ax2.YTick=[]; ax2.TickDir='out'; ax2.LineWidth=1; ax2.FontName='Times New Roman'; ax2.FontSize=11; ax2.YDir='reverse'; ax2.XLim=[-0.6,2.4]; ax2.XTick=-0.5:0.5:2; ax2.XLabel.String='-Log(Pvalue)'; ax2.XLabel.FontSize=14; ax2.XLabel.FontWeight='bold'; tMap=slanCM(20,64); colormap(tMap(33:end,:))- 1
- 2
- 3
- 4
- 5
- 6
- 7
- 8
- 9
- 10
- 11
- 12
- 13
- 14
- 15
- 16

3 气泡图绘制
3.1 随机数据生成
% 随便编了点数据 NLogPvalue=linspace(2,-0.3,8); PatchMeanY=(Patch2Y(:,2)+Patch2Y(:,3)).'./2; Count=randi([1,8],[1,8]); HitRatio=0.1+0.4.*rand([1,8]);- 1
- 2
- 3
- 4
- 5
3.2 绘制气泡图并调整气泡大小
bubblechart(NLogPvalue,PatchMeanY,Count,HitRatio) bubblesize([15,30])- 1
- 2
3.3 绘制颜色条和图例
% 绘制颜色条 CMPHdl=colorbar; CMPHdl.Position=[4.3/5,1/15+Patch2Lim./diff(ax1.YLim).*(1-1.6/15)./2,1/40,Patch2Lim./diff(ax1.YLim).*(1-1.6/15).*0.4]; text(ax2,ax2.XLim(2)+diff(ax2.XLim).*0.12,ax2.YLim(1)+diff(ax2.YLim).*0.05,'Hit Ratio',... 'FontSize',14,'FontName','Times New Roman','FontWeight','bold') % 绘制图例 LGDHdl=bubblelegend; LGDHdl.Position=[4.2/5,1/15,1/40,Patch2Lim./diff(ax1.YLim).*(1-1.6/15).*0.4]; LGDHdl.Box='off'; text(ax2,ax2.XLim(2)+diff(ax2.XLim).*0.12,ax2.YLim(1)+diff(ax2.YLim).*0.65,'Count',... 'FontSize',14,'FontName','Times New Roman','FontWeight','bold')- 1
- 2
- 3
- 4
- 5
- 6
- 7
- 8
- 9
- 10
- 11
- 12

4 完整代码
clc;clear;close all;rng(32) % sankeyBubble fig=figure('Name','sankey bubble','Units','normalized','Position',[.05,.05,.44,.85],'Color','w'); ax1=axes('Parent',fig,'Position',[1/20,1/15,2.8/5-1/20,1-1.6/15]); ax1.NextPlot='add'; LSet='ABCDEFGH'; links={'','',''}; for i=1:length(LSet) tLinks=[compose([char(LSet(i)+32),'%d'],(1:5)'),... num2cell(char(LSet(i).*ones(5,1))),num2cell(rand(5,1).*10)]; links=[links;tLinks]; end for i=1:6 links=[links; [char('A'+32+randi([0,7],[1,1])),... num2str(randi([1,5],[1,1]))],... char('A'+randi([0,7],[1,1])),... num2cell(rand(1,1).*10)]; end links(1,:)=[]; % 创建桑基图对象(Create a Sankey diagram object) SK=SSankey(links(:,1),links(:,2),links(:,3)); % 修改对齐方式(Set alignment) % 'up'/'down'/'center'(default) SK.Align='down'; SK.Sep=.12; % 设置颜色(Set color) SK.ColorList=[slanCM(134,40);slanCM(134,8)]; % 修改链接颜色渲染方式(Set link color rendering method) % 'left'/'right'/'interp'(default)/'map'/'simple' SK.RenderingMethod='simple'; % 开始绘图(Start drawing) SK.draw(); for i=1:48 SK.setLabel(i,'FontSize',12) end PatchSet=findobj(ax1,'Type','Patch'); Patch2Y=ones(0,4); for i=length(PatchSet):-1:1 if PatchSet(i).XData(1)==2 Patch2Y=[Patch2Y;PatchSet(i).YData(:)']; end end %% ======================================================================== % 构建右侧坐标区域并基础修饰 Patch2Lim=max(max(Patch2Y))-min(min(Patch2Y)); ax2=axes('Parent',fig,'Position',[2.8/5+1/80,1/15,1.5/5-1/20,Patch2Lim./diff(ax1.YLim).*(1-1.6/15)]); ax2.YLim=[min(min(Patch2Y)),max(max(Patch2Y))]; ax2.NextPlot='add'; ax2.Box='on'; ax2.YTick=[]; ax2.TickDir='out'; ax2.LineWidth=1; ax2.FontName='Times New Roman'; ax2.FontSize=11; ax2.YDir='reverse'; ax2.XLim=[-0.6,2.4]; ax2.XTick=-0.5:0.5:2; ax2.XLabel.String='-Log(Pvalue)'; ax2.XLabel.FontSize=14; ax2.XLabel.FontWeight='bold'; tMap=slanCM(20,64); colormap(tMap(33:end,:)) % 随便编了点数据 NLogPvalue=linspace(2,-0.3,8); PatchMeanY=(Patch2Y(:,2)+Patch2Y(:,3)).'./2; Count=randi([1,8],[1,8]); HitRatio=0.1+0.4.*rand([1,8]); bubblechart(NLogPvalue,PatchMeanY,Count,HitRatio) bubblesize([15,30]) % 绘制颜色条 CMPHdl=colorbar; CMPHdl.Position=[4.3/5,1/15+Patch2Lim./diff(ax1.YLim).*(1-1.6/15)./2,1/40,Patch2Lim./diff(ax1.YLim).*(1-1.6/15).*0.4]; text(ax2,ax2.XLim(2)+diff(ax2.XLim).*0.12,ax2.YLim(1)+diff(ax2.YLim).*0.05,'Hit Ratio',... 'FontSize',14,'FontName','Times New Roman','FontWeight','bold') % 绘制图例 LGDHdl=bubblelegend; LGDHdl.Position=[4.2/5,1/15,1/40,Patch2Lim./diff(ax1.YLim).*(1-1.6/15).*0.4]; LGDHdl.Box='off'; text(ax2,ax2.XLim(2)+diff(ax2.XLim).*0.12,ax2.YLim(1)+diff(ax2.YLim).*0.65,'Count',... 'FontSize',14,'FontName','Times New Roman','FontWeight','bold')- 1
- 2
- 3
- 4
- 5
- 6
- 7
- 8
- 9
- 10
- 11
- 12
- 13
- 14
- 15
- 16
- 17
- 18
- 19
- 20
- 21
- 22
- 23
- 24
- 25
- 26
- 27
- 28
- 29
- 30
- 31
- 32
- 33
- 34
- 35
- 36
- 37
- 38
- 39
- 40
- 41
- 42
- 43
- 44
- 45
- 46
- 47
- 48
- 49
- 50
- 51
- 52
- 53
- 54
- 55
- 56
- 57
- 58
- 59
- 60
- 61
- 62
- 63
- 64
- 65
- 66
- 67
- 68
- 69
- 70
- 71
- 72
- 73
- 74
- 75
- 76
- 77
- 78
- 79
- 80
- 81
- 82
- 83
- 84
- 85
- 86
- 87
- 88
- 89
- 90
- 91
- 92
- 93
- 94
- 95
- 96
- 97
完
以上已经是本文全部内容,需要用到两个我自己写的工具包,若懒得一一获取代码,可以去以下gitee仓库获取全部代码:
-
相关阅读:
工作电压范围宽的国产音频限幅器D2761用于蓝牙音箱,输出噪声最大仅-90dBV
如何将JACOCO应用到企业实战中~测试过招,只需6点
Nuxt.js 生成sitemap站点地图文件
【面试系列】C++ 高频面试题
Seata原理浅析
Vue2.0开发之——Vue基础用法-事件绑定$event(20)
PMP 11.27 考试倒计时16天!冲刺啦!
Django的简单使用
Vue小技巧
【MySQL】(五)DML表数据操作——数据的插入、修改、删除
- 原文地址:https://blog.csdn.net/slandarer/article/details/132843396
