-
(5)点云数据处理学习——其它官网例子2
1、主要参考
(1)官方稳定地址
Point cloud — Open3D 0.16.0 documentation
2、相关功能
2.1凸包(Convex hull)
(1)函数compute_vertex_normals
create_from_triangle_mesh(2)功能说明
点云的凸包是包含所有点的最小凸集。Open3D包含compute_convex_hull方法,用于计算点云的凸包。该实现基于Qhull。
(3)测试代码
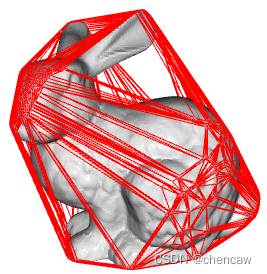
在下面的示例代码中,我们首先从网格中采样一个点云,并计算作为三角形网格返回的凸包。然后,我们将凸包可视化为一个红色的LineSet。
1)本次测试还是那只兔子,原始的3d显示如下
- import open3d as o3d
- import numpy as np
- #网络下载,官方例子
- # bunny = o3d.data.BunnyMesh()
- # mesh = o3d.io.read_triangle_mesh(bunny.path)
- #或者下载后本地读取
- #https://github.com/isl-org/open3d_downloads/releases/download/20220201-data/BunnyMesh.ply
- plypath = "D:/RGBD_CAMERA/python_3d_process/BunnyMesh/BunnyMesh.ply"
- # mesh = o3d.io.read_point_cloud(plypath) # path为文件路径 #直接读取点云的方法
- mesh = o3d.io.read_triangle_mesh(plypath) # path为文件路径
- o3d.visualization.draw_geometries([mesh])
兔子的图,网络问题暂时上传不了

注意:读取时使用了read_triangle_mesh(三角网格)而不是read_point_cloud
2)方法一直接对兔子做凸包
- import open3d as o3d
- import numpy as np
- #网络下载,官方例子
- # bunny = o3d.data.BunnyMesh()
- # mesh = o3d.io.read_triangle_mesh(bunny.path)
- #或者下载后本地读取
- #https://github.com/isl-org/open3d_downloads/releases/download/20220201-data/BunnyMesh.ply
- plypath = "D:/RGBD_CAMERA/python_3d_process/BunnyMesh/BunnyMesh.ply"
- # mesh = o3d.io.read_point_cloud(plypath) # path为文件路径 #直接读取点云的方法
- mesh = o3d.io.read_triangle_mesh(plypath) # path为文件路径
- # o3d.visualization.draw_geometries([mesh])
- #(方法一)直接对兔子做凸包
- hull, _ = mesh.compute_convex_hull()
- hull_ls = o3d.geometry.LineSet.create_from_triangle_mesh(hull)
- hull_ls.paint_uniform_color((1, 0, 0))
- o3d.visualization.draw_geometries([mesh,hull_ls])
- #(方法二)对兔子采样后做凸包
- # pcl = mesh.sample_points_poisson_disk(number_of_points=2000)
- # hull, _ = pcl.compute_convex_hull()
- # hull_ls = o3d.geometry.LineSet.create_from_triangle_mesh(hull)
- # hull_ls.paint_uniform_color((1, 0, 0))
- # o3d.visualization.draw_geometries([pcl, hull_ls])
兔子的图如下
3)方法二,对兔子进行下采样后做凸包
- import open3d as o3d
- import numpy as np
- #网络下载,官方例子
- # bunny = o3d.data.BunnyMesh()
- # mesh = o3d.io.read_triangle_mesh(bunny.path)
- #或者下载后本地读取
- #https://github.com/isl-org/open3d_downloads/releases/download/20220201-data/BunnyMesh.ply
- plypath = "D:/RGBD_CAMERA/python_3d_process/BunnyMesh/BunnyMesh.ply"
- # mesh = o3d.io.read_point_cloud(plypath) # path为文件路径 #直接读取点云的方法
- mesh = o3d.io.read_triangle_mesh(plypath) # path为文件路径
- # o3d.visualization.draw_geometries([mesh])
- #(方法一)直接对兔子做凸包
- # hull, _ = mesh.compute_convex_hull()
- # hull_ls = o3d.geometry.LineSet.create_from_triangle_mesh(hull)
- # hull_ls.paint_uniform_color((1, 0, 0))
- # o3d.visualization.draw_geometries([mesh,hull_ls])
- #(方法二)对兔子采样后做凸包
- pcl = mesh.sample_points_poisson_disk(number_of_points=2000)
- hull, _ = pcl.compute_convex_hull()
- hull_ls = o3d.geometry.LineSet.create_from_triangle_mesh(hull)
- hull_ls.paint_uniform_color((1, 0, 0))
- o3d.visualization.draw_geometries([pcl, hull_ls])
兔子的图如下

(4)函数说明
sample_points_poisson_disk -- 泊松磁盘采样,下采样的一个方法
2.2 DBSCAN 分类集群(DBSCAN clustering)
(1)函数
cluster_dbscan(eps=0.02, min_points=10, print_progress=True)
(2)说明
给定一个点云,例如一个深度传感器,我们希望将局部点云数据集群分组在一起。为此,我们可以使用聚类算法。Open3D实现了DBSCAN [Ester1996],这是一种基于密度的聚类算法。该算法在cluster_dbscan中实现,需要两个参数:eps定义到集群中邻居的距离,min_points定义形成集群所需的最小点数。函数返回标签,其中标签-1表示噪声。
(3)测试代码
- import open3d as o3d
- import numpy as np
- from matplotlib import pyplot as plt
- # 初次使用下载模型
- # ply_point_cloud = o3d.data.PLYPointCloud()
- # pcd = o3d.io.read_point_cloud(ply_point_cloud.path)
- # 或者直接使用本地
- plypath = "D:/RGBD_CAMERA/python_3d_process/DemoCropPointCloud/fragment.ply"
- pcd = o3d.io.read_point_cloud(plypath) # path为文件路径
- with o3d.utility.VerbosityContextManager(
- o3d.utility.VerbosityLevel.Debug) as cm:
- labels = np.array(
- pcd.cluster_dbscan(eps=0.02, min_points=10, print_progress=True))
- max_label = labels.max()
- print(f"point cloud has {max_label + 1} clusters")
- colors = plt.get_cmap("tab20")(labels / (max_label if max_label > 0 else 1))
- colors[labels < 0] = 0
- pcd.colors = o3d.utility.Vector3dVector(colors[:, :3])
- o3d.visualization.draw_geometries([pcd],
- zoom=0.455,
- front=[-0.4999, -0.1659, -0.8499],
- lookat=[2.1813, 2.0619, 2.0999],
- up=[0.1204, -0.9852, 0.1215])
(4)测试结果
(稍微大一点的截图就没法上传,只能上小图)
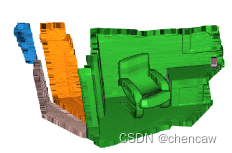
该算法预先计算了所有点在半径内的所有邻点。如果所选eps太大,这可能需要大量内存。
(5)自己的例子,未剔除点云的处理结果
- import open3d as o3d
- import numpy as np
- from matplotlib import pyplot as plt
- # 初次使用下载模型
- # ply_point_cloud = o3d.data.PLYPointCloud()
- # pcd = o3d.io.read_point_cloud(ply_point_cloud.path)
- # 或者直接使用本地
- # plypath = "D:/RGBD_CAMERA/python_3d_process/DemoCropPointCloud/fragment.ply"
- plypath = "D:/RGBD_CAMERA/python_3d_process/1_hezi.pcd"
- pcd = o3d.io.read_point_cloud(plypath) # path为文件路径
- pcd = pcd.remove_non_finite_points(True, False)#剔除无效值
- with o3d.utility.VerbosityContextManager(
- o3d.utility.VerbosityLevel.Debug) as cm:
- labels = np.array(
- # pcd.cluster_dbscan(eps=0.02, min_points=10, print_progress=True))
- pcd.cluster_dbscan(eps=10, min_points=200, print_progress=True))
- max_label = labels.max()
- print(f"point cloud has {max_label + 1} clusters")
- colors = plt.get_cmap("tab20")(labels / (max_label if max_label > 0 else 1))
- colors[labels < 0] = 0
- pcd.colors = o3d.utility.Vector3dVector(colors[:, :3])
- o3d.visualization.draw_geometries([pcd],
- zoom=0.455,
- front=[-0.4999, -0.1659, -0.8499],
- lookat=[2.1813, 2.0619, 2.0999],
- up=[0.1204, -0.9852, 0.1215])

注意:其中标签-1表示噪声。用黑色表示
colors[labels < 0] = 0
2.3 平面分割(Plane segmentation)
(1)函数
segment_plane(distance_threshold=0.01,ransac_n=3,num_iterations=1000)
(2)功能说明
Open3D还支持使用RANSAC从点云中分割几何原始特征。为了找到点云中支持度最大的平面,我们可以使用segment_plane函数。该方法有三个参数:distance_threshold定义点到估计平面的最大距离,ransac_n定义估计平面时随机抽样的点的数量,num_iterations定义随机平面抽样和验证的频率。然后函数返回平面为(a,b,c,d),这样对于平面上的每个点(x,y,z)我们得到ax+by+cz+d=0。该函数进一步返回索引列表。
(3)测试代码
- import open3d as o3d
- import numpy as np
- from matplotlib import pyplot as plt
- # 初次使用下载模型
- pcd_point_cloud = o3d.data.PCDPointCloud()
- pcd = o3d.io.read_point_cloud(pcd_point_cloud.path)
- # 或者直接使用本地
- # plypath = "D:/RGBD_CAMERA/python_3d_process/PCDPointCloud/fragment.pcd"
- # pcd = o3d.io.read_point_cloud(plypath) # path为文件路径
- plane_model, inliers = pcd.segment_plane(distance_threshold=0.01,
- ransac_n=3,
- num_iterations=1000)
- [a, b, c, d] = plane_model
- print(f"Plane equation: {a:.2f}x + {b:.2f}y + {c:.2f}z + {d:.2f} = 0")
- inlier_cloud = pcd.select_by_index(inliers)
- inlier_cloud.paint_uniform_color([1.0, 0, 0])
- outlier_cloud = pcd.select_by_index(inliers, invert=True)
- o3d.visualization.draw_geometries([inlier_cloud, outlier_cloud],
- zoom=0.8,
- front=[-0.4999, -0.1659, -0.8499],
- lookat=[2.1813, 2.0619, 2.0999],
- up=[0.1204, -0.9852, 0.1215])
(4)测试结果

注意:其中标注为红色的是分割出来的平面
(5)自己的某个简单例子的测试
- import open3d as o3d
- import numpy as np
- from matplotlib import pyplot as plt
- # # 初次使用下载模型
- # pcd_point_cloud = o3d.data.PCDPointCloud()
- # pcd = o3d.io.read_point_cloud(pcd_point_cloud.path)
- # # 或者直接使用本地
- # # plypath = "D:/RGBD_CAMERA/python_3d_process/PCDPointCloud/fragment.pcd"
- # # pcd = o3d.io.read_point_cloud(plypath) # path为文件路径
- # plane_model, inliers = pcd.segment_plane(distance_threshold=0.01,
- # ransac_n=3,
- # num_iterations=1000)
- # [a, b, c, d] = plane_model
- # print(f"Plane equation: {a:.2f}x + {b:.2f}y + {c:.2f}z + {d:.2f} = 0")
- # inlier_cloud = pcd.select_by_index(inliers)
- # inlier_cloud.paint_uniform_color([1.0, 0, 0])
- # outlier_cloud = pcd.select_by_index(inliers, invert=True)
- # o3d.visualization.draw_geometries([inlier_cloud, outlier_cloud],
- # zoom=0.8,
- # front=[-0.4999, -0.1659, -0.8499],
- # lookat=[2.1813, 2.0619, 2.0999],
- # up=[0.1204, -0.9852, 0.1215])
- #其它例子
- plypath = "D:/RGBD_CAMERA/python_3d_process/1_hezi.pcd"
- pcd = o3d.io.read_point_cloud(plypath) # path为文件路径
- pcd = pcd.remove_non_finite_points(True, False)#剔除无效值
- pcd.paint_uniform_color([0.5, 0.5, 0.5])
- plane_model, inliers = pcd.segment_plane(distance_threshold=1,
- ransac_n=3,
- num_iterations=1000)
- [a, b, c, d] = plane_model
- print(f"Plane equation: {a:.2f}x + {b:.2f}y + {c:.2f}z + {d:.2f} = 0")
- inlier_cloud = pcd.select_by_index(inliers)
- inlier_cloud.paint_uniform_color([1.0, 0, 0])
- outlier_cloud = pcd.select_by_index(inliers, invert=True)
- o3d.visualization.draw_geometries([inlier_cloud, outlier_cloud],
- zoom=0.8,
- front=[-0.4999, -0.1659, -0.8499],
- lookat=[2.1813, 2.0619, 2.0999],
- up=[0.1204, -0.9852, 0.1215])
(6)测试结果

2.4 隐点去除(Hidden point removal)
(1)函数
hidden_point_removal --- 隐点去除
另外这个例子还用到了
sample_points_poisson_disk -- 泊松磁盘采样
(2)功能说明
想象一下,您想从给定的视点渲染一个点云,但是来自背景的点由于没有被其他点遮挡而泄漏到前景中。为此,我们可以应用隐点去除算法。在Open3D中,[Katz2007]实现了从给定视图逼近点云可见性的方法,而无需进行曲面重构或正常估计
也就是,在特定视角看不到的就不渲染了
(3)本次测试用到的漂亮的模型如下
- import open3d as o3d
- import numpy as np
- from matplotlib import pyplot as plt
- # # 初次使用下载模型
- print("Convert mesh to a point cloud and estimate dimensions")
- armadillo = o3d.data.ArmadilloMesh()
- pcd = o3d.io.read_point_cloud(armadillo.path) # path为文件路径
- # # 或者直接使用本地
- # # plypath = "D:/RGBD_CAMERA/python_3d_process/ArmadilloMesh/ArmadilloMesh.ply"
- # # pcd = o3d.io.read_point_cloud(plypath) # path为文件路径
- o3d.visualization.draw_geometries([pcd])

(4)测试代码
注意:求了点云值的二范数
np.linalg.norm(求范数)
参考说明地址
np.linalg.norm(求范数)_清晨~的博客-CSDN博客_np.linalg.norm

- import open3d as o3d
- import numpy as np
- from matplotlib import pyplot as plt
- # # 初次使用下载模型
- print("Convert mesh to a point cloud and estimate dimensions")
- armadillo = o3d.data.ArmadilloMesh()
- # # pcd = o3d.io.read_point_cloud(armadillo.path) # path为文件路径
- # # 或者直接使用本地
- # # plypath = "D:/RGBD_CAMERA/python_3d_process/ArmadilloMesh/ArmadilloMesh.ply"
- # # pcd = o3d.io.read_point_cloud(plypath) # path为文件路径
- # # o3d.visualization.draw_geometries([pcd])
- mesh = o3d.io.read_triangle_mesh(armadillo.path)
- mesh.compute_vertex_normals()
- pcd = mesh.sample_points_poisson_disk(5000)
- diameter = np.linalg.norm(
- np.asarray(pcd.get_max_bound()) - np.asarray(pcd.get_min_bound()))
- o3d.visualization.draw_geometries([pcd])
注意:get_max_bound()和get_min_bound()分别取得体素边界的最大坐标和最小坐标 ,待有空确认???
(4)测试结果

(5)设定摄像头视角,去除隐点
- import open3d as o3d
- import numpy as np
- from matplotlib import pyplot as plt
- # # 初次使用下载模型
- print("Convert mesh to a point cloud and estimate dimensions")
- armadillo = o3d.data.ArmadilloMesh()
- # # pcd = o3d.io.read_point_cloud(armadillo.path) # path为文件路径
- # # 或者直接使用本地
- # # plypath = "D:/RGBD_CAMERA/python_3d_process/ArmadilloMesh/ArmadilloMesh.ply"
- # # pcd = o3d.io.read_point_cloud(plypath) # path为文件路径
- # # o3d.visualization.draw_geometries([pcd])
- mesh = o3d.io.read_triangle_mesh(armadillo.path)
- mesh.compute_vertex_normals()
- pcd = mesh.sample_points_poisson_disk(5000)
- diameter = np.linalg.norm(
- np.asarray(pcd.get_max_bound()) - np.asarray(pcd.get_min_bound()))
- # o3d.visualization.draw_geometries([pcd])
- print("Define parameters used for hidden_point_removal")
- camera = [0, 0, diameter]
- radius = diameter * 100
- print("Get all points that are visible from given view point")
- _, pt_map = pcd.hidden_point_removal(camera, radius)
- print("Visualize result")
- pcd = pcd.select_by_index(pt_map)
- o3d.visualization.draw_geometries([pcd])

2.5 下采样的其它几个方法
几个函数
voxel_down_sample(voxel_size=0.05)  --上一个教程见了,体素下采样,设置体素大小后,将包含在每个体素内的所有点平均计算得到一个点,从而实现下采样
sample_points_poisson_disk    --  泊松磁盘采样,下采样的一个方法uniform_down_sample(every_k_points=5)  --   通过收集每n个点来对点云进行下采样
2.6 点云离群值去除(Point cloud outlier removal)
注意:和我的第2个教程内容基本差不多
(2)点云库处理学习——剔除点云值_chencaw的博客-CSDN博客
官网教程的位置
Point cloud — Open3D 0.16.0 documentation
(1)准备相应数据
- import open3d as o3d
- import numpy as np
- from matplotlib import pyplot as plt
- print("Load a ply point cloud, print it, and render it")
- sample_pcd_data = o3d.data.PCDPointCloud()
- pcd = o3d.io.read_point_cloud(sample_pcd_data.path)
- o3d.visualization.draw_geometries([pcd],
- zoom=0.3412,
- front=[0.4257, -0.2125, -0.8795],
- lookat=[2.6172, 2.0475, 1.532],
- up=[-0.0694, -0.9768, 0.2024])
- print("Downsample the point cloud with a voxel of 0.02")
- voxel_down_pcd = pcd.voxel_down_sample(voxel_size=0.02)
- o3d.visualization.draw_geometries([voxel_down_pcd],
- zoom=0.3412,
- front=[0.4257, -0.2125, -0.8795],
- lookat=[2.6172, 2.0475, 1.532],
- up=[-0.0694, -0.9768, 0.2024])

(2)通过uniform_down_sample方法下采样

2.6.1统计剔除函数(Statistical outlier removal)
(1)说明
Statistical_outlier_removal删除距离其邻居更远的点。它接受两个输入参数:
- Nb_neighbors,它指定计算给定点的平均距离时要考虑多少个邻居。
- Std_ratio,它允许基于跨点云平均距离的标准差设置阈值水平。这个数字越低,过滤器的强度就越大。
(2)测试例子
- import open3d as o3d
- import numpy as np
- from matplotlib import pyplot as plt
- def display_inlier_outlier(cloud, ind):
- inlier_cloud = cloud.select_by_index(ind)
- outlier_cloud = cloud.select_by_index(ind, invert=True)
- print("Showing outliers (red) and inliers (gray): ")
- outlier_cloud.paint_uniform_color([1, 0, 0])
- inlier_cloud.paint_uniform_color([0.8, 0.8, 0.8])
- o3d.visualization.draw_geometries([inlier_cloud, outlier_cloud],
- zoom=0.3412,
- front=[0.4257, -0.2125, -0.8795],
- lookat=[2.6172, 2.0475, 1.532],
- up=[-0.0694, -0.9768, 0.2024])
- print("Load a ply point cloud, print it, and render it")
- sample_pcd_data = o3d.data.PCDPointCloud()
- pcd = o3d.io.read_point_cloud(sample_pcd_data.path)
- # o3d.visualization.draw_geometries([pcd],
- # zoom=0.3412,
- # front=[0.4257, -0.2125, -0.8795],
- # lookat=[2.6172, 2.0475, 1.532],
- # up=[-0.0694, -0.9768, 0.2024])
- print("Downsample the point cloud with a voxel of 0.02")
- voxel_down_pcd = pcd.voxel_down_sample(voxel_size=0.02)
- # o3d.visualization.draw_geometries([voxel_down_pcd],
- # zoom=0.3412,
- # front=[0.4257, -0.2125, -0.8795],
- # lookat=[2.6172, 2.0475, 1.532],
- # up=[-0.0694, -0.9768, 0.2024])
- print("Every 5th points are selected")
- uni_down_pcd = pcd.uniform_down_sample(every_k_points=5)
- # o3d.visualization.draw_geometries([uni_down_pcd],
- # zoom=0.3412,
- # front=[0.4257, -0.2125, -0.8795],
- # lookat=[2.6172, 2.0475, 1.532],
- # up=[-0.0694, -0.9768, 0.2024])
- print("Statistical oulier removal")
- cl, ind = voxel_down_pcd.remove_statistical_outlier(nb_neighbors=20,
- std_ratio=2.0)
- display_inlier_outlier(voxel_down_pcd, ind)

2.6.2半径离群值去除(Radius outlier removal)
(1)说明
Radius_outlier_removal删除在给定球面上几乎没有邻居的点。有两个参数可以用来调整过滤器到你的数据:
- Nb_points,它允许您选择球体应该包含的最小数量的点。
- 半径,它定义了球体的半径,该半径将用于计数相邻的球体。
(2)测试例子
- import open3d as o3d
- import numpy as np
- from matplotlib import pyplot as plt
- def display_inlier_outlier(cloud, ind):
- inlier_cloud = cloud.select_by_index(ind)
- outlier_cloud = cloud.select_by_index(ind, invert=True)
- print("Showing outliers (red) and inliers (gray): ")
- outlier_cloud.paint_uniform_color([1, 0, 0])
- inlier_cloud.paint_uniform_color([0.8, 0.8, 0.8])
- o3d.visualization.draw_geometries([inlier_cloud, outlier_cloud],
- zoom=0.3412,
- front=[0.4257, -0.2125, -0.8795],
- lookat=[2.6172, 2.0475, 1.532],
- up=[-0.0694, -0.9768, 0.2024])
- print("Load a ply point cloud, print it, and render it")
- sample_pcd_data = o3d.data.PCDPointCloud()
- pcd = o3d.io.read_point_cloud(sample_pcd_data.path)
- # o3d.visualization.draw_geometries([pcd],
- # zoom=0.3412,
- # front=[0.4257, -0.2125, -0.8795],
- # lookat=[2.6172, 2.0475, 1.532],
- # up=[-0.0694, -0.9768, 0.2024])
- print("Downsample the point cloud with a voxel of 0.02")
- voxel_down_pcd = pcd.voxel_down_sample(voxel_size=0.02)
- # o3d.visualization.draw_geometries([voxel_down_pcd],
- # zoom=0.3412,
- # front=[0.4257, -0.2125, -0.8795],
- # lookat=[2.6172, 2.0475, 1.532],
- # up=[-0.0694, -0.9768, 0.2024])
- print("Every 5th points are selected")
- uni_down_pcd = pcd.uniform_down_sample(every_k_points=5)
- # o3d.visualization.draw_geometries([uni_down_pcd],
- # zoom=0.3412,
- # front=[0.4257, -0.2125, -0.8795],
- # lookat=[2.6172, 2.0475, 1.532],
- # up=[-0.0694, -0.9768, 0.2024])
- print("Statistical oulier removal")
- cl, ind = voxel_down_pcd.remove_statistical_outlier(nb_neighbors=20,
- std_ratio=2.0)
- display_inlier_outlier(voxel_down_pcd, ind)
- print("Radius oulier removal")
- cl, ind = voxel_down_pcd.remove_radius_outlier(nb_points=16, radius=0.05)
- display_inlier_outlier(voxel_down_pcd, ind)

-
相关阅读:
OA办公软件篇(二)—权限管理
基于显扬科技自主研发3D机器视觉HY-X5在电池极耳缺陷检测的应用
Jetson Nano 部署(1):YOLOv5 目标检测实战介绍
小白免费编程学习网站
密码安全:保护你的数据不被入侵的重要性
java毕业设计权益会员管理源码+lw文档+mybatis+系统+mysql数据库+调试
HarmonyOS4.0系列——01、下载、安装、配置环境、搭建页面以及运行示例代码
使用Nginx搭建流媒体
正点原子嵌入式linux驱动开发——U-boot使用
docker容器内的attached 和detached模式
- 原文地址:https://blog.csdn.net/chencaw/article/details/128130081
- 最新文章
-
沪漂五周年了:我越来越迷茫了
Agentic Skill Routing 实战:别再把所有 Skill 塞进 AI Agent 上下文
MySQL-Seconds_behind_master的精度误差
[MAF预定义ChatClient中间件-03]CachingChatClient——利用缓存省钱省时间
AI的至暗历史:从万众期待到被政府撤资,AI的两次死亡徘徊
Agent OS :五种驯服不确定性的范式
PortSwigger SQL注入LAB11
数据库即时编译JIT
[Begin]AI Learn Data Day 0
深度学习进阶(二十七)现代 LLM 的核心架构设计其二:SwiGLU