-
一种多源信息融合方法及其应用(Matlab代码实现)
🍒🍒🍒欢迎关注🌈🌈🌈
📝个人主页:我爱Matlab
👍点赞➕评论➕收藏 == 养成习惯(一键三连)🌻🌻🌻🍌希望大家多多支持🍓~一起加油 🤗
💬语录:将来的我一定会感谢现在奋斗的自己!
🍁🥬🕒摘要🕒🥬🍁
多源信息融合(简称为信息融合)是指组合和合并多个来源的信息或数据以便形成一个统一结果的技术。它起源于军事领域中的多传感器综合应用,往往又叫多传感器数据融合(或数据融合),是对人或动物利用各种感官来获取信息并通过大脑综合分析来认识客观世界的一种功能模拟。随着研究的进展,信息融合领域中的“传感器”泛指各种信息来源,除了电子传感器,还包括数据库、网络系统等等。借助机器系统实现信息融合,既能有效地提高系统性能,也能扩展人的认识能力、辅助人类决策、提高解决问题的效率。因此,信息融合技术在军事和民用领域都有广阔的应用前景。近几年来,随着信息科技的发展,国内外掀起了信息融合技术研究的新热潮。
信息融合本质上是对大脑综合分析信息能力的模拟,其目的是要获得对事物(包括实体、关系和事件)的认识或相关知识,以促进有效决策。其中,实体既包括各个目标对象也包括融合主体(系统或人),关系反映了实体间的关联和所处情境,而事件一般跟时间有关,反映了实体的动态行为、状态或关系的变化(包括某种情境中实体的出现与消失)。信息融合的核心任务包括:(1)多源信息组合、优势互补,提高信息的完整性;(2)排除冗余与噪声、降低不确定性,提高信息的精确度和可靠性;(3)化解矛盾、去伪存真,提高信息的一致性和可信度。各任务相辅相成,由此带来很多其它好处,如扩展系统时空覆盖范围、提高信息和资源的利用率,支持更有效的推理与决策,改善系统整体性能等等。
✨🔎⚡运行结果⚡🔎✨
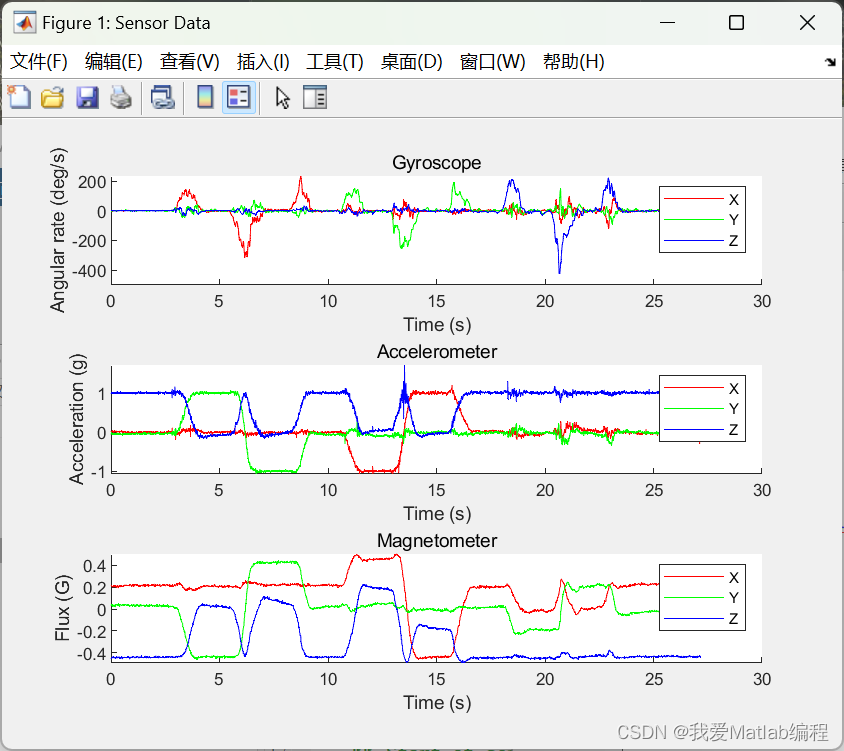
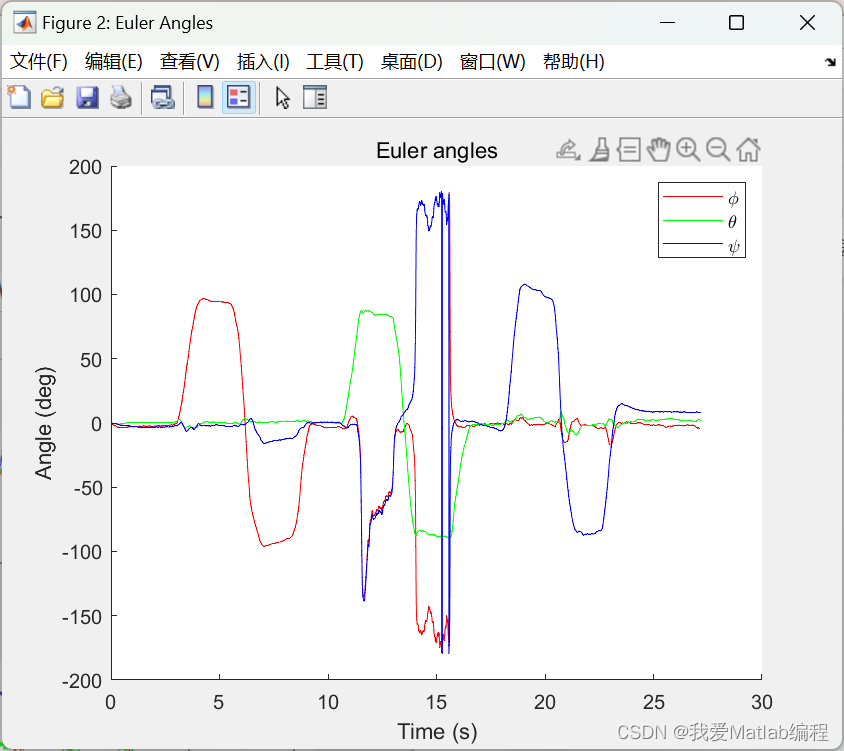
💂♨️👨🎓Matlab代码👨🎓♨️💂
%% Start of script
addpath('quaternion_library'); % include quaternion library
close all; % close all figures
clear; % clear all variables
clc; % clear the command terminal%% Import and plot sensor data
load('ExampleData.mat');
figure('Name', 'Sensor Data');
axis(1) = subplot(3,1,1);
hold on;
plot(time, Gyroscope(:,1), 'r');
plot(time, Gyroscope(:,2), 'g');
plot(time, Gyroscope(:,3), 'b');
legend('X', 'Y', 'Z');
xlabel('Time (s)');
ylabel('Angular rate (deg/s)');
title('Gyroscope');
hold off;
axis(2) = subplot(3,1,2);
hold on;
plot(time, Accelerometer(:,1), 'r');
plot(time, Accelerometer(:,2), 'g');
plot(time, Accelerometer(:,3), 'b');
legend('X', 'Y', 'Z');
xlabel('Time (s)');
ylabel('Acceleration (g)');
title('Accelerometer');
hold off;
axis(3) = subplot(3,1,3);
hold on;
plot(time, Magnetometer(:,1), 'r');
plot(time, Magnetometer(:,2), 'g');
plot(time, Magnetometer(:,3), 'b');
legend('X', 'Y', 'Z');
xlabel('Time (s)');
ylabel('Flux (G)');
title('Magnetometer');
hold off;
linkaxes(axis, 'x');%% Process sensor data through algorithm
AHRS = MadgwickAHRS('SamplePeriod', 1/256, 'Beta', 0.1);
% AHRS = MahonyAHRS('SamplePeriod', 1/256, 'Kp', 0.5);quaternion = zeros(length(time), 4);
for t = 1:length(time)
AHRS.Update(Gyroscope(t,:) * (pi/180), Accelerometer(t,:), Magnetometer(t,:)); % gyroscope units must be radians
quaternion(t, :) = AHRS.Quaternion;
end%% Plot algorithm output as Euler angles
% The first and third Euler angles in the sequence (phi and psi) become
% unreliable when the middle angles of the sequence (theta) approaches �90
% degrees. This problem commonly referred to as Gimbal Lock.
% See: http://en.wikipedia.org/wiki/Gimbal_lockeuler = quatern2euler(quaternConj(quaternion)) * (180/pi); % use conjugate for sensor frame relative to Earth and convert to degrees.
figure('Name', 'Euler Angles');
hold on;
plot(time, euler(:,1), 'r');
plot(time, euler(:,2), 'g');
plot(time, euler(:,3), 'b');
title('Euler angles');
xlabel('Time (s)');
ylabel('Angle (deg)');
legend('\phi', '\theta', '\psi');
hold off;%% End of script
📜📢🌈参考文献🌈📢📜
[1]陈科文,张祖平,龙军.多源信息融合关键问题、研究进展与新动向[J].计算机科学,2013,40(08):6-13.
-
相关阅读:
Keil setting issue
生存资料ROC曲线的最佳截点和平滑曲线
与传统IT开发相比,低代码平台有何优势?
制作.a静态库 (封盒)
PyQt5学习系列之新项目创建并使用widget
二、I/O模型
项目团队情绪管理的几点注意事项
React 第八章 React-router v6
如何读LVS报告
2736. 最大和查询 : 从一维限制到二维限制,逐步思考剖析本题(进阶一问)
- 原文地址:https://blog.csdn.net/m0_73907476/article/details/127980277
- 最新文章
-
沪漂五周年了:我越来越迷茫了
Agentic Skill Routing 实战:别再把所有 Skill 塞进 AI Agent 上下文
MySQL-Seconds_behind_master的精度误差
[MAF预定义ChatClient中间件-03]CachingChatClient——利用缓存省钱省时间
AI的至暗历史:从万众期待到被政府撤资,AI的两次死亡徘徊
Agent OS :五种驯服不确定性的范式
PortSwigger SQL注入LAB11
数据库即时编译JIT
[Begin]AI Learn Data Day 0
深度学习进阶(二十七)现代 LLM 的核心架构设计其二:SwiGLU