• js echarts踩坑记录


    最近有遇到要用echart的场景,踩了几个坑,在此记录下,
    ehchart的官网
    dat工具 用于做选项设置,可以动态改变echart的设置,如下图
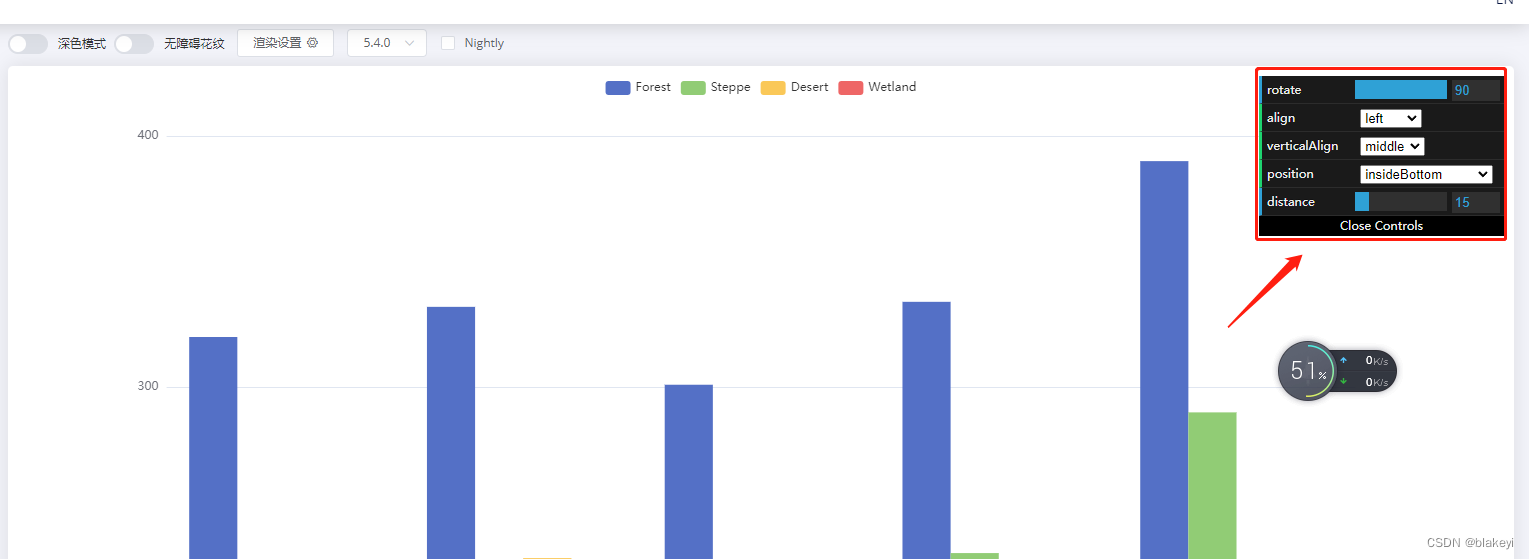
    高级柱状图

    高级柱状图

    • 问题1.echart在vue中使用时,报错 echarts Cannot read properties of undefined (reading ‘init’)
      问题原因:用的echarts版本是 "echarts": "^5.4.0", 导入的时候是 import echarts from 'echarts' , 应该是5.4.0版本上api做了拆分, 把导入改成import * as echarts from "echarts"; 就行了

    • 问题2 调用echarts.init 时报错 echarts Initialize failed: invalid dom
      问题原因:初始化时未获取到dom元素, 检查下挂载的dom元素是不是放在v-if或者v-show中, 或者检查echarts.init的调用时机(最好在mounted中)

    • 问题3 dat.gui的使用问题, 在官方的示例中是做了封装处理, 无法看到是怎么初始化dat的, 下面给个示例代码

    			let dom_chart = document.getElementById('echarts_container');
                if (!this.chart) {
                    this.chart = echarts.init(dom_chart, null, {
                        renderer: 'canvas',
                        useDirtyRect: false
                    });
                }
    
                // datgui参数
                var app = {};
                var option;
                const posList = [
                    'left',
                    'right',
                    'top',
                    'bottom',
                    'inside',
                    'insideTop',
                    'insideLeft',
                    'insideRight',
                    'insideBottom',
                    'insideTopLeft',
                    'insideTopRight',
                    'insideBottomLeft',
                    'insideBottomRight'
                ];
                app.configParameters = {
                    rotate: {
                        min: -90,
                        max: 90
                    },
                    align: {
                        options: {
                            left: 'left',
                            center: 'center',
                            right: 'right'
                        }
                    },
                    verticalAlign: {
                        options: {
                            top: 'top',
                            middle: 'middle',
                            bottom: 'bottom'
                        }
                    },
                    position: {
                        options: posList.reduce(function (map, pos) {
                            map[pos] = pos;
                            return map;
                        }, {})
                    },
                    distance: {
                        min: 0,
                        max: 100
                    }
                };
                let that = this
                app.config = {
                    rotate: 90,
                    align: 'left',
                    verticalAlign: 'middle',
                    position: 'insideBottom',
                    distance: 15,
                    onChange: function () {
                        const labelOption = {
                            rotate: app.config.rotate,
                            align: app.config.align,
                            verticalAlign: app.config.verticalAlign,
                            position: app.config.position,
                            distance: app.config.distance
                        };
                        that.chart.setOption({
                            series: [
                                {
                                    label: labelOption
                                },
                                {
                                    label: labelOption
                                },
                                {
                                    label: labelOption
                                },
                                {
                                    label: labelOption
                                }
                            ]
                        });
                    }
                };
                const labelOption = {
                    show: true,
                    position: app.config.position,
                    distance: app.config.distance,
                    align: app.config.align,
                    verticalAlign: app.config.verticalAlign,
                    rotate: app.config.rotate,
                    formatter: '{c}  {name|{a}}',
                    fontSize: 16,
                    rich: {
                        name: {}
                    }
                };
    
                // 数据
                option = {
                    tooltip: {
                        trigger: 'axis',
                        axisPointer: {
                            type: 'shadow'
                        }
                    },
                    legend: {
                        data: ['Forest', 'Steppe', 'Desert', 'Wetland']
                    },
                    toolbox: {
                        show: true,
                        orient: 'vertical',
                        left: 'right',
                        top: 'center',
                        feature: {
                            mark: { show: true },
                            dataView: { show: true, readOnly: false },
                            magicType: { show: true, type: ['line', 'bar', 'stack'] },
                            restore: { show: true },
                            saveAsImage: { show: true }
                        }
                    },
                    xAxis: [
                        {
                            type: 'category',
                            axisTick: { show: false },
                            data: ['2012', '2013', '2014', '2015', '2016']
                        }
                    ],
                    yAxis: [
                        {
                            type: 'value'
                        }
                    ],
                    series: [
                        {
                            name: 'Forest',
                            type: 'bar',
                            barGap: 0,
                            label: labelOption,
                            emphasis: {
                                focus: 'series'
                            },
                            data: [320, 332, 301, 334, 390]
                        },
                        {
                            name: 'Steppe',
                            type: 'bar',
                            label: labelOption,
                            emphasis: {
                                focus: 'series'
                            },
                            data: [220, 182, 191, 234, 290]
                        },
                        {
                            name: 'Desert',
                            type: 'bar',
                            label: labelOption,
                            emphasis: {
                                focus: 'series'
                            },
                            data: [150, 232, 201, 154, 190]
                        },
                        {
                            name: 'Wetland',
                            type: 'bar',
                            label: labelOption,
                            emphasis: {
                                focus: 'series'
                            },
                            data: [98, 77, 101, 99, 40]
                        }
                    ]
                };
    
                if (option && typeof option === 'object') {
                    this.chart.setOption(option);
                }
                if (!this.datgui) {
                    this.datgui = new datgui.GUI({ name: '选项设置', autoPlace: true });
                }
    
                // 设置显示位置
                let dom_dat = document.getElementsByClassName('dg ac');
                // 通过获得chart的位置来设置datgui的位置
                let pos = this.getDomAbsolutePos(dom_chart)
                dom_dat[0].style.top = `${pos.top}px`
    
                // 设置datgui, onChange中执行echart逻辑
                for (let key of Object.keys(app.configParameters)) {
                    // 先判断参数类型
                    const param = app.configParameters[key]
                    if ("min" in param) {
                        // 范围值的
                        this.datgui.add(app.config, key).min(param.min).max(param.max).onChange(app.config.onChange)
                    } else if ("options" in param) {
                        // 下拉框的
                        this.datgui.add(app.config, key, param.options).onChange(app.config.onChange)
                    }
                }
    
                window.addEventListener('resize', this.chart.resize);
    
    • 1
    • 2
    • 3
    • 4
    • 5
    • 6
    • 7
    • 8
    • 9
    • 10
    • 11
    • 12
    • 13
    • 14
    • 15
    • 16
    • 17
    • 18
    • 19
    • 20
    • 21
    • 22
    • 23
    • 24
    • 25
    • 26
    • 27
    • 28
    • 29
    • 30
    • 31
    • 32
    • 33
    • 34
    • 35
    • 36
    • 37
    • 38
    • 39
    • 40
    • 41
    • 42
    • 43
    • 44
    • 45
    • 46
    • 47
    • 48
    • 49
    • 50
    • 51
    • 52
    • 53
    • 54
    • 55
    • 56
    • 57
    • 58
    • 59
    • 60
    • 61
    • 62
    • 63
    • 64
    • 65
    • 66
    • 67
    • 68
    • 69
    • 70
    • 71
    • 72
    • 73
    • 74
    • 75
    • 76
    • 77
    • 78
    • 79
    • 80
    • 81
    • 82
    • 83
    • 84
    • 85
    • 86
    • 87
    • 88
    • 89
    • 90
    • 91
    • 92
    • 93
    • 94
    • 95
    • 96
    • 97
    • 98
    • 99
    • 100
    • 101
    • 102
    • 103
    • 104
    • 105
    • 106
    • 107
    • 108
    • 109
    • 110
    • 111
    • 112
    • 113
    • 114
    • 115
    • 116
    • 117
    • 118
    • 119
    • 120
    • 121
    • 122
    • 123
    • 124
    • 125
    • 126
    • 127
    • 128
    • 129
    • 130
    • 131
    • 132
    • 133
    • 134
    • 135
    • 136
    • 137
    • 138
    • 139
    • 140
    • 141
    • 142
    • 143
    • 144
    • 145
    • 146
    • 147
    • 148
    • 149
    • 150
    • 151
    • 152
    • 153
    • 154
    • 155
    • 156
    • 157
    • 158
    • 159
    • 160
    • 161
    • 162
    • 163
    • 164
    • 165
    • 166
    • 167
    • 168
    • 169
    • 170
    • 171
    • 172
    • 173
    • 174
    • 175
    • 176
    • 177
    • 178
    • 179
    • 180
    • 181
    • 182
    • 183
    • 184
    • 185
    • 186
    • 187
    • 188
    • 189
    • 190
    • 191
    • 192
    • 193
    • 194
    • 195
    • 196
    • 197
    • 198
    • 199
    • 200
    • 201
    • 202
    • 203
    • 204
    • 205
    • 206
    • 207
            getDomAbsolutePos(obj) {
                let top = 5 - obj.clientHeight, left = 0;
                //从目标元素开始向外遍历,累加top和left值  
                for (; obj != null; obj = obj.offsetParent) {
                    top += obj.offsetTop;
                    left += obj.offsetLeft;
                }
                return {
                    top,
                    left
                }
            },
    
    • 1
    • 2
    • 3
    • 4
    • 5
    • 6
    • 7
    • 8
    • 9
    • 10
    • 11
    • 12
  • 相关阅读:
    硫辛酸包裹CdS/ZnS硫化镉/硫化锌量子点
    C++信息学奥赛1181:整数奇偶排序
    零基础学Python之---pycharm快捷键的使用
    python 入门到精通(二)
    Worthington核糖核酸测定详细攻略
    多线程编程(1)
    Say Goodbye to OOM Crashes
    Chapter6.2:线性系统的校正方法
    C++-json(2)-unsigned char-unsigned char*-memcpy-strcpy-sizeof-strlen
    第六章-Python数据可视化--2
  • 原文地址:https://blog.csdn.net/blake321/article/details/127853424