-
Prometheus系列(2)之EC2安装Node端
目标
为Prometheus安装Node程序。
步骤
node exporter程序
wget https://github.com/prometheus/node_exporter/releases/download/v1.4.0/node_exporter-1.4.0.linux-amd64.tar.gz tar xvzf node_exporter-1.4.0.linux-amd64.tar.gz cd node_exporter-1.4.0.linux-amd64/ sudo cp ./node_exporter /usr/local/bin/- 1
- 2
- 3
- 4
- 5
node-exporter.service
sudo vim /etc/systemd/system/node-exporter.service- 1
内容如下:
[Unit] Description=Prometheus Node Exporter Service After=network.target [Service] User=node_exporter Group=node_exporter Type=simple ExecStart=/usr/local/bin/node_exporter [Install] WantedBy=multi-user.target- 1
- 2
- 3
- 4
- 5
- 6
- 7
- 8
- 9
- 10
- 11
- 12
node_exporter用户
sudo useradd --system --no-create-home --shell /sbin/nologin --comment "prometheus node_exporter user" --user-group node_exporter- 1
- 2
Sys V
sudo systemctl daemon-reload sudo systemctl enable node-exporter sudo systemctl start node-exporter sudo systemctl status node-exporter- 1
- 2
- 3
- 4
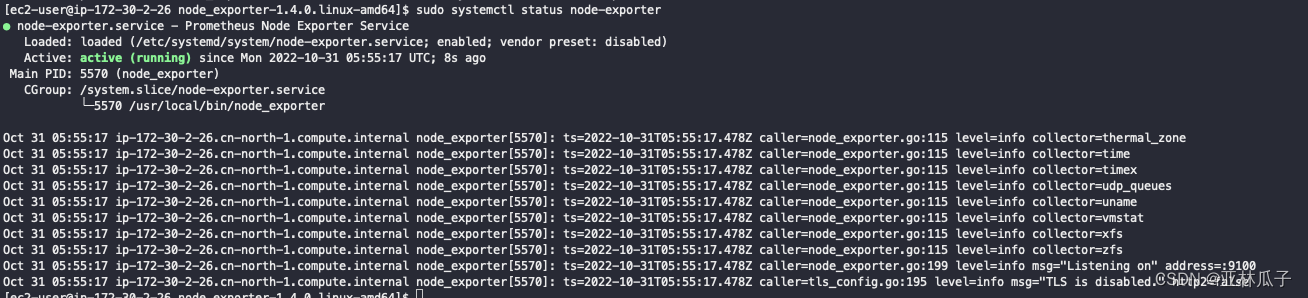
状态如下:
安全组放开9100端口
具体如下:

Prometheus服务器端
接下来回到《Prometheus系列(1)之EC2安装Server端》这篇文章中的Prometheus的服务器端的EC2机器上面。
更新/etc/prometheus/prometheus.yml配置
sudo vim /etc/prometheus/prometheus.yml- 1
添加如下内容:
- job_name: "node_exporter" static_configs: - targets: ["172.30.2.26:9100"]- 1
- 2
- 3
整个文件内容如下:
# my global config global: scrape_interval: 15s # Set the scrape interval to every 15 seconds. Default is every 1 minute. evaluation_interval: 15s # Evaluate rules every 15 seconds. The default is every 1 minute. # scrape_timeout is set to the global default (10s). # Alertmanager configuration alerting: alertmanagers: - static_configs: - targets: # - alertmanager:9093 # Load rules once and periodically evaluate them according to the global 'evaluation_interval'. rule_files: # - "first_rules.yml" # - "second_rules.yml" # A scrape configuration containing exactly one endpoint to scrape: # Here it's Prometheus itself. scrape_configs: # The job name is added as a label `job=` to any timeseries scraped from this config. - job_name: "prometheus" # metrics_path defaults to '/metrics' # scheme defaults to 'http'. static_configs: - targets: ["localhost:9090"] - job_name: "node_exporter" static_configs: - targets: ["172.30.2.26:9100"]- 1
- 2
- 3
- 4
- 5
- 6
- 7
- 8
- 9
- 10
- 11
- 12
- 13
- 14
- 15
- 16
- 17
- 18
- 19
- 20
- 21
- 22
- 23
- 24
- 25
- 26
- 27
- 28
- 29
- 30
- 31
- 32
重启Prometheus服务端
sudo systemctl restart prometheus- 1
验证Prometheus监听结果

总结
这就是Prometheus的Node Export的使用。
参考:
-
相关阅读:
基于PHP的毕业设计管理系统设计与实现
射频功率放大器的指标有哪些内容
Matplotlib数据可视化综合应用Matplotlib图形配置在线闯关_头歌实践教学平台
浪涌防护:TSS管的工作原理与应用?|深圳比创达EMC
lucene原理
Django框架
PYTHON访问ZABBIX的API批量对端口进行监控并创建触发器
计算机组成原理——数的表示与计算
数字后端——物理单元介绍(一)
YOLOv8改进主干DAMOYOLO结构:最新改进提出 CReToNeXt 结构,基于阿里达摩院出品的DAMOYOLO核心网络模型进行改进,打造高性能检测器
- 原文地址:https://blog.csdn.net/fxtxz2/article/details/127613991
