-
模式识别与图像处理课程实验一:图像处理实验(颜色算子实验、Susan、Harris角点检测实验、 sobel边缘算子检测实验)
模式识别与图像处理课程实验一:图像处理实验-->> 颜色算子实验、Susan、Harris角点检测实验、 sobel边缘算子检测实验

一、 实验内容
要求编写一个包含颜色算子,Susan,Harris,角点,sobel边缘算子的程。
二、 颜色算子实验
2.1、 提取红色
- 实验的程序如下
import numpy as np import cv2 as cv image = cv.imread("1.jpg") image = image / np.ones([1, 1, 3]).astype(np.float32) image = cv.cvtColor(image, cv.COLOR_BGR2RGB) print(image.shape) # 颜色算子 # red redAdd = np.ones([1, 1, 3]).astype(np.float32) redAdd[0, 0, 0] = 1.0 redAdd[0, 0, 1] = 0.5 redAdd[0, 0, 2] = 0.25 redSub = np.ones([1, 1, 3]).astype(np.float32) redSub[0, 0, 0] = 0.25 redSub[0, 0, 1] = 0.5 redSub[0, 0, 2] = 1.0 image1 = np.mean(image * redAdd, 2) image2 = np.mean(image * redSub, 2) + 100 imageRed = image1 / image2 redMax = np.max(imageRed) redMin = np.min(imageRed) imageRed = 255 * (imageRed - redMin) / (redMax - redMin) cv.imwrite("1red.png", imageRed)- 1
- 2
- 3
- 4
- 5
- 6
- 7
- 8
- 9
- 10
- 11
- 12
- 13
- 14
- 15
- 16
- 17
- 18
- 19
- 20
- 21
- 22
- 23
- 24
- 25
- 26
- 27
- 28
- 29
运行结果如下
- 实验原图

- 实验结果图

2.2、 提取绿色
实验的程序如下
import numpy as np import cv2 as cv image = cv.imread("1.jpg") image = image / np.ones([1, 1, 3]).astype(np.float32) image = cv.cvtColor(image, cv.COLOR_BGR2RGB) print(image.shape) # green greenAdd = np.ones([1, 1, 3]).astype(np.float32) greenAdd[0, 0, 0] = 0.5 greenAdd[0, 0, 1] = 1.0 greenAdd[0, 0, 2] = 0.25 greenSub = np.ones([1, 1, 3]).astype(np.float32) greenSub[0, 0, 0] = 0.5 greenSub[0, 0, 1] = 0.25 greenSub[0, 0, 2] = 1.0 image1 = np.mean(image * greenAdd, 2) image2 = np.mean(image * greenSub, 2) + 100 imageGreen = image1 / image2 greenMax = np.max(imageGreen) greenMin = np.min(imageGreen) imageRed = 255 * (imageGreen - greenMin) / (greenMax - greenMin) cv.imwrite("1green.png", imageRed)- 1
- 2
- 3
- 4
- 5
- 6
- 7
- 8
- 9
- 10
- 11
- 12
- 13
- 14
- 15
- 16
- 17
- 18
- 19
- 20
- 21
- 22
- 23
- 24
- 25
- 26
- 27
- 28
运行结果如下
-
实验原图

-
实验结果图

2.3、 提取蓝色
- 实验的程序如下
import numpy as np import cv2 as cv image = cv.imread("1.jpg") image = image / np.ones([1, 1, 3]).astype(np.float32) image = cv.cvtColor(image, cv.COLOR_BGR2RGB) print(image.shape) # bule buleAdd = np.ones([1, 1, 3]).astype(np.float32) buleAdd[0, 0, 0] = 0.25 buleAdd[0, 0, 1] = 0.5 buleAdd[0, 0, 2] = 1.0 buleSub = np.ones([1, 1, 3]).astype(np.float32) buleSub[0, 0, 0] = 1.0 buleSub[0, 0, 1] = 0.5 buleSub[0, 0, 2] = 0.25 image1 = np.mean(image * buleAdd, 2) image2 = np.mean(image * buleSub, 2) + 100 imageBlue = image1 / image2 blueMax = np.max(imageBlue) blueMin = np.min(imageBlue) imageBlue = 255 * (imageBlue - blueMin) / (blueMax - blueMin) cv.imwrite("1blue.png", imageBlue)- 1
- 2
- 3
- 4
- 5
- 6
- 7
- 8
- 9
- 10
- 11
- 12
- 13
- 14
- 15
- 16
- 17
- 18
- 19
- 20
- 21
- 22
- 23
- 24
- 25
- 26
- 27
- 28
- 29
运行结果如下
-
实验原图

-
实验结果图
三、 Susan、Harris角点检测实验
3. 1、 实验程序
3.1.1、Susan角点检测
Susan角点检测程序如下
import numpy as np import cv2 as cv image = cv.imread("2.jpg") image = np.mean(image, 2) height = image.shape[0] width = image.shape[1] print(image.shape) #susan 算子 radius = 5 imageSusan = np.zeros([height, width]).astype(np.float32) for h in range(radius, height-radius): for w in range(radius, width-radius): numSmall = 0 numLarge = 0 numAll = 0 for y in range(-radius, radius + 1): for x in range(-radius, radius+1): distance = np.sqrt(y**2 + x**2) if distance <= radius: numAll += 1 if image[h + y, w + x] < image[h, w] - 27: numSmall += 1 if image[h + y, w + x] > image[h, w] + 27: numLarge += 1 ratio = 1.0 * numSmall / numAll ratio2 = 1.0 * numLarge / numAll if ratio < 0.3: imageSusan[h, w] = 0.3 - ratio if ratio2 > 0.7: imageSusan[h, w] = ratio2 - 0.7 imageMax = np.max(imageSusan) imageMin = np.min(imageSusan) imageSusan = 255*(imageSusan - imageMin)/(imageMax - imageMin) print(imageSusan.shape) cv.imwrite("2.png", imageSusan)- 1
- 2
- 3
- 4
- 5
- 6
- 7
- 8
- 9
- 10
- 11
- 12
- 13
- 14
- 15
- 16
- 17
- 18
- 19
- 20
- 21
- 22
- 23
- 24
- 25
- 26
- 27
- 28
- 29
- 30
- 31
- 32
- 33
- 34
- 35
- 36
- 37
- 38
- 39
- 40
- 41
- 42
- 43
- 44
- 45
- 46
- 47
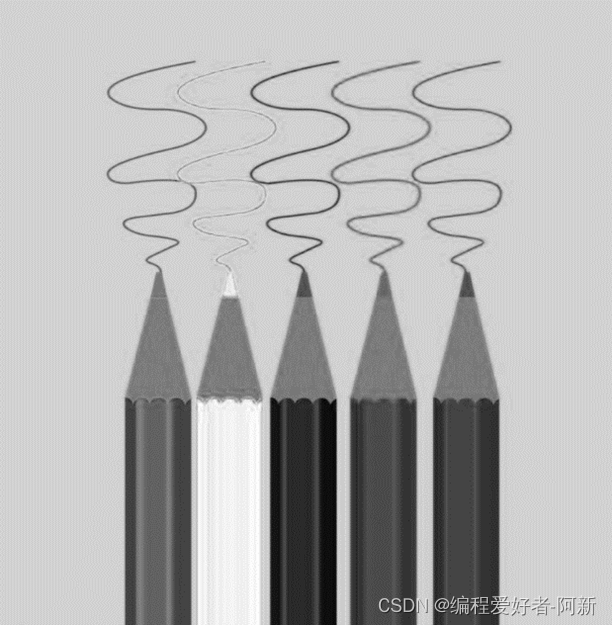
- 运行结果如下
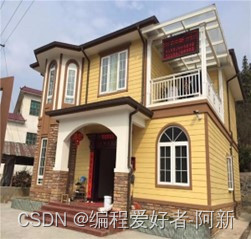
-
实验原图
-
实验结果图

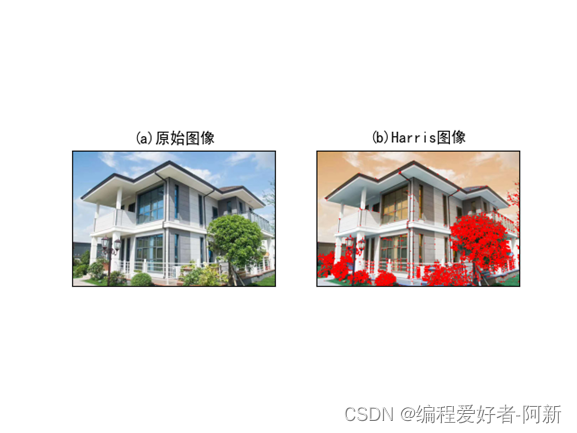
3.1.2、Harris角点检测
- Harris角点检测程序如下
import cv2 as cv import numpy as np import matplotlib.pyplot as plt # 读取图像 img = cv.imread('3.jpg') lenna_img = cv.cvtColor(img, cv.COLOR_BGR2RGB) # 图像转换成灰度图像 grayImage = cv.cvtColor(img, cv.COLOR_BGR2GRAY) grayImage = np.float32(grayImage) # Harris算子 harrisImage = cv.cornerHarris(grayImage, 2, 3, 0.04) harrisImage = cv.dilate(harrisImage, None) # 设置阈值 thresImage = 0.006 * harrisImage.max() img[harrisImage > thresImage] = [255, 0, 0] # 显示正常中文的标签 plt.rcParams['font.sans-serif'] = ['SimHei'] titles = [u'(a)原始图像', u'(b)Harris图像'] images = [lenna_img, img] for i in range(2): plt.subplot(1, 2, i + 1), plt.imshow(images[i], 'gray') plt.title(titles[i]) plt.xticks([]), plt.yticks([]) plt.show()- 1
- 2
- 3
- 4
- 5
- 6
- 7
- 8
- 9
- 10
- 11
- 12
- 13
- 14
- 15
- 16
- 17
- 18
- 19
- 20
- 21
- 22
- 23
- 24
- 25
- 26
- 27
- 28
- 29
- 30
- 31
- 32
- 33
运行结果如下
四、 sobel边缘算子检测实验
4.1、sobel边缘算子检
- sobel边缘算子检程序如下
import numpy as np import cv2 image = cv2.imread("3.jpg") height = image.shape[0] width = image.shape[1] sobelResult = np.zeros([height - 2, width - 2, 1]).astype(np.float32) sobelX = np.zeros([3, 3, 1]).astype(np.float32) sobelY = np.zeros([3, 3, 1]).astype(np.float32) sobelX[0, 0, 0] = -1 sobelX[1, 0, 0] = -2 sobelX[2, 0, 0] = -1 sobelX[0, 2, 0] = 1 sobelX[1, 2, 0] = 2 sobelX[2, 2, 0] = 1 sobelY[0, 0, 0] = -1 sobelY[0, 1, 0] = -2 sobelY[0, 2, 0] = -1 sobelY[2, 0, 0] = 1 sobelY[2, 1, 0] = 2 sobelY[2, 2, 0] = 1 for h in range(0, height - 3): for w in range(0, width - 3): #求方向梯度 imageIncre = image[h:h + 3, w:w + 3] gradientX = np.sum(imageIncre * sobelX) gradientY = np.sum(imageIncre * sobelY) gradient = np.sqrt(gradientX**2 + gradientY**2) sobelResult[h, w, 0] = gradient imageMax = np.max(sobelResult) imageMin = np.min(sobelResult) sobelResult = 255*(sobelResult - imageMin) / (imageMax - imageMin) cv2.imwrite("3.png", sobelResult)- 1
- 2
- 3
- 4
- 5
- 6
- 7
- 8
- 9
- 10
- 11
- 12
- 13
- 14
- 15
- 16
- 17
- 18
- 19
- 20
- 21
- 22
- 23
- 24
- 25
- 26
- 27
- 28
- 29
- 30
- 31
- 32
- 33
- 34
- 35
- 36
- 37
- 38
- 39
- 40
- 41
2、 运行结果如下
-
实验原图

-
实验结果图

五、 实验总结
- 1、 掌握了编写含颜色算子图像处理、Susan与Harris角点图像检测、sobel边缘算子图像检测的程序编写方法。
- 2、 通过实验、对于边缘检测算子与角点检测算子有了进一步的掌握。

-
相关阅读:
Redis 笔记
k8s关于metadata、spec.containers、spec.volumes的属性介绍(yaml格式)
mac环境下搭建frida环境并连接网易mumu模拟器
小程序源码:王者战力查询,游戏扫码登录,王者巅峰信息查询等等支持流量主收益和CPS收益-多玩法安装简单
Lecture 12 Memory Management(内存管理)
Vue实现数据双向绑定代码
【docker 实战】Docker数据卷的清理
【推荐系统中的Hash 2】局部敏感哈希(利用冲突)
Qt的ui文件不能简单复制
可变参数与Collections工具类
- 原文地址:https://blog.csdn.net/m0_47419053/article/details/126904559
