-
opencv [c++] 连通域分析connectedComponentsWithStats() 和 connectedComponents()
1. API相关参数介绍:
labels :对原始图中的每一个像素都打上标签,背景为0,连通域打上1,2,3。。。的标签,同一个连通域的像素打上同样的标签。相当与对每一个像素进行了分类(分割)
- int cv::connectedComponents (
- cv::InputArrayn image, // input 8-bit single-channel (binary)
- cv::OutputArray labels, // output label map
- int connectivity = 8, // 4- or 8-connected components
- int ltype = CV_32S // Output label type (CV_32S or CV_16U)
- );
- int cv::connectedComponentsWithStats (
- cv::InputArrayn image, // input 8-bit single-channel (binary)
- cv::OutputArray labels, // output label map
- cv::OutputArray stats, // Nx5 matrix (CV_32S) of statistics:
- // [x0, y0, width0, height0, area0;
- // ... ; x(N-1), y(N-1), width(N-1),
- // height(N-1), area(N-1)]
- cv::OutputArray centroids, // Nx2 CV_64F matrix of centroids:
- // [ cx0, cy0; ... ; cx(N-1), cy(N-1)]
- int connectivity = 8, // 4- or 8-connected components
- int ltype = CV_32S // Output label type (CV_32S or CV_16U)
- );
参数介绍如下:
image:也就是输入图像,必须是二值图,即8位单通道图像。(因此输入图像必须先进行二值化处理才能被这个函数接受)
connectivity:可选值为4或8,也就是使用4连通还是8连通。
ltype:输出图像标记的类型,目前支持CV_32S 和 CV_16U。 返回值:
返回值:
num_labels:所有连通域的数目
labels:图像上每一像素的标记,用数字1、2、3…表示(不同的数字表示不同的连通域)
stats:每一个标记的统计信息,是一个5列的矩阵,每一行对应每个连通区域的外接矩形的x、y、width、height和面积,示例如下: 0 0 720 720 291805
centroids:连通域的中心点2.设置连通域 connectedComponentsWithStats()
- cv::Mat src_img, img_bool, labels, stats, centroids, img_color, img_gray;
- int main()
- {
- Mat src_img = imread("1.png", 0);
- threshold(src_img, img_bool, 75, 255, THRESH_BINARY);
- //连通域计算
- int n = cv::connectedComponentsWithStats(
- img_bool, //二值图像
- labels, //和原图一样大的标记图
- stats, //nccomps×5的矩阵 表示每个连通区域的外接矩形和面积(pixel)
- centroids //nccomps×2的矩阵 表示每个连通区域的质心
- );
- //显示原图统计结果
- char title[1024];
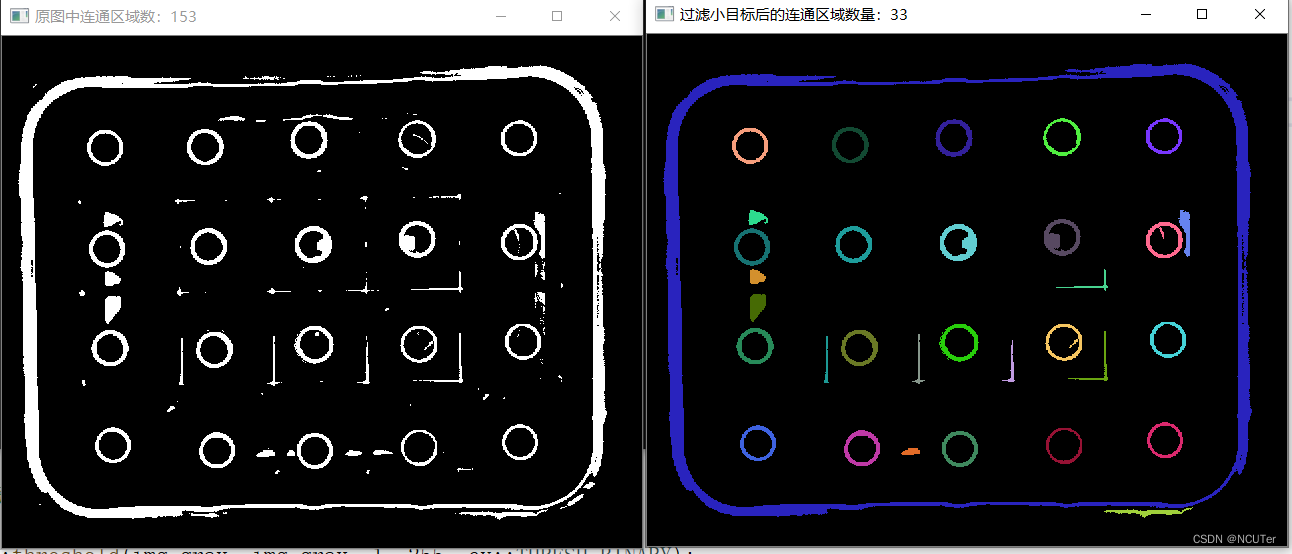
- sprintf_s(title, "原图中连通区域数:%d\n", n);
- cv::String num_connect(title);
- imshow(num_connect, img_bool);
- //去除过小区域,初始化颜色表
- vector<cv::Vec3b> colors(n);
- colors[0] = cv::Vec3b(0, 0, 0); // background pixels remain black.
- for (int i = 1; i < n; i++) {
- colors[i] = cv::Vec3b(rand() % 256, rand() % 256, rand() % 256);
- //去除面积小于100的连通域
- if (stats.at<int>(i, cv::CC_STAT_AREA) < 800)
- colors[i] = cv::Vec3b(0, 0, 0); // small regions are painted with black too.
- }
- //按照label值,对不同的连通域进行着色
- img_color = cv::Mat::zeros(src_img.size(), CV_8UC3);
- for (int y = 0; y < img_color.rows; y++)
- for (int x = 0; x < img_color.cols; x++)
- {
- int label = labels.at<int>(y, x);
- CV_Assert(0 <= label && label <= n);
- img_color.at<cv::Vec3b>(y, x) = colors[label];
- }
- //统计降噪后的连通区域
- cvtColor(img_color, img_gray, cv::COLOR_BGR2GRAY);
- threshold(img_gray, img_gray, 1, 255, cv::THRESH_BINARY);
- n = cv::connectedComponentsWithStats(img_gray, labels, stats, centroids);
- sprintf_s(title, "过滤小目标后的连通区域数量:%d\n", n);
- num_connect = title;
- imshow(num_connect, img_color);
- waitKey(0);
- }
- }
精简版【参考网上资料】:
- #include<opencv2\opencv.hpp>
- #include<algorithm>
- #include<iostream>
- using namespace std;
- using namespace cv;
- Mat src, src_color,g_src, labels, stats, centroids;
- int g_threshold = 30;
- void trackbar(int, void*);
- int main() {
- src = imread("133.png", 0);
- namedWindow("src", 1);
- createTrackbar("threshold", "src", &g_threshold, 255, trackbar);
- imshow("src", src);
- threshold(src, g_src, 170, 255, THRESH_BINARY);
- imshow("d", g_src);
- int num = connectedComponentsWithStats(g_src, labels, stats, centroids);
- cout <<"轮廓数" << num << endl;
- vector<Vec3b> color(num + 1);
- color[0] = Vec3b(0, 0, 0);//背景色
- for (int m = 1; m <=num ; m++) {
- color[m] = Vec3b(rand() % 256, rand() % 256, rand() % 256);
- if (stats.at<int>(m - 1, CC_STAT_AREA) < 100)//连通域面积小于100的区域,将其当作背景
- color[m] = Vec3b(0, 0, 0);
- }
- src_color=Mat::zeros(src.size(), CV_8UC3);
- for (int x = 0; x < src.rows; x++)
- for (int y = 0; y < src.cols; y++)
- {
- int label = labels.at<int>(x, y);//注意labels是int型,不是uchar.
- src_color.at<Vec3b>(x, y) = color[label];
- }
- imshow("labelMap", src_color);
- waitKey(0);
- }
- void trackbar(int, void*) {
- threshold(src, g_src, g_threshold, 255, THRESH_BINARY_INV);
- imshow("d", g_src);
- int num = connectedComponentsWithStats(g_src, labels, stats, centroids);
- cout << "轮廓数" << num << endl;
- vector<Vec3b> color(num + 1);
- color[0] = Vec3b(0, 0, 0);//背景色
- for (int m = 1; m <= num; m++) {
- color[m] = Vec3b(rand() % 256, rand() % 256, rand() % 256);
- //if (stats.at<int>(m - 1, CC_STAT_AREA) < 30)
- //color[m] = Vec3b(0, 0, 0);
- }
- src_color = Mat::zeros(src.size(), CV_8UC3);
- for (int x = 0; x < src.rows; x++)
- for (int y = 0; y < src.cols; y++)
- {
- int label = labels.at<int>(x, y);//注意labels是int型,不是uchar.
- src_color.at<Vec3b>(x, y) = color[label];
- }
- imshow("labelMap", src_color);
- }
connectedComponents()用的较少,和上述用法大致相同。
-
相关阅读:
人工智能应该怎么学?
GB28181学习(十三)——订阅与通知
Pyinstaller打包EXE时添加版本信息、作者信息并在运行时读取外部配置文件
RediSearch的简单使用与总结
flatten-maven-plugin使用
从0基础到车载测试工程师,薪资11K,肯拼搏的人,总会有所收获
Neo4j 5的自治图数据库集群
Linux网络命令使用简单说明
【JVM】运行时数据区之方法区——自问自答
FFmpeg开发笔记(十八)FFmpeg兼容各种音频格式的播放
- 原文地址:https://blog.csdn.net/weixin_50016546/article/details/125435749