-
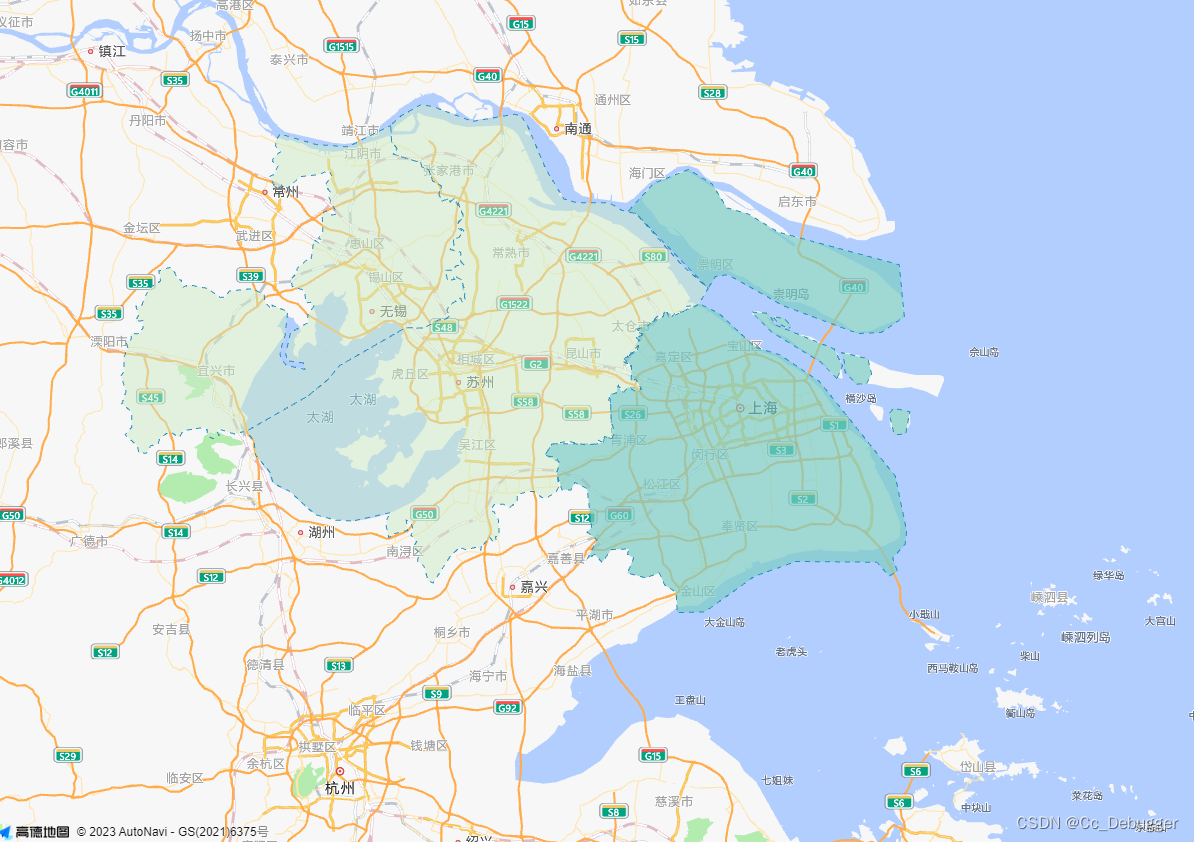
【高德地图】根据经纬度多边形的绘制(可绘制区域以及任意图形)
官方示例
https://lbs.amap.com/demo/jsapi-v2/example/overlayers/polygon-draw
doctype html> <html> <head> <meta charset="utf-8"> <meta http-equiv="X-UA-Compatible" content="IE=edge"> <meta name="viewport" content="initial-scale=1.0, user-scalable=no, width=device-width"> <style> html, body, #container { width: 100%; height: 100%; } style> <title>多边形的绘制和编辑title> <link rel="stylesheet" href="https://a.amap.com/jsapi_demos/static/demo-center/css/demo-center.css" /> <script src="https://a.amap.com/jsapi_demos/static/geojson/shanghai.js">script> <script src="https://webapi.amap.com/maps?v=2.0&key=您申请的key值">script> <script src="https://a.amap.com/jsapi_demos/static/demo-center/js/demoutils.js">script> head> <body> <div id="container">div> <script type="text/javascript"> var map = new AMap.Map("container", { center: [121.045332, 31.19884], zoom: 8.8 }); function addPolygon(data) { let polygon = new AMap.Polygon({ path: data, fillColor: '#ccebc5', strokeOpacity: 1, fillOpacity: 0.5, strokeColor: '#2b8cbe', strokeWeight: 1, strokeStyle: 'dashed', strokeDasharray: [5, 5], }); polygon.on('mouseover', () => { polygon.setOptions({ fillOpacity: 0.7, fillColor: '#7bccc4' }) }) polygon.on('mouseout', () => { polygon.setOptions({ fillOpacity: 0.5, fillColor: '#ccebc5' }) }) map.add(polygon); } addPolygon(shanghai); addPolygon(suzhou); addPolygon(wuxi); script> body> html>- 1
- 2
- 3
- 4
- 5
- 6
- 7
- 8
- 9
- 10
- 11
- 12
- 13
- 14
- 15
- 16
- 17
- 18
- 19
- 20
- 21
- 22
- 23
- 24
- 25
- 26
- 27
- 28
- 29
- 30
- 31
- 32
- 33
- 34
- 35
- 36
- 37
- 38
- 39
- 40
- 41
- 42
- 43
- 44
- 45
- 46
- 47
- 48
- 49
- 50
- 51
- 52
- 53
- 54
- 55
- 56
- 57
- 58
- 59
- 60
function addPolygon(data) { let polygon = new AMap.Polygon({ path: data, // 内部填充样式 fillColor: '#0B5783', strokeOpacity: 1, fillOpacity: 0.5, // 线 strokeColor: '#69B9DF', strokeWeight: 3, strokeStyle: 'solid', strokeDasharray: [5, 5], }); window.map.add(polygon); } addPolygon(polyList); // polyList需要绘制的经纬度集合坐标- 1
- 2
- 3
- 4
- 5
- 6
- 7
- 8
- 9
- 10
- 11
- 12
- 13
- 14
- 15
- 16
- 17
-
相关阅读:
AE-如何让一副静止的画变成动态图
Vue路由(vue-router)
java Random()获取指定范围内随机数
25.10 MySQL 约束
vscode 使用ES6调试js
62. 不同路径-动态规划-双百代码
谷粒学苑_第六天
【无标题】
【超分】A Benchmark for Chinese-English Scene Text Image Super-resolution
第十九章Java绘图
- 原文地址:https://blog.csdn.net/Xiang_Gong_Ya_/article/details/132775837
