-
SpringBoot——指标监控,自定义指标监控
为什么要进行指标监控?
在微服务架构中多个组件部署以后,我们需要能够监控到每个组件的健康情况,因此SpringBoot抽取了Actuator用于监控组件。
1.Java自带的监控工具(不推荐)
步骤: win+r输入cmd 回车 进入命令提示符窗口 输入 jconsole 进入Java提供的监控平台
选择启动的项目 -->连接
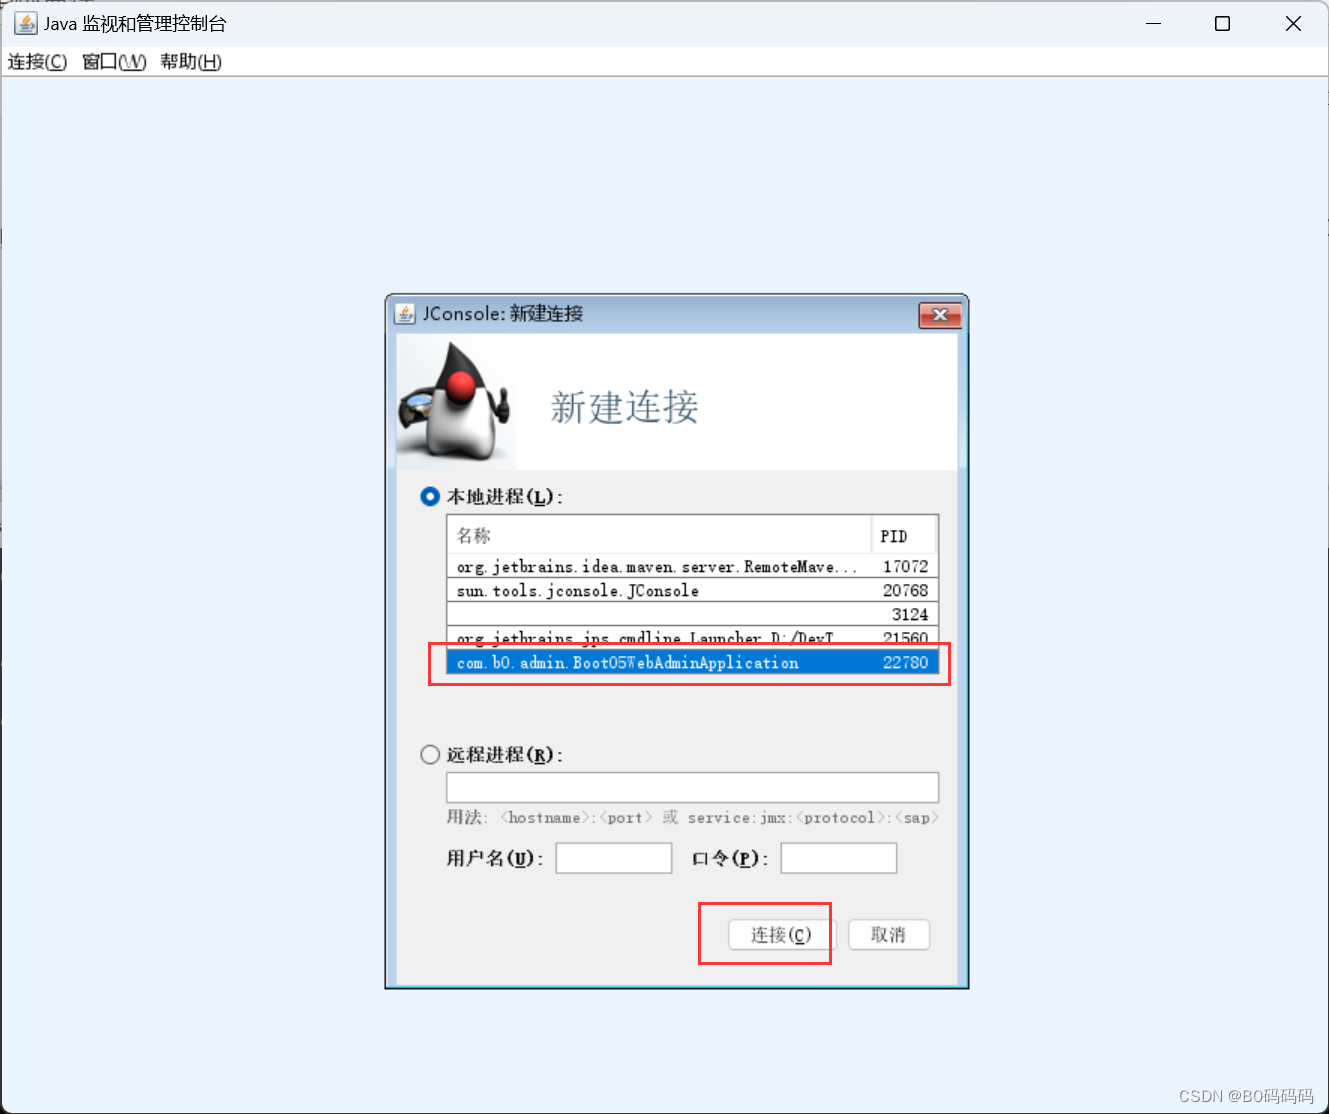
若出现该界面 选择 不安全的连接

查看程序相关性能参数

2.使用SpringBoot提供的Actuator使用(推荐)
2.1 引入依赖
<dependency> <groupId>org.springframework.bootgroupId> <artifactId>spring-boot-starter-actuatorartifactId> dependency>- 1
- 2
- 3
- 4
- 5
2.2 yml配置文件
management: endpoints: enabled-by-default: false # 默认开启所有监控端点 web: exposure: include: '*' # 以web方式暴露所有端点 endpoint: health: show-details: always #总是显示详细信息 enabled: true info: enabled: true beans: enabled: true metrics: enabled: true- 1
- 2
- 3
- 4
- 5
- 6
- 7
- 8
- 9
- 10
- 11
- 12
- 13
- 14
- 15
- 16
2.3 浏览器访问Actuator
http://localhost:8080/actuator
查看组件监控(笔者此处安装了json格式化插件,读者需要自行百度配置)

若需要查看其他监控直接访问其中href指向地址即可
eg:http://localhost:8080/actuator/metrics

3.自定义健康指标
3.1定制健康监控
在日常监控中除了actuator自带监控的信息外,我们还需要自定义监控其他信息如何实现?定制健康健康。编写类自定义模拟监控mongodb健康
@Component//将组件放到容器中 public class MyComHealthIndicator extends AbstractHealthIndicator { /** * 真实的检查方法 * @param builder * @throws Exception */ @Override protected void doHealthCheck(Health.Builder builder) throws Exception { //mongodb 获取链接测试 Map<String,Object> map = new HashMap<>(); if (1 == 1){//模拟成功 // builder.up(); builder.status(Status.UP);//返回健康信息 map.put("count",1);//假如此处监控mangodb查询了几行数据 map.put("ms",100);//模拟耗费了多少毫秒 }else { // builder.down(); builder.status(Status.OUT_OF_SERVICE); map.put("err","连接超时"); map.put("ms",3000); } builder.withDetail("code",100) .withDetails(map);//模拟状态码 } }- 1
- 2
- 3
- 4
- 5
- 6
- 7
- 8
- 9
- 10
- 11
- 12
- 13
- 14
- 15
- 16
- 17
- 18
- 19
- 20
- 21
- 22
- 23
- 24
- 25
- 26
- 27
运行程序查看健康监控
eg访问:http://localhost:8080/actuator/health

4.自定义info信息指标
4.1 方式一:自定义info信息
yml配置文件编写info信息 并 开启info的env功能
info: env: enabled: true info: appName: boot-admin appVersion: 1.0.0 mavenProjectName: @project.artifactId@ #使用@@可以获取maven的pom文件值 mavenProjectVersion: @project.version@- 1
- 2
- 3
- 4
- 5
- 6
- 7
- 8
网页访问:http://localhost:8080/actuator/info

4.2 方式二:定制info信息
@Component public class AppAdminInfoContributor implements InfoContributor { @Override public void contribute(Info.Builder builder) { builder.withDetail("msg","你好") .withDetails(Collections.singletonMap("key", "value")); } }- 1
- 2
- 3
- 4
- 5
- 6
- 7
- 8
结果

5.自定义Metrics信息指标
在需要被监听的类中编写业务逻辑,实现saveUser方法调用一次进行一次计数
编写重载Java类加入MeterRegistry 参数,内部对该参数进行操作@Service public class UserServiceImpl extends ServiceImpl<UserMapper, User> implements UserService { Counter counter; public UserServiceImpl(MeterRegistry meterRegistry){//该注册中心统计saveUser方法被调用的次数 counter = meterRegistry.counter("userService.saveUser.count");//注册新的指标项 } public void saveUser(){ counter.increment();//该方法每被调用一次就会增加counter值 } }- 1
- 2
- 3
- 4
- 5
- 6
- 7
- 8
- 9
- 10
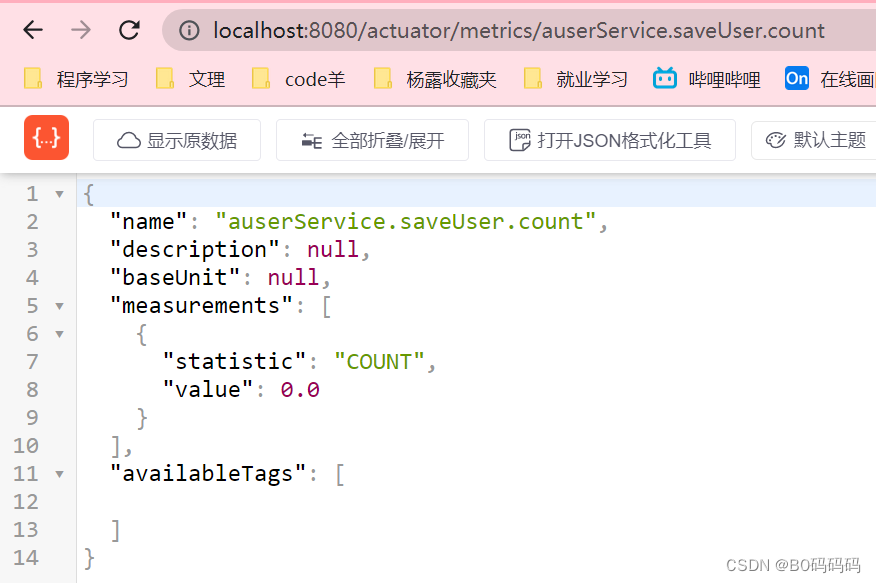
注:下图笔者为了方便截图将自定义metric名字前加了一个a

进入访问:http://localhost:8080/actuator/metrics/auserService.saveUser.count查看我们定义的count参数和值
6.自定义 定制端点(完整的EndPoint)
需求:现在我们需要在项目中引入docker操作的相关端点,如何配置监控?
编写Java类@Component @Endpoint(id = "container")//自定义端点名 public class DockerEndpoint { @ReadOperation//标注此处为一个端点的读操作 public Map getDockerInfo(){//此方法等价为一个属性,不能传参 return Collections.singletonMap("info","docker started..."); } @WriteOperation//标注此端点为一个写操作 private void stopDocker(){ System.out.println("docker stop...."); } }- 1
- 2
- 3
- 4
- 5
- 6
- 7
- 8
- 9
- 10
- 11
- 12
访问端点地址:http://localhost:8080/actuator

查看到我们自定义的端点
进入端点查看详细信息:http://localhost:8080/actuator/container

7.使用开源项目可视化指标监控
官方文档:https://codecentric.github.io/spring-boot-admin/2.5.1/#getting-started
7.1 搭建可视化监控项目
新建项目boot-05-adminserver

勾选spring web
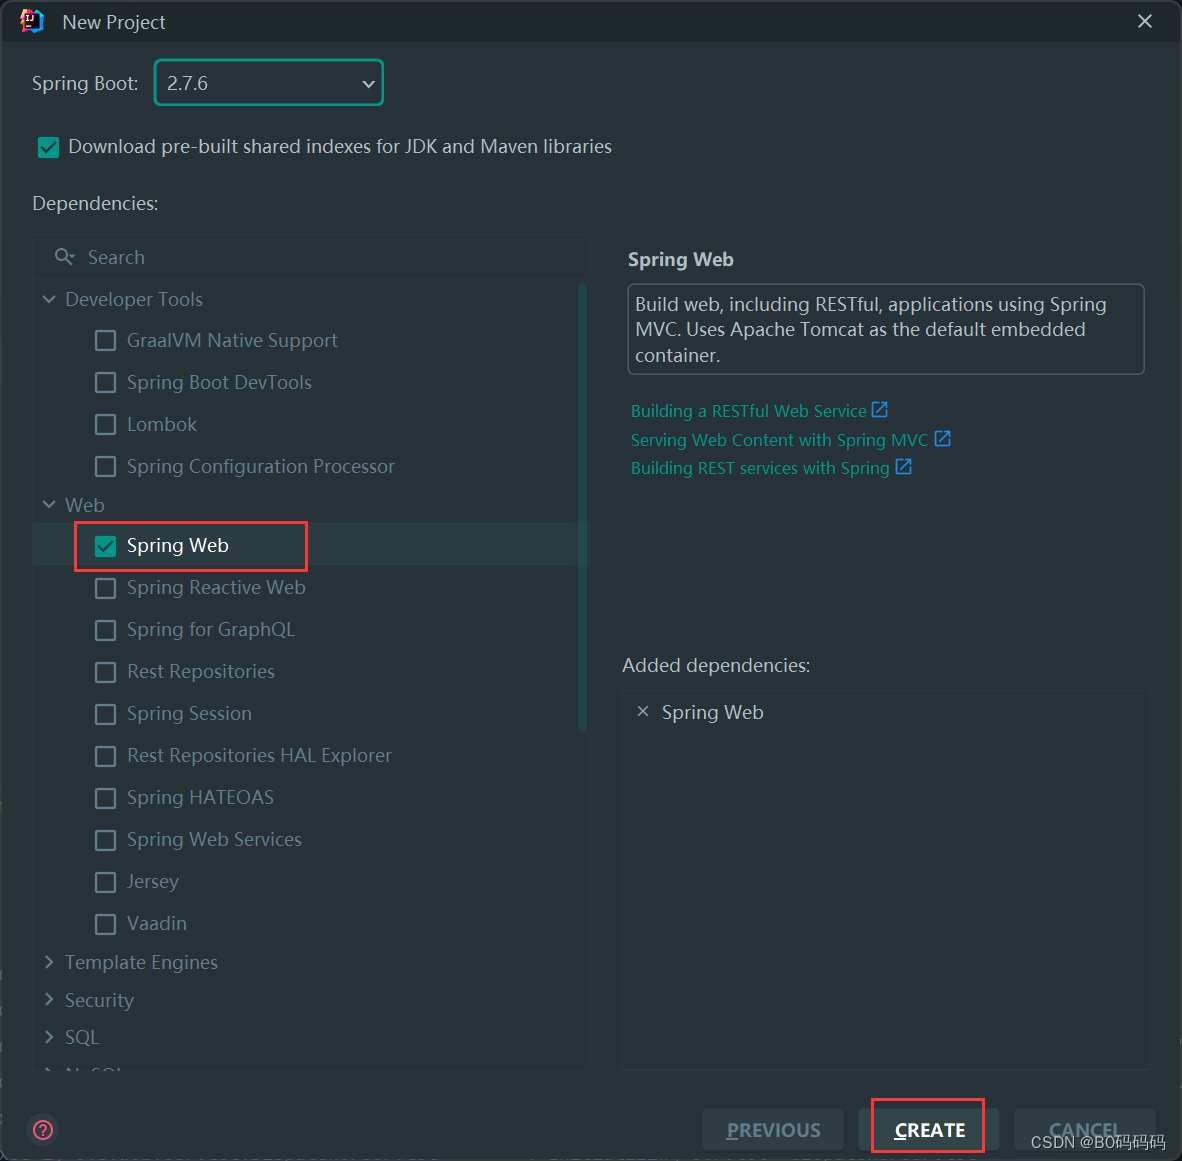
引入依赖<dependency> <groupId>de.codecentric</groupId> <artifactId>spring-boot-admin-starter-server</artifactId> <version>2.5.1</version> </dependency>- 1
- 2
- 3
- 4
- 5
主配置中加入注解@EnableAdminServer开启服务监控功能
@EnableAdminServer @SpringBootApplication public class Boot05AdminserverApplication { public static void main(String[] args) { SpringApplication.run(Boot05AdminserverApplication.class, args); } }- 1
- 2
- 3
- 4
- 5
- 6
- 7
配置文件中修改端口防止与其他项目冲突
server.port=8888- 1
运行项目可以查看可视化监控界面

7.2 将需要监控的应用配置给可视化监控程序
在需要被监控的boot-05-web-admin应用程序中引入依赖

引入依赖<dependency> <groupId>de.codecentricgroupId> <artifactId>spring-boot-admin-starter-clientartifactId> <version>2.5.1version> dependency>- 1
- 2
- 3
- 4
- 5
配置文件中配置可视化监控程序地址+端口号
spring: boot: admin: client: url: http://localhost:8888 spring: application: name: boot-05-web-admin # 给程序命名- 1
- 2
- 3
- 4
- 5
- 6
- 7
- 8
查看可视化监控程序
-
相关阅读:
Nginx显示failed (13: Permission denied)
【已解决】chrome视频无法自动播放的问题
fslutils使用介绍
Java使用HttpClient实现远程服务调用
基于时延估计的扰动卡尔曼滤波器外力估计
Facebook 已删除 276.7 亿虚假账户,大量真实用户被“误伤”
Spring MVC源码详解
知识蒸馏-【初识】
SCI论文写作(二) | SCI论文的引言(Introduction)部分
JSR 303 以及 拦截器
- 原文地址:https://blog.csdn.net/G_change_/article/details/128040259
