-
Prometheus监控MySQL & Grafana部署
目录
一、监控远程MySQL
在被管理机 agent上安装 mysqld_exporter 组件
下载地址:
https://prometheus.io/download/1.上传mysqld_exporter到opt目录下,解压
- tar zxf mysqld_exporter-0.12.1.linux-amd64.tar.gz
- mv mysqld_exporter-0.12.1.linux-amd64 /usr/local/mysqld_exporter

2.进入到mysql数据库,进行授权
为了方便MySQL数据库已经安装,我们直接进入数据库授权即可
- 进入到数据库
- create user 'exporter'@'%' identified by '123456';
- grant process,replication client,select on *.* to 'exporter'@'%' identified by '123456';
- flush privileges;

3.为mysqld_exporter创建个配置文件
- vim /usr/local/mysqld_exporter/mysqld_exporter.cnf
- [client]
-
- user=exporter
-
- password=123456

4.启动组件
./mysqld_exporter --config.my-cnf=/usr/local/mysqld_exporter/mysqld_exporter.cnf
5.浏览器访问一下默认端口9104
http://192.168.131.20:9104/metrics
这样就启动成功了
6.修改prometheus服务器的配置文件
回到 Prometheus 服务器的配置文件里添加被监控的 mysql 的配置段
- vim prometheus.yml
- - job_name: 'node_mysql'
- static_configs:
- - targets: ['192.168.131.20:9104']

重启服务,看一下状态
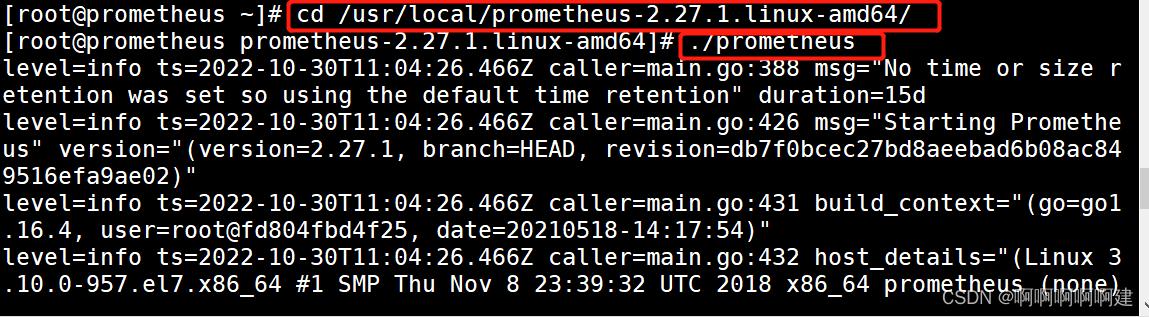
7.访问prometheus服务器

二、部署Grafana进行展示
Grafana 是一个开源的度量分析和可视化工具,可以通过将采集的数据分析,查询,然后进行可视化的展示,并能实现报警
下载地址
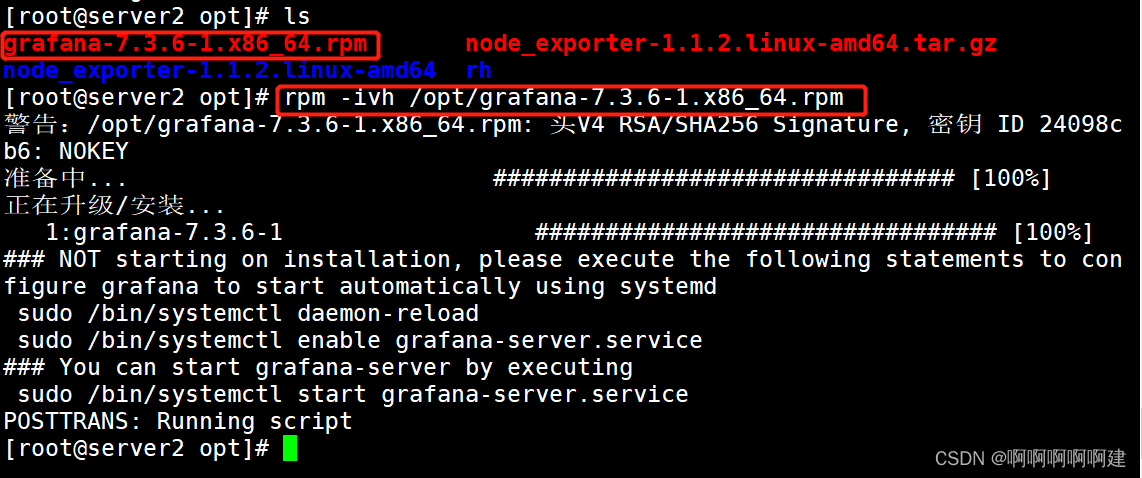
https://grafana.com/grafana/download/1.下载安装Grafana(192.168.131.30)
- rpm -ivh /opt/grafana-7.3.6-1.x86_64.rpm
- systemctl start grafana-server
- systemctl enable grafana-server
- netstat -natp | grep :3000
- 浏览器访问:http://192.168.109.19:3000 ,默认账号和密码为 admin/admin

通过浏览器访问 http:// grafana 服务器 IP:3000 就到了登录界面,使用默认的 admin 用户,admin 密码就可以登陆了

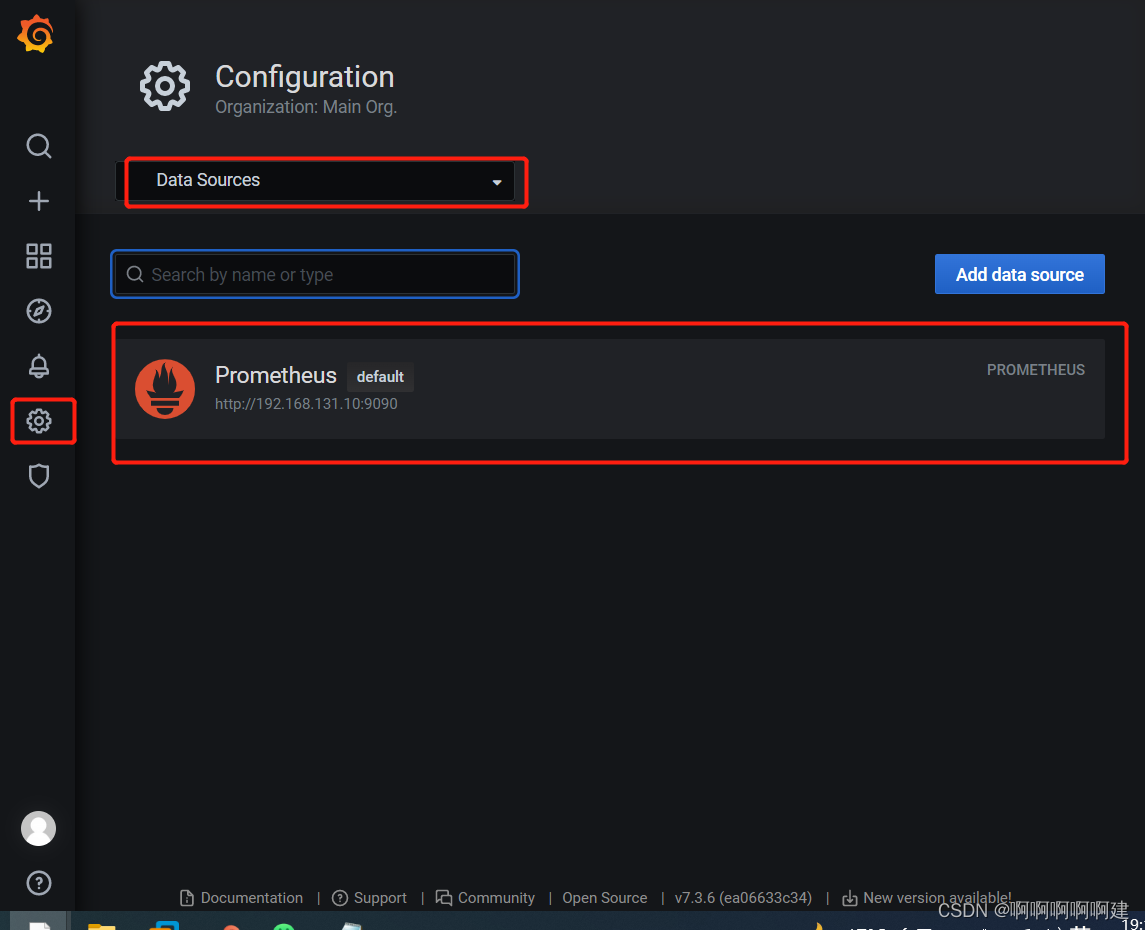
2.配置数据源
下面我们把 Prometheus 服务器收集的数据做为一个数据源添加到 grafana,让 grafana 可以得到 Prometheus 的数据


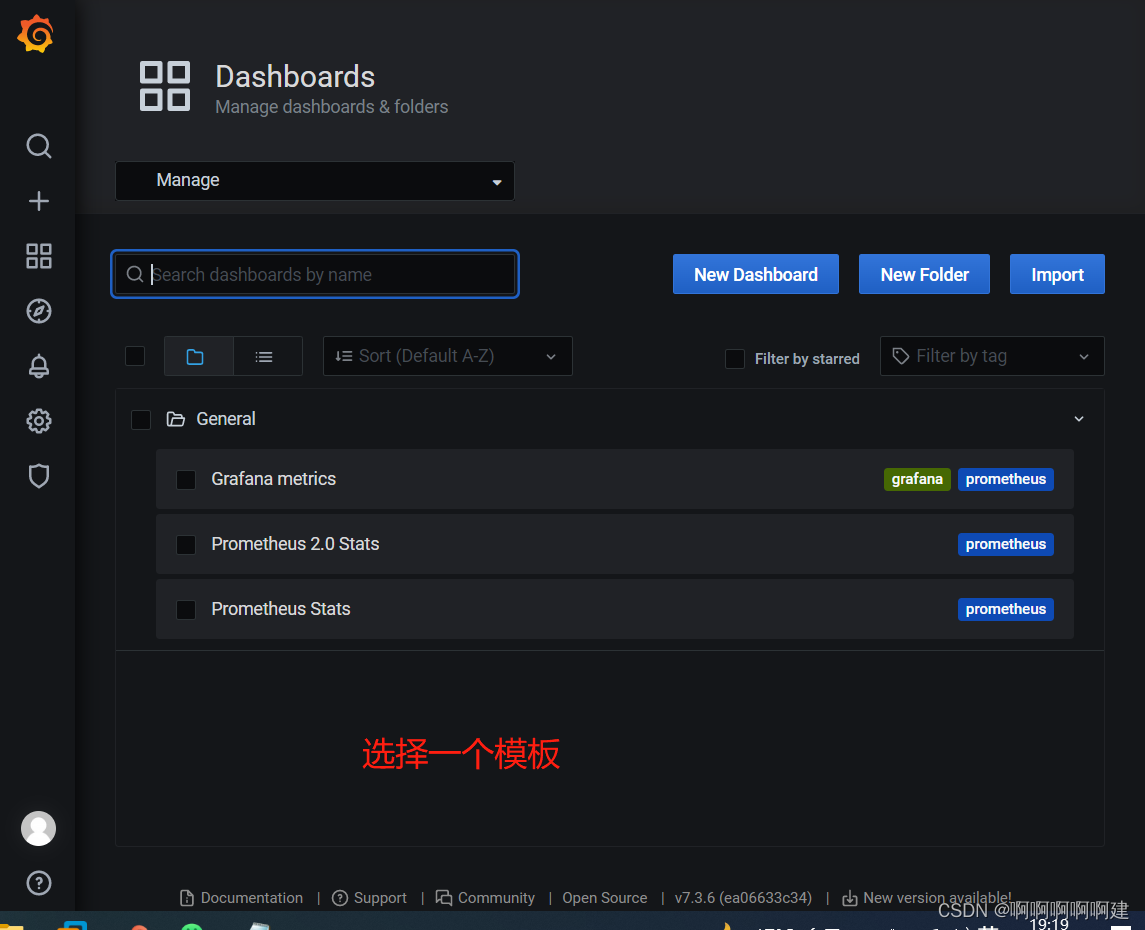
3.导入模板
点击prometheus_data,选择Dashboards


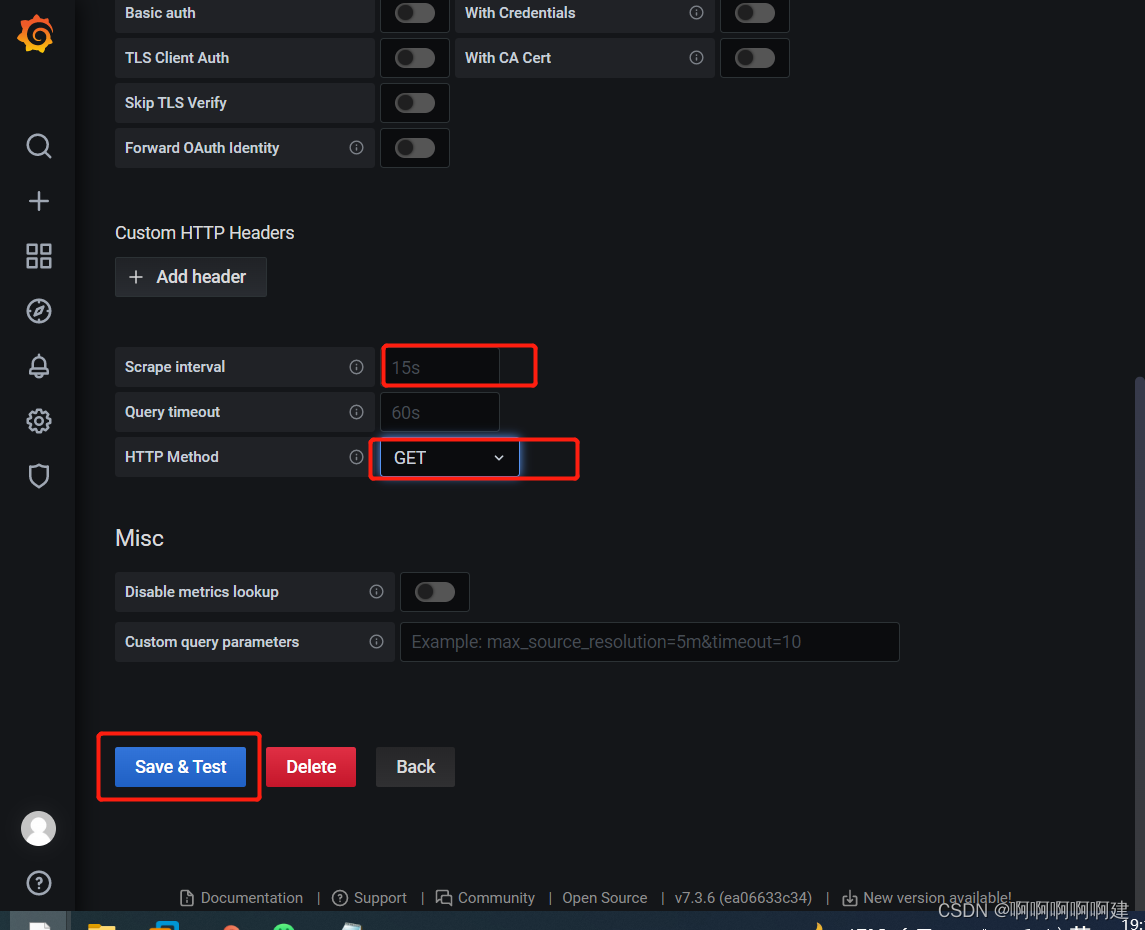
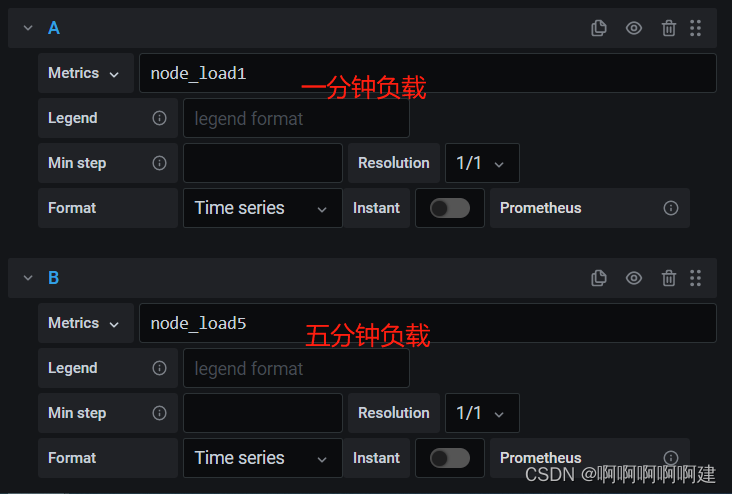
4.为数据源做数据展示
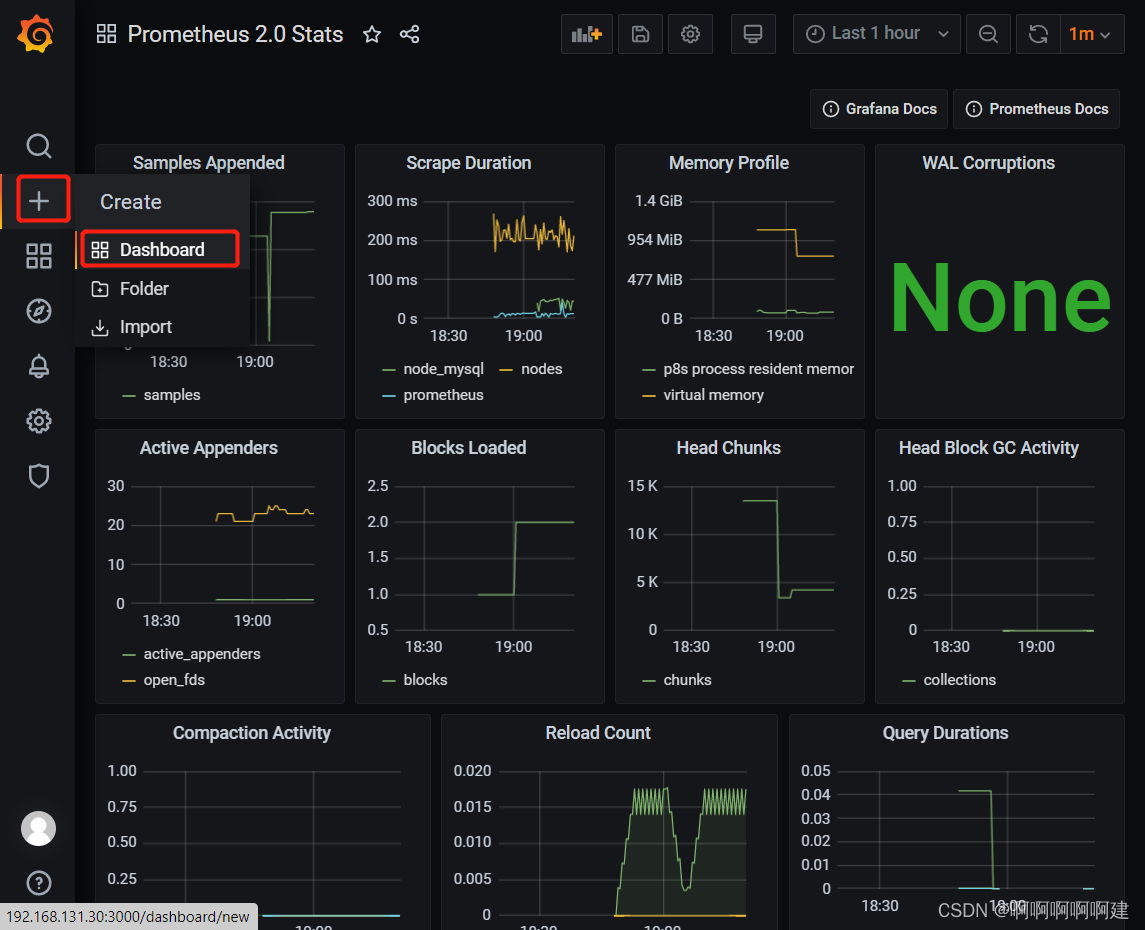


自定义名称,点击保存
最后在dashboard可以查看到
 注:有多条数据的时候,可以在查询的键值后面加个大括号,括号里的条件表示只匹配当前的监控项。
5.导入grafana监控模板
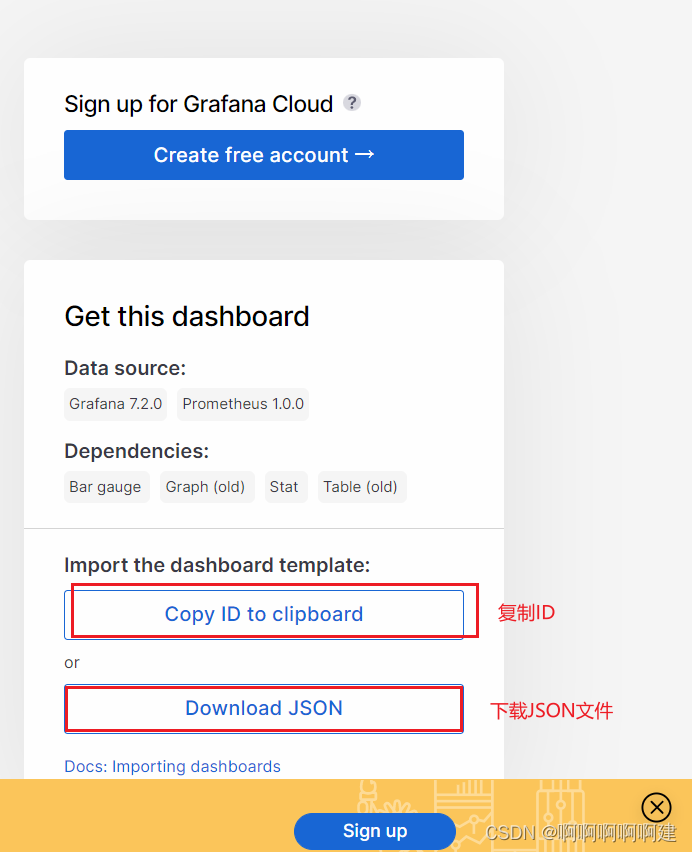
- 浏览器访问:https://grafana.com/grafana/dashboards ,在页面中搜索 node exporter ,选择适合的面板,点击 Copy ID 或者 Download JSON
- 在 grafana 页面中,+ Create -> Import ,输入面板 ID 号或者上传 JSON 文件,点击 Load,即可导入监控面板


6.Grafana图形显示MySQL监控数据
在 grafana 上修改配置文件,并下载安装 mysql 监控的 dashboard(包含相关 json 文件,这些 json 文件可以看作是开发人员开发的一个监控模板)


在grafana图形化界面导入相关的json文件
用grafana服务器上的firefox浏览器打开,方便上传,模板这里选择7362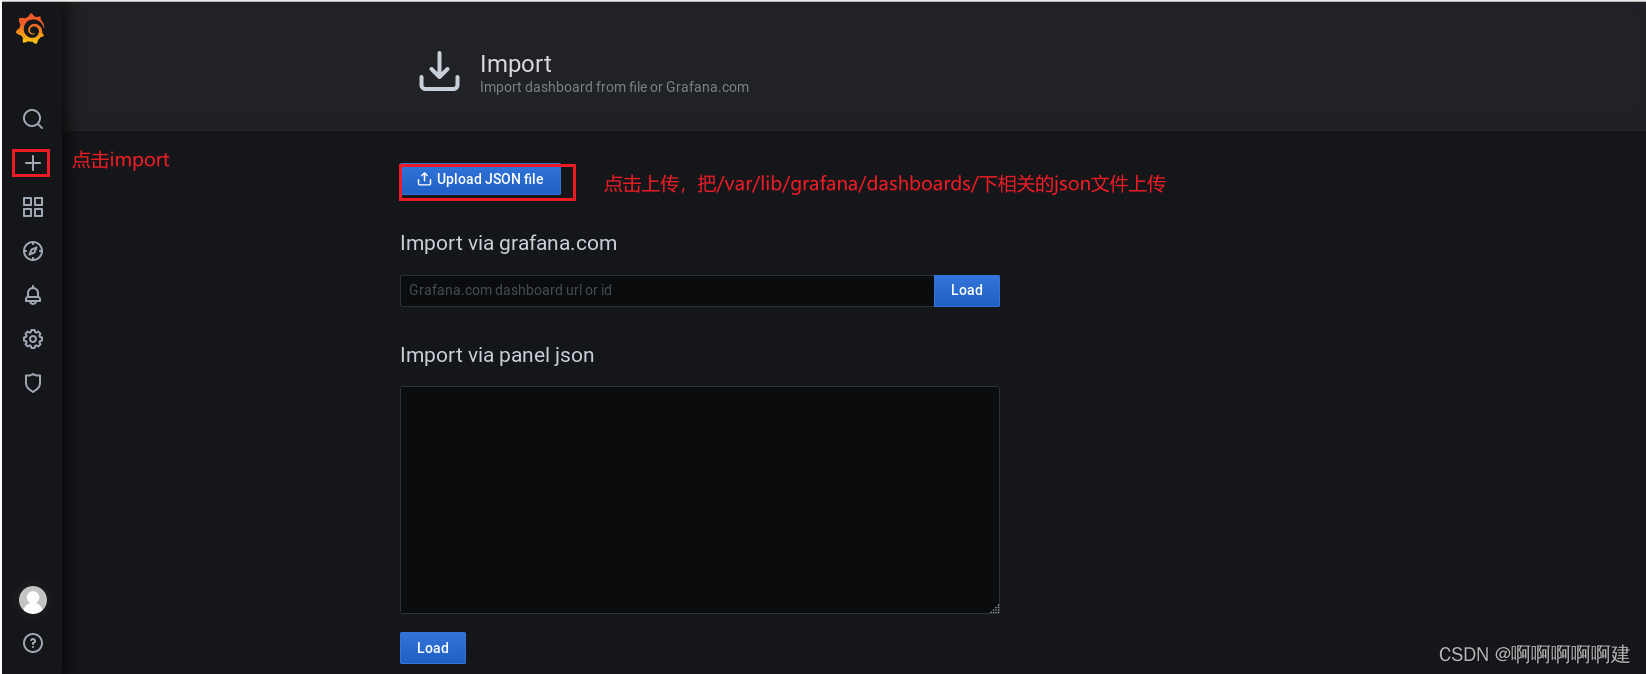
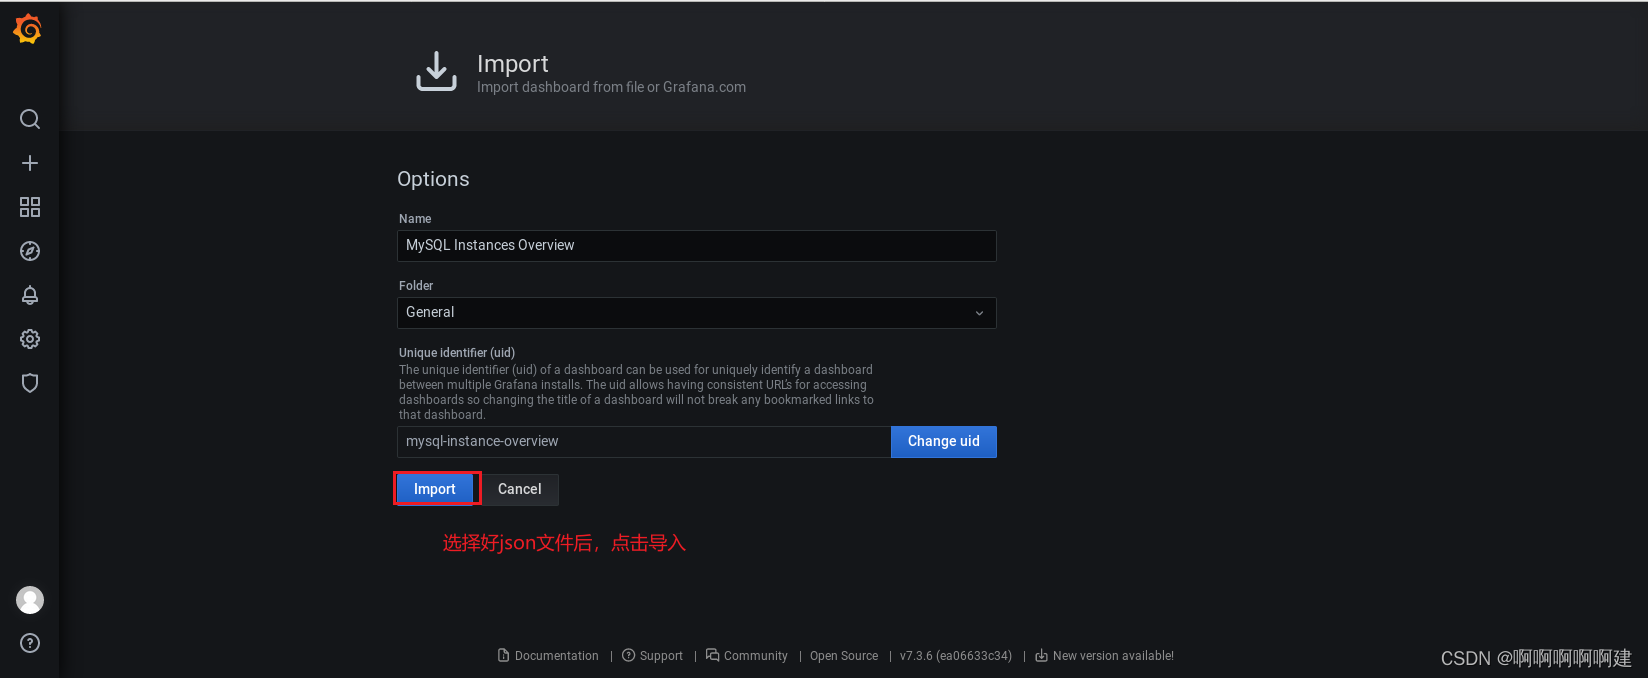

这里我们添加了一个新的模板,ID号为7362

-
相关阅读:
【MySQL】函数
从老王三角到忍狠美三字诀
Linux 最大可以打开多少文件描述符?
Python 全栈系列209 so_pack
讲透计算机网络知识(实战篇)01——计算机网络和协议
基于jsp+mysql+ssm学生网上请假系统-计算机毕业设计
vs(visual stuiod)中vc++工程的Filter和Folder及vcxproj知识
12月3日:thinkphp模型与数据库相同的部分
MySql主从复制
强制删除文件?正确操作方法分享!
- 原文地址:https://blog.csdn.net/m0_66900908/article/details/127600611