-
echarts进阶配置
echarts进阶配置
1.配置
1.单option配置多个图表,并在一个图表绘制多条曲线
只需要在series设置多条数据线,然后其xAxisIndex、yAxisIndex对应同一个表即可。
{ xAxisIndex: 3, yAxisIndex: 3, name: "读count", type: "line", radius: "55%", center: ["50%", "60%"], data: ans_2[3][0], emphasis: { itemStyle: { shadowBlur: 10, shadowOffsetX: 0, shadowColor: "rgba(0, 0, 0, 0.5)", }, }, }, { xAxisIndex: 3, yAxisIndex: 3, name: "写count", type: "line", radius: "55%", center: ["50%", "60%"], data: ans_2[3][1], emphasis: { itemStyle: { shadowBlur: 10, shadowOffsetX: 0, shadowColor: "rgba(0, 0, 0, 0.5)", }, }, },- 1
- 2
- 3
- 4
- 5
- 6
- 7
- 8
- 9
- 10
- 11
- 12
- 13
- 14
- 15
- 16
- 17
- 18
- 19
- 20
- 21
- 22
- 23
- 24
- 25
- 26
- 27
- 28
- 29
- 30
- 31
- 32
比如上面的配置就是xAxisIndex=yAxisIndex=3。

2.格式化y轴数据
这里我采用的方法是预处理,事实上是option有对应的formatter接口,但是series 和x轴数据得对应这个问题有点折磨,也就是说series 应该也有对应得formatter 属性,估计就可以。
我这里 预处理是时间戳timestamp 转 日期。
function myformatter(value, index) { if (value) { let date = new Date(value * 1000); // 时间戳为秒:10位数 //let date = new Date(value) // 时间戳为毫秒:13位数 let year = date.getFullYear(); let month = date.getMonth() + 1 < 10 ? `0${date.getMonth() + 1}` : date.getMonth() + 1; let day = date.getDate() < 10 ? `0${date.getDate()}` : date.getDate(); let hour = date.getHours() < 10 ? `0${date.getHours()}` : date.getHours(); let minute = date.getMinutes() < 10 ? `0${date.getMinutes()}` : date.getMinutes(); let second = date.getSeconds() < 10 ? `0${date.getSeconds()}` : date.getSeconds(); return `${hour}:${minute}:${second}`; //return `${year}-${month}-${day} ${hour}:${minute}:${second}`; } else { return ""; } }- 1
- 2
- 3
- 4
- 5
- 6
- 7
- 8
- 9
- 10
- 11
- 12
- 13
- 14
- 15
- 16
- 17
- 18
- 19
- 20
- 21
- 22
3.异步接收数据
引入onMounted钩子函数,然后再利用异步调用接口 接收数据,然后原生dom找到图表元素,定义option,然后setoption即可。
let obj = await getData(props.id); var myChart = echarts.init(document.getElementById("chart")); //dom操作元素 let option = reactive({.......}); //用到obj的数据 myChart.setOption(option); //设置option- 1
- 2
- 3
- 4
4.一个option设置多个图,按照grid分布。
grid: [ { left: "10%", top: "3%", width: "90%", height: "15%" }, { left: "10%", top: "25%", width: "90%", height: "15%" }, { left: "10%", y: "47%", width: "90%", height: "15%" }, { left: "10%", y: "69%", width: "90%", height: "15%" }, ],- 1
- 2
- 3
- 4
- 5
- 6
上图就是4行一列的分布,let,top 是图距离容器左 和 上测的距离。width和height是图表的宽和高。
5.设置toolbox(工具箱)
toolbox: { show: true, feature: { // dataZoom: { //缩放 // yAxisIndex: "none" // }, dataView: { //数据视图 title: "数据视图", lang: ["数据视图", "关闭", "刷新"], readOnly: false, }, // magicType: { //图表类型转换 // type: ["line", "bar"] // }, // restore: {}, saveAsImage: { //保存图片 title: "保存为图片", }, }, },- 1
- 2
- 3
- 4
- 5
- 6
- 7
- 8
- 9
- 10
- 11
- 12
- 13
- 14
- 15
- 16
- 17
- 18
- 19
- 20
注意option里要对应多个配置,则用数组的形式。
比如toolbox。
toolbox:[ { show: true, feature: { ..... }, }, { show: true, feature: { ..... }, }, ]- 1
- 2
- 3
- 4
- 5
- 6
- 7
- 8
- 9
- 10
- 11
- 12
- 13
- 14
6.legend分组设置到多个图
legend: [ //图例组件 // orient: "vertical", // left: "left", { data: ["cpu使用率"], right: "10%", }, { top: "21%", data: ["mem使用率"], right: "10%", }, { top: "43%", data: ["load使用率"], right: "10%", }, { top: "65%", data: ["读Count/s", "写Count/s"], right: "10%", }, ],- 1
- 2
- 3
- 4
- 5
- 6
- 7
- 8
- 9
- 10
- 11
- 12
- 13
- 14
- 15
- 16
- 17
- 18
- 19
- 20
- 21
- 22
- 23
- 24
7.折线图转化为面积图
在series 里添加
areaStyle:{}{ xAxisIndex: 0, yAxisIndex: 0, name: "cpu使用率", type: "line", radius: "55%", center: ["50%", "60%"], data: ans_2[0], emphasis: { itemStyle: { shadowBlur: 10, shadowOffsetX: 0, shadowColor: "rgba(0, 0, 0, 0.5)", }, }, areaStyle: {}, },- 1
- 2
- 3
- 4
- 5
- 6
- 7
- 8
- 9
- 10
- 11
- 12
- 13
- 14
- 15
- 16
- 17
8.y轴刻度格式化
yAxis:{ gridIndex: 0, minInterval: 1, type: "value", axisLabel: { formatter: "{value}%", }, },- 1
- 2
- 3
- 4
- 5
- 6
- 7
- 8

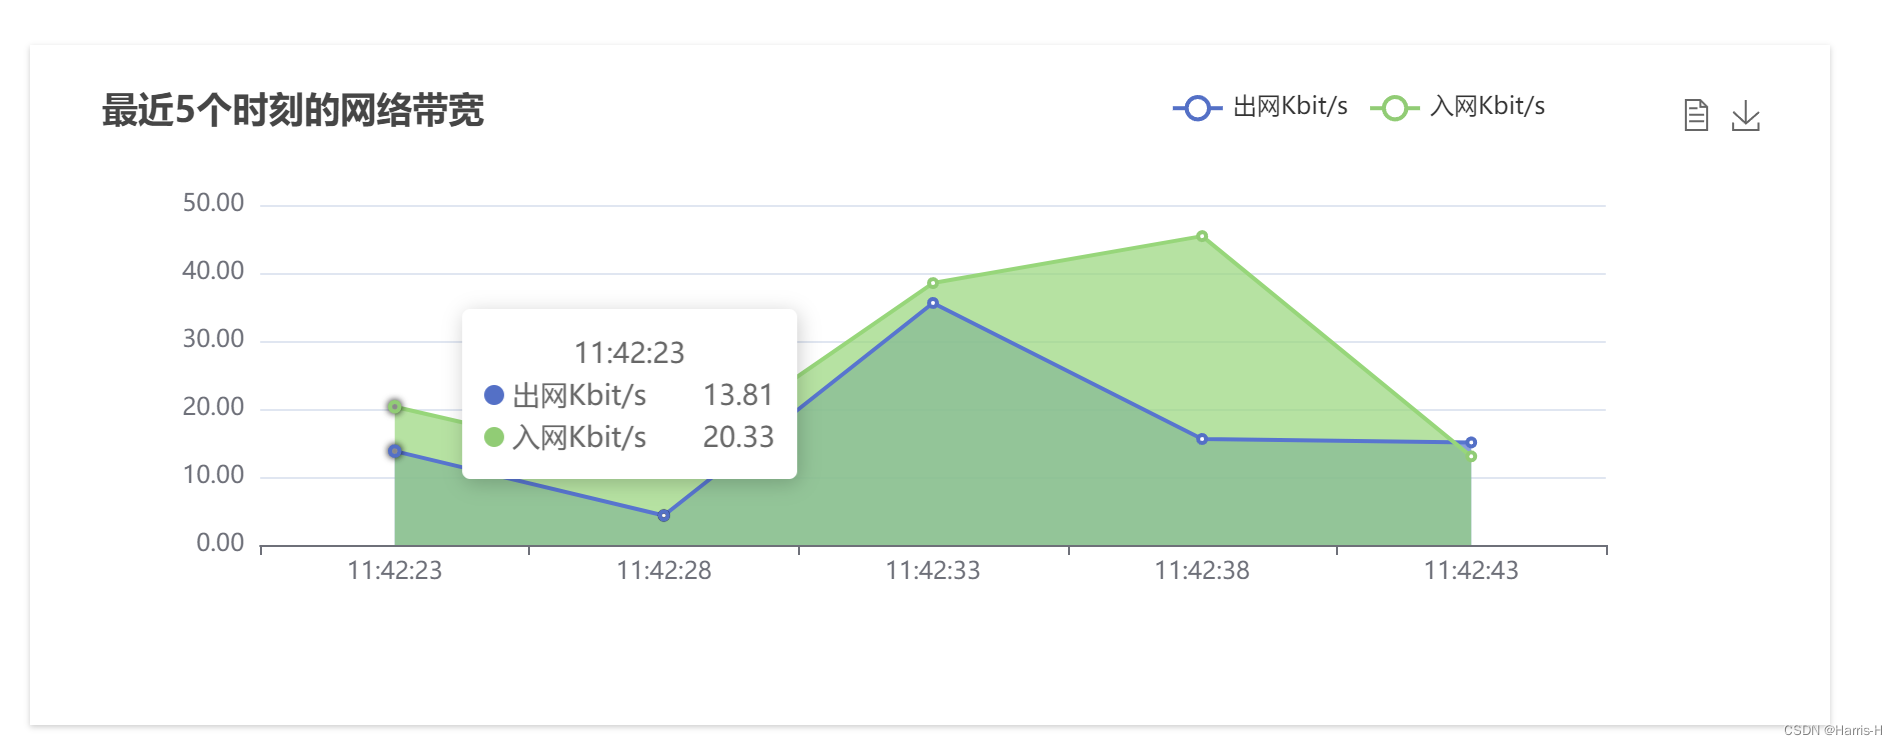
9.tooltip自定义显示数据
采用formatter
tooltip: { //提示框配置 trigger: "axis", //formatter: "{a}
{c}", axisPointer: { type: "cross", }, formatter: function (params) { var res = params[0].name; for (var i = 0; i < params.length; i++) { //console.log(params); res += "
" + params[i].marker + params[i].seriesName + " " + params[i].data[1].toFixed(2); } return res; }, },- 1
- 2
- 3
- 4
- 5
- 6
- 7
- 8
- 9
- 10
- 11
- 12
- 13
- 14
- 15
- 16
- 17
- 18
- 19
- 20
- 21
- 22
结果如下
完整配置
option = reactive({ //由grid控制各个图表,x,y为与左上角顶点的距离,控制各个图表的位置及大小 grid: [ { left: "10%", top: "3%", width: "90%", height: "15%" }, { left: "10%", top: "25%", width: "90%", height: "15%" }, { left: "10%", y: "47%", width: "90%", height: "15%" }, { left: "10%", y: "69%", width: "90%", height: "15%" }, ], title: [ { text: "最近5个时刻的cpu使用率" }, { text: "最近5个时刻的mem使用率", top: "21%" }, { text: "最近5个时刻的load使用率", top: "43%" }, { text: "最近5个时刻的读写次数", top: "65%" }, ], toolbox: [ { show: true, feature: { // dataZoom: { // yAxisIndex: "none" // }, dataView: { title: "数据视图", lang: ["数据视图", "关闭", "刷新"], readOnly: false, }, // magicType: { // type: ["line", "bar"] // }, // restore: {}, saveAsImage: { title: "保存为图片", }, }, }, { show: true, top: "21%", feature: { // dataZoom: { // yAxisIndex: "none" // }, dataView: { title: "数据视图", lang: ["数据视图", "关闭", "刷新"], readOnly: false, }, // magicType: { // type: ["line", "bar"] // }, // restore: {}, saveAsImage: { title: "保存为图片", }, }, }, { top: "43%", show: true, feature: { // dataZoom: { // yAxisIndex: "none" // }, dataView: { title: "数据视图", lang: ["数据视图", "关闭", "刷新"], readOnly: false, }, // magicType: { // type: ["line", "bar"] // }, // restore: {}, saveAsImage: { title: "保存为图片", }, }, }, { top: "65%", show: true, feature: { // dataZoom: { // yAxisIndex: "none" // }, dataView: { title: "数据视图", lang: ["数据视图", "关闭", "刷新"], readOnly: false, }, // magicType: { // type: ["line", "bar"] // }, // restore: {}, saveAsImage: { title: "保存为图片", }, }, }, ], tooltip: [ { //提示框配置 trigger: "axis", //formatter: "{a}
{c}", axisPointer: { type: "cross", }, }, ], legend: [ //图例组件 // orient: "vertical", // left: "left", { data: ["cpu使用率"], right: "10%", }, { top: "21%", data: ["mem使用率"], right: "10%", }, { top: "43%", data: ["load使用率"], right: "10%", }, { top: "65%", data: ["读Count/s", "写Count/s"], right: "10%", }, ], xAxis: [ { gridIndex: 0, data: ans_1[0], }, { gridIndex: 1, data: ans_1[1], }, { gridIndex: 2, data: ans_1[2], }, { gridIndex: 3, data: ans_1[3], }, ], // xAxis: { // type: "category", // data: obj.keys, //keys是x轴 // }, yAxis: [ //minInterval控制最小间隔,不设置的话会有小数,同样由gridIndex绑定各个图表 { gridIndex: 0, minInterval: 1, type: "value" }, { gridIndex: 1, minInterval: 1, type: "value" }, { gridIndex: 2, minInterval: 1, type: "value" }, { gridIndex: 3, minInterval: 1, type: "value" }, ], series: [ //系列选择pie,进行相关数据配置 { xAxisIndex: 0, yAxisIndex: 0, name: "cpu使用率", type: "line", radius: "55%", center: ["50%", "60%"], data: ans_2[0], emphasis: { itemStyle: { shadowBlur: 10, shadowOffsetX: 0, shadowColor: "rgba(0, 0, 0, 0.5)", }, }, areaStyle: {}, }, { xAxisIndex: 1, yAxisIndex: 1, name: "mem使用率", type: "line", radius: "55%", center: ["50%", "60%"], data: ans_2[1], emphasis: { itemStyle: { shadowBlur: 10, shadowOffsetX: 0, shadowColor: "rgba(0, 0, 0, 0.5)", }, }, areaStyle: {}, }, { xAxisIndex: 2, yAxisIndex: 2, name: "load使用率", type: "line", radius: "55%", center: ["50%", "60%"], data: ans_2[2], emphasis: { itemStyle: { shadowBlur: 10, shadowOffsetX: 0, shadowColor: "rgba(0, 0, 0, 0.5)", }, }, areaStyle: {}, }, { xAxisIndex: 3, yAxisIndex: 3, name: "读Count/s", //这里要对应legend的data type: "line", radius: "55%", center: ["50%", "60%"], data: ans_2[3][0], emphasis: { itemStyle: { shadowBlur: 10, shadowOffsetX: 0, shadowColor: "rgba(0, 0, 0, 0.5)", }, }, areaStyle: {}, }, { xAxisIndex: 3, yAxisIndex: 3, name: "写Count/s", type: "line", radius: "55%", center: ["50%", "60%"], data: ans_2[3][1], emphasis: { itemStyle: { shadowBlur: 10, shadowOffsetX: 0, shadowColor: "rgba(0, 0, 0, 0.5)", }, }, areaStyle: {}, }, ], }); myChart.setOption(option); });- 1
- 2
- 3
- 4
- 5
- 6
- 7
- 8
- 9
- 10
- 11
- 12
- 13
- 14
- 15
- 16
- 17
- 18
- 19
- 20
- 21
- 22
- 23
- 24
- 25
- 26
- 27
- 28
- 29
- 30
- 31
- 32
- 33
- 34
- 35
- 36
- 37
- 38
- 39
- 40
- 41
- 42
- 43
- 44
- 45
- 46
- 47
- 48
- 49
- 50
- 51
- 52
- 53
- 54
- 55
- 56
- 57
- 58
- 59
- 60
- 61
- 62
- 63
- 64
- 65
- 66
- 67
- 68
- 69
- 70
- 71
- 72
- 73
- 74
- 75
- 76
- 77
- 78
- 79
- 80
- 81
- 82
- 83
- 84
- 85
- 86
- 87
- 88
- 89
- 90
- 91
- 92
- 93
- 94
- 95
- 96
- 97
- 98
- 99
- 100
- 101
- 102
- 103
- 104
- 105
- 106
- 107
- 108
- 109
- 110
- 111
- 112
- 113
- 114
- 115
- 116
- 117
- 118
- 119
- 120
- 121
- 122
- 123
- 124
- 125
- 126
- 127
- 128
- 129
- 130
- 131
- 132
- 133
- 134
- 135
- 136
- 137
- 138
- 139
- 140
- 141
- 142
- 143
- 144
- 145
- 146
- 147
- 148
- 149
- 150
- 151
- 152
- 153
- 154
- 155
- 156
- 157
- 158
- 159
- 160
- 161
- 162
- 163
- 164
- 165
- 166
- 167
- 168
- 169
- 170
- 171
- 172
- 173
- 174
- 175
- 176
- 177
- 178
- 179
- 180
- 181
- 182
- 183
- 184
- 185
- 186
- 187
- 188
- 189
- 190
- 191
- 192
- 193
- 194
- 195
- 196
- 197
- 198
- 199
- 200
- 201
- 202
- 203
- 204
- 205
- 206
- 207
- 208
- 209
- 210
- 211
- 212
- 213
- 214
- 215
- 216
- 217
- 218
- 219
- 220
- 221
- 222
- 223
- 224
- 225
- 226
- 227
- 228
- 229
- 230
- 231
- 232
- 233
- 234
- 235
- 236
- 237
- 238
- 239
- 240
- 241
- 242
- 243
- 244
- 245
- 246
- 247
- 248
- 249
- 250
- 251
- 252
- 253
- 254
- 255
2.结果

-
相关阅读:
vue3 iconify 图标几种使用 并加载本地 svg 图标
电商系统对接支付渠道的解决方案
程序员如果都懂SpringWebFlux框架的话,也不用天天CRUD了
c++中dns解析
无监督学习
【gogogo专栏】golang并发编程
从零开始学习Dubbo7——Dubbo的高级特性
性能分析插件
OpenAI 最佳平替,使用 Promptulate 增强你的AI能力
ERP系统开发需要多少钱?
- 原文地址:https://blog.csdn.net/weixin_45750972/article/details/127344348
