-
【ML01】Linear Regression with One Variable
(一)概述
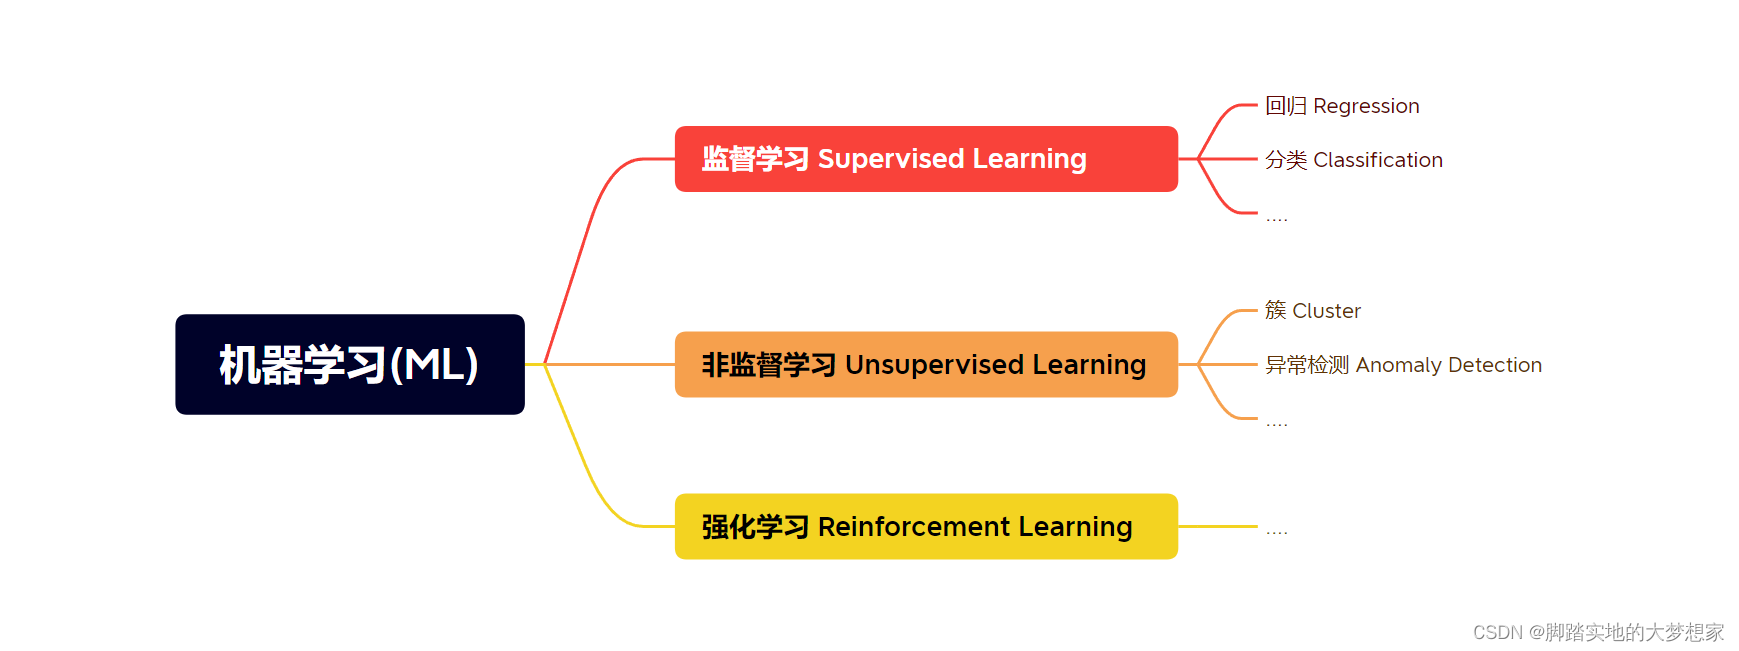
在机器学习中,主要分为 监督学习(Supervised Learning)、非监督学习(Unsupervised Learning) 以及 强化学习(Reinforcement Learning)。而在监督学习中,主要分为两大类,回归(Regression) 以及 分类(Classification) 模型。

线性回归,当然属于 监督学习-回归模型,且为很多解决当下现实问题用到。
思考来看,线性回归问题与方程式类似,原理都为给定带有权重的自变量,根据函数算法计算其预测值。其中核心在于选择合适的算法,即function。
(二)notation
Linear Regression with only one variable:
f w , b ( x ) = w x + b f_{\mathbf{w,b}}(\mathbf{x}) = wx + b fw,b(x)=wx+b
其中:符号 意义 x 自变量 f(x) 因变量/预测值 m 训练集中训练数据的数量 (x, y) (自变量,Label) (x(i), y(i)) 训练集中第i个训练数据
(三)流程 Process

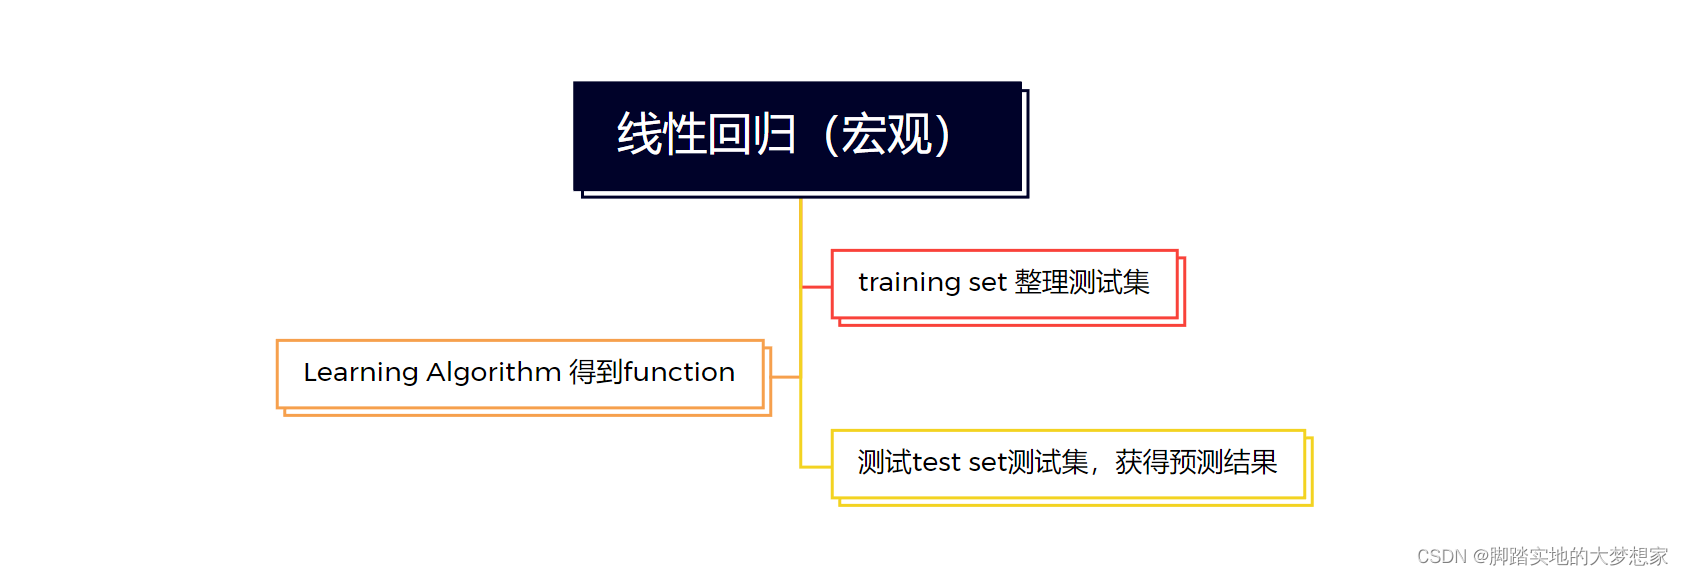
首先,第一步将 数据集(dataset) 分为两个部分,训练集(training set) 以及 测试集(test set)。通常按照 8:2 的方式进行划分,当然训练集占大数;第二步,将训练集带入到线性回归函数中,得到线性回归函数;
第三步,将训练好的回归函数测试测试集中数据,通过输入自变量得到预测值,通过:[实际值-预测值]2 等方式得到 cost function,从而判断回归函数是否符合要求。
(四)python搭建一个最基本的线性回归模型
@@------@@
4.1 问题陈述
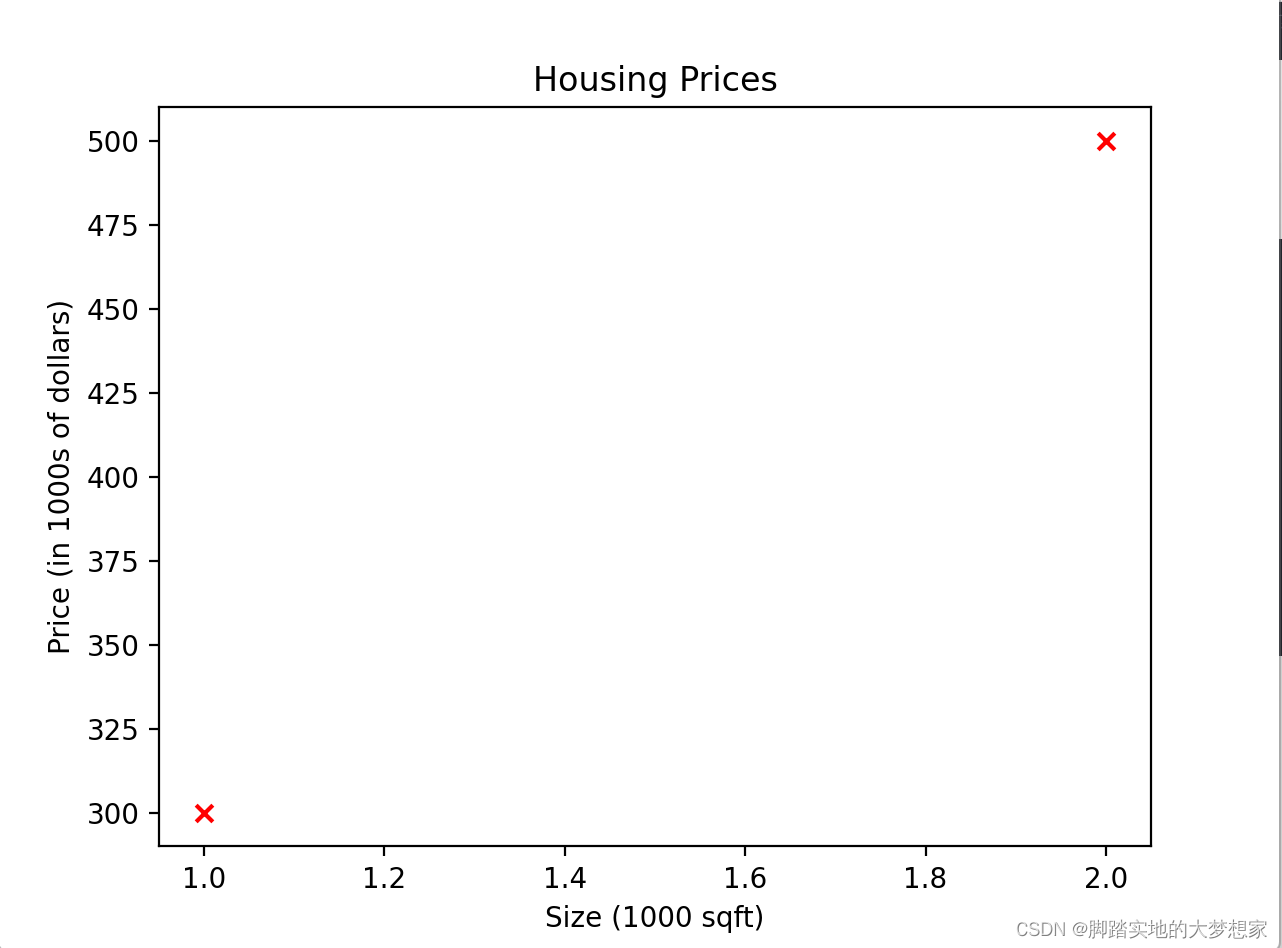
@@------@@通过线性回归函数预测房价,拥有训练集如下:
Size (1000 sqft) Price (1000s of dollars) 1.0 300 2.0 500 @@------------------@@
4.2 numpy建立数据集
@@------------------@@import numpy as np x_train = np.array([1.0, 2.0]) y_train = np.array([300.0, 500.0]) print(f"x_train = {x_train}") # 打印训练集中自变量 print(f"y_train = {y_train}") # 打印训练集中因变量 i = 1 # 打印训练集中第i个自变量因变量 x_i = x_train[i] y_i = y_train[i] print(f"(x^({i}), y^({i})) = ({x_i}, {y_i})") print(f"x_train.shape: {x_train.shape}") # 打印训练集中自变量的数量 print(f"Number of training examples is: {m}") # 打印训练集中因变量的数量 m = len(x_train) print(f"Number of training examples is: {m}") # 打印训练集的长度,换一种方法打印训练集的数量- 1
- 2
- 3
- 4
- 5
- 6
- 7
- 8
- 9
- 10
- 11
- 12
- 13
- 14
- 15
- 16
- 17
@@---------@@
4.3 plt绘制数据
@@---------@@import numpy as np import matplotlib.pyplot as plt x_train = np.array([1.0, 2.0]) y_train = np.array([300.0, 500.0]) # 字面意思,自行理解。 plt.scatter(x_train, y_train, marker='x', c='r') plt.title("Housing Prices") plt.ylabel('Price (in 1000s of dollars)') plt.xlabel('Size (1000 sqft)') plt.show()- 1
- 2
- 3
- 4
- 5
- 6
- 7
- 8
- 9
- 10
- 11
- 12

@@-------------------@@
4.4 结合w,b值绘制函数
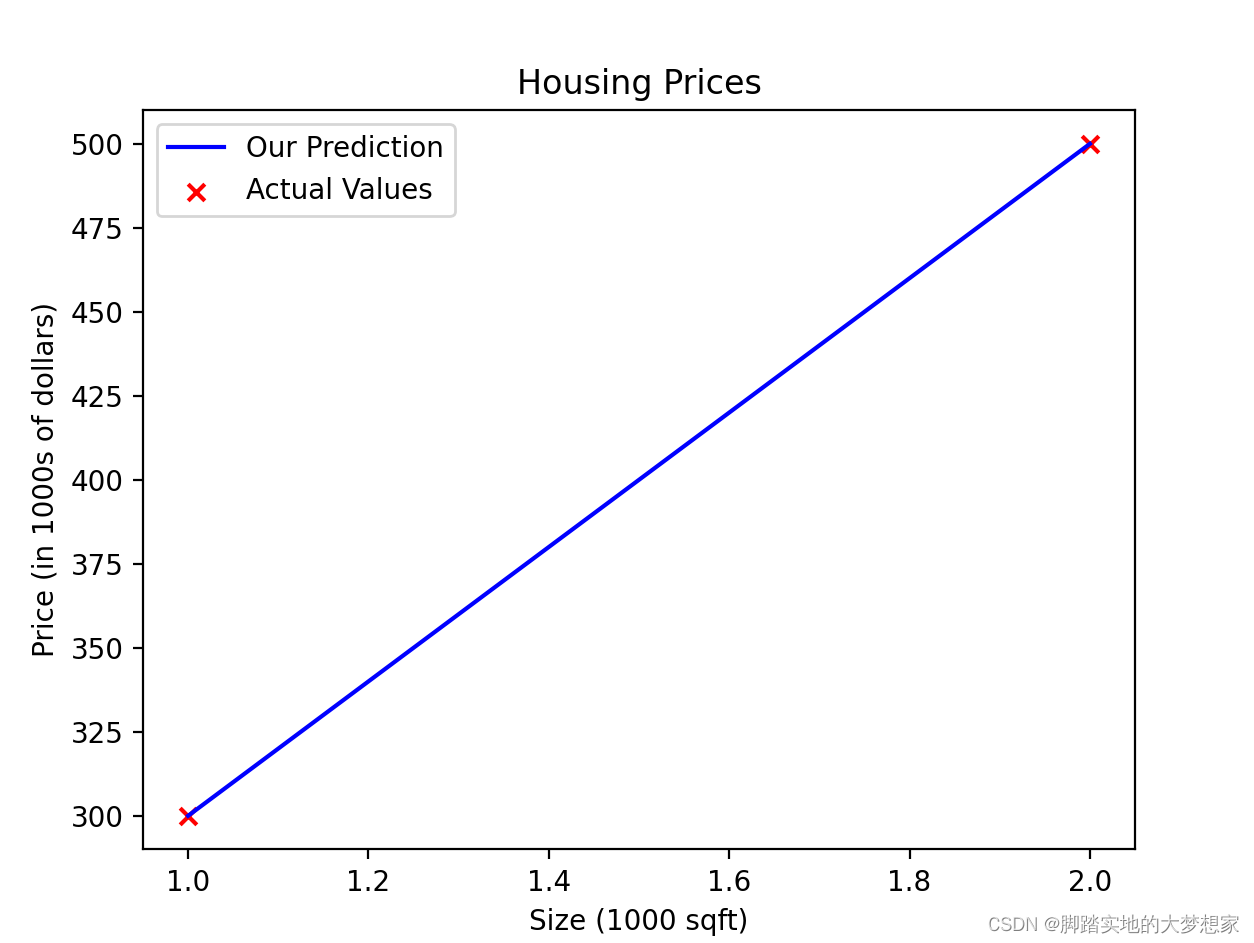
@@-------------------@@Linear Regression Fuction:
f w , b ( x ( i ) ) = w x ( i ) + b (1) f_{w,b}(x^{(i)}) = wx^{(i)} + b \tag{1} fw,b(x(i))=wx(i)+b(1)if w=200, b=100
import numpy as np import matplotlib.pyplot as plt w = 200 b = 100 x_train = np.array([1.0, 2.0]) y_train = np.array([300.0, 500.0]) m = x_train.shape[0] f_wb = np.zeros(m) # 创建全为0的零向量m for i in range(m): f_wb[i] = w * x_train[i] + b plt.plot(x_train, f_wb, c='b',label='预测值') plt.scatter(x_train, y_train, marker='x', c='r',label='实际值') plt.title("Housing Prices") plt.ylabel('Price (in 1000s of dollars)') plt.xlabel('Size (1000 sqft)') plt.legend() plt.show()- 1
- 2
- 3
- 4
- 5
- 6
- 7
- 8
- 9
- 10
- 11
- 12
- 13
- 14
- 15
- 16
- 17
- 18
- 19

@@---------------------------@@
4.5 预测1200尺时房子的价格
@@---------------------------@@w = 200 b = 100 x_i = 1.2 cost_1200sqft = w * x_i + b print(f"${cost_1200sqft:.0f} thousand dollars")- 1
- 2
- 3
- 4
- 5
测试案例来源于 吴恩达《Machine Learning》Model representation
仅供学习参考end ---- >
-
相关阅读:
java多线程面试相关的一些问题
IBM MQ 通道数量查看,以及最大通道数的修改
mysql修改字符集
【树】【图论】【树路径】【深度优先搜索】2867. 统计树中的合法路径数目
使用IntelliJ IDEA进行Java的web程序开发(Servlet和Jsp)
我眼中的阿里不完美,但值得去学5年
【数学建模】简单的优化模型-6 血管分支
数字信号处理学习笔记(一):离散时间信号与系统
idea使用Alibaba Cloud Toolkit实现自动部署
金九银十助力面试——手把手轻松读懂HashMap源码
- 原文地址:https://blog.csdn.net/weixin_43098506/article/details/127123242
