-
Python: RANSAC随机一致性原理与实现
Python: RANSAC随机一致性原理与实现
前言
最近要把点云平面做分割,想到可以使用RANSAC做平面拟合。以前经常在图像配准里使用RANSAC做单应性计算,这里记录一下RANSAC的原理以及使用RANSAC拟合平面直线的方法。
随机一致性原理
RANdom SAmple Consensus(RANSAC)随机一致性,用于从被观测的带噪数据中,估计数学模型的参数。
原理:假设一组带有噪声的数据是服从某个数学模型的,其中包含部分不带噪数据(或者噪声很小的数据),称为内点inliers,以及部分噪声大到超出数学模型一定范围的带噪数据,称为外点outliers。通过随机抽取部分观测数据推导模型参数,再将其它数据带入数学模型计算符合程度,重复以上过程直到获得最优结果。
简而言之,RANSAC通过随机选取数据推算数学模型,利用模型与inliers的一致性,反复迭代后选取最符合观测数据的模型参数作为估计结果。
RANSAC直线拟合
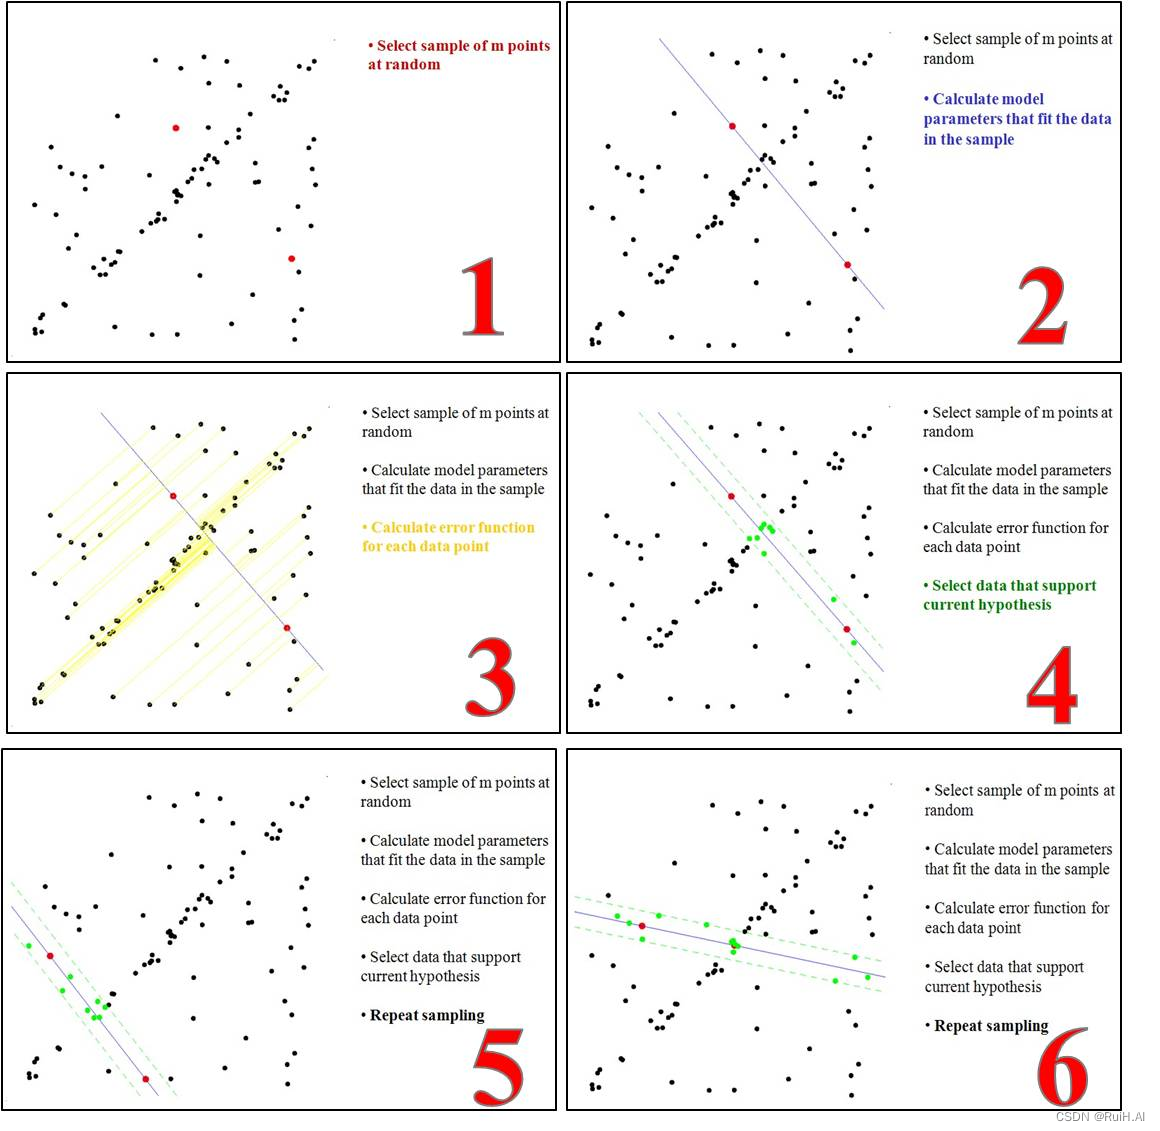
借用下图来阐述RANSAC直线拟合的思想:
1.随机选取两个点,计算直线方程
2.所有观测点代入直线方程,筛选距离小于阈值的点作为内点
3.重复以上过程,直到达到预期结果这个预期结果可以是:达到迭代最大次数时,内点最多的直线;或者内点数超过观测数据的70%时等等。

python代码
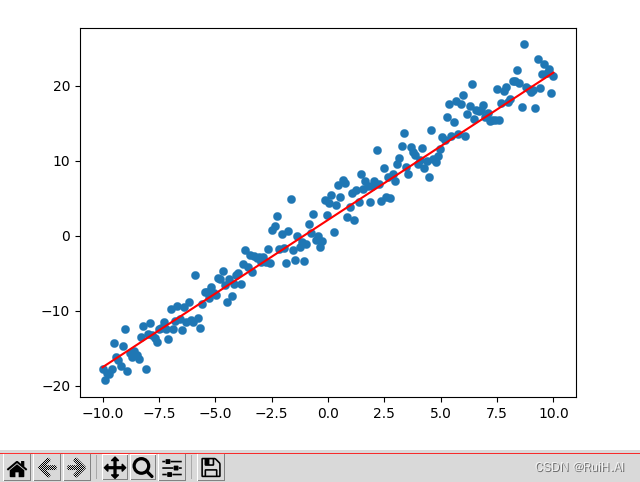
随机抽取直线y=2x+3上的点,并附加一个高斯噪声:
y = 2 x + 3 + 2 N ( 0 , 1 ) y=2x+3+2N~(0,1) y=2x+3+2N (0,1)import numpy as np import matplotlib.pyplot as plt def func(x): return 2 * x + 3 # y=2x+3 def ransac(points, npoints, dist_threshold, iterations=5000): max_num_inliners = 0 k_ransac = np.nan b_ransac = np.nan for i in range(iterations): num_inliners = 0 idxs = np.random.choice(points.shape[0], npoints, replace=False) k = (points[idxs[0], 1] - points[idxs[1], 1]) / (points[idxs[0], 0] - points[idxs[1], 0]) b = points[idxs[1], 1] - k * points[idxs[1], 0] for point in points: dist = np.abs(k*point[0]-point[1]+b) / np.sqrt(k**2+1) if dist < dist_threshold: num_inliners += 1 if num_inliners > max_num_inliners: max_num_inliners = num_inliners k_ransac = k b_ransac = b return k_ransac, b_ransac, max_num_inliners if __name__ == '__main__': x_sampled = np.linspace(-10, 10, 200) n_sampled = np.random.randn(200) * 2 y_sampled = func(x_sampled) + n_sampled data_sampled = np.stack([x_sampled, y_sampled], axis=-1) k_, b_, nums = ransac(data_sampled, 2, 1) print(k_, b_, nums) plt.scatter(x_sampled, y_sampled, linewidths=0.2) plt.plot([-10, 10], [-10*k_ + b_, 10*k_ + b_], 'r-') plt.show()
-
相关阅读:
【深入浅出系列】之代码可读性
力扣leetcode 1619. 删除某些元素后的数组均值
【电脑插入U盘或者内存卡显示无法格式化FAT32如何解决】
opencv阈值图像Threshold方法
流媒体学习之路(WebRTC)——音频NackTracker优化思路(8)
在 WPF 客户端实现 AOP 和接口缓存
腾讯mini项目-【指标监控服务重构】2023-08-24
Linux远程工具专家推荐(二)
Day38——进程的创建方法,join方法,进程对象
IDEA 部署服务到 Docker 容器
- 原文地址:https://blog.csdn.net/qq_41035283/article/details/127113780