-
MATLAB | MATLAB中绘图的奇淫技巧合集
一些离大谱的绘图小技巧,部分内容来自https://undocumentedmatlab.com/
更改3D坐标区轴位置
对于
hAxes=gca- hAxes.XRuler.FirstCrossoverValue
X轴在Y轴上的位置 - hAxes.XRuler.SecondCrossoverValue
X轴在Z轴上的位置 - hAxes.YRuler.FirstCrossoverValue
Y轴在X轴上的位置 - hAxes.YRuler.SecondCrossoverValue
Y轴在Z轴上的位置 - hAxes.ZRuler.FirstCrossoverValue
Z轴在X轴上的位置 - hAxes.ZRuler.SecondCrossoverValue
Z轴在Y轴上的位置
一个实例:
N = 49;
X = linspace(-10,10,N);
Z = peaks(N);
mesh(X,X,Z);

hAxes=gca;
hAxes.LineWidth=1.5;
hAxes.XRuler.FirstCrossoverValue  = 0; % X轴在Y轴上的位置
hAxes.YRuler.FirstCrossoverValue  = 0; % Y轴在X轴上的位置
hAxes.ZRuler.FirstCrossoverValue  = 0; % Z轴在X轴上的位置
hAxes.ZRuler.SecondCrossoverValue = 0; % Z轴在Y轴上的位置
无穷基线
基线不仅可以设置为0或者其他有限数,甚至可以设置为正负无穷:
x=0:.1:8;
y=sin(x)-x;

area(x,y,'FaceAlpha',.5,'BaseValue',-inf)
x=1900:10:2000;
y=[75 91 105 123.5 131 150 179 203 226 249 281.5];
bar(x,y,'BaseValue',inf)
修改坐标区域背景
我们知道可以通过设置
set(gca,'Color',[1,0,0])类似的形式设置背景颜色,但这只是纯色,那么有啥办法把背景色换成渐变色?
t=0.2:0.01:3*pi;

hold on
plot(t,cos(t)./(1+t),'LineWidth',4)
plot(t,sin(t)./(1+t),'LineWidth',4)
plot(t,cos(t+pi/2)./(1+t+pi/2),'LineWidth',4)
plot(t,cos(t+pi)./(1+t+pi),'LineWidth',4)
legend


ax=gca;pause(1e-16);% Backdrop建立需要一定时间因此pause一下很重要
% 四列分别为四个角的颜色
% 使用4xN大小颜色矩阵
% 四行分别是R,G,B,和透明度
colorData = uint8([255, 150, 200, 100; ...
                   255, 100,  50, 200; ...
                     0,  50, 100, 150; ...
                   102, 150, 200,  50]);
set(ax.Backdrop.Face, 'ColorBinding','interpolated','ColorData',colorData);
修改背景为图片
t=0.2:0.01:3*pi;

hold on
plot(t,cos(t)./(1+t),'LineWidth',4)
plot(t,sin(t)./(1+t),'LineWidth',4)
plot(t,cos(t+pi/2)./(1+t+pi/2),'LineWidth',4)
plot(t,cos(t+pi)./(1+t+pi),'LineWidth',4)
legend


axis tight;
img=imread('test.png');
h=image(xlim,ylim,flipud(img));
uistack(h,'bottom')
循环颜色和线形
ax=gca;hold on
m=magic(9);

ax.ColorOrder=lines(3);
ax.LineStyleOrder={'-','--o',':s'};

hold on
for i=1:9
  plot(m(i,:),'LineWidth',1.2)
  ax.LineStyleOrderIndex = ax.ColorOrderIndex;
end
legend
渐变marker
x=1:30;y=sin(x);
hLine=plot(x,y,'o-','MarkerSize',10,'Color',[0,0,0]);

pause(1e-16)% MarkerHandle建立需要一定时间因此pause一下很重要
hMarkers=hLine.MarkerHandle;
markerNum=size(hMarkers.VertexData,2);

% 这里用的pink配色,可以换成其他colormap
colorData=uint8([(pink(markerNum).*255)';255.*ones(1,markerNum)]);
set(hMarkers,'FaceColorBinding','interpolated','FaceColorData',colorData)
渐变折线图
x=1:.1:10;y=sin(x);
hLine=plot(x,y,'-','LineWidth',30);

colorNum=length(hLine.XData);

% 这里用的pink配色,可以换成其他colormap
% 最后面透明度用的200可调整
colorData=uint8([(pink(colorNum).*255)';200.*ones(1,colorNum)]);
pause(1e-16)% MarkerHandle建立需要一定时间因此pause一下很重要
set(hLine.Edge,'ColorBinding','interpolated', 'ColorData',colorData)
半透明及渐变图例
t=0.2:0.01:3*pi;

hold on
plot(t,cos(t)./(1+t),'LineWidth',4)
plot(t,sin(t)./(1+t),'LineWidth',4)
plot(t,cos(t+pi/2)./(1+t+pi/2),'LineWidth',4)
plot(t,cos(t+pi)./(1+t+pi),'LineWidth',4)
hLegend=legend();
% 设置图例为半透明
pause(1e-16)
set(hLegend.BoxFace,'ColorType','truecoloralpha','ColorData',uint8(255*[1;1;1;.5]));

set(gca,'Color',[0,0,.18]);
当然也可以花里胡哨:
t=0.2:0.01:3*pi;
hold on
plot(t,cos(t)./(1+t),'LineWidth',4)
plot(t,sin(t)./(1+t),'LineWidth',4)
plot(t,cos(t+pi/2)./(1+t+pi/2),'LineWidth',4)
plot(t,cos(t+pi)./(1+t+pi),'LineWidth',4)
hLegend=legend();

% 设置图例为渐变色
pause(1e-16)
colorData = uint8([255, 150, 200, 100; ...
                   255, 100,  50, 200; ...
                     0,  50, 100, 150; ...
                   102, 150, 200,  50]);
set(hLegend.BoxFace,'ColorBinding','interpolated','ColorData',colorData)
特殊marker
众所周知,在版本R2020b版本中,横线及竖线marker以及可以直接使用:
t=0:0.1:3*pi;
hold on
plot(t,cos(t),'-_')
plot(t,t./8,'-|')
而在老版本,这俩marker可以这样调用出来:
t=0:0.1:3*pi;
hold on
hLine1=plot(t,cos(t),'-o');
hLine2=plot(t,t./8,'-o');

pause(1e-8)
set(hLine1.MarkerHandle,'Style','hbar')
set(hLine2.MarkerHandle,'Style','vbar')
等高线图保留小数位数
[X,Y,Z] = peaks;


[c,h]=contourf(X,Y,Z,5,'ShowText','on');
h.LevelList=round(h.LevelList,3);% 保留三位小数
clabel(c,h)
绘制结果:
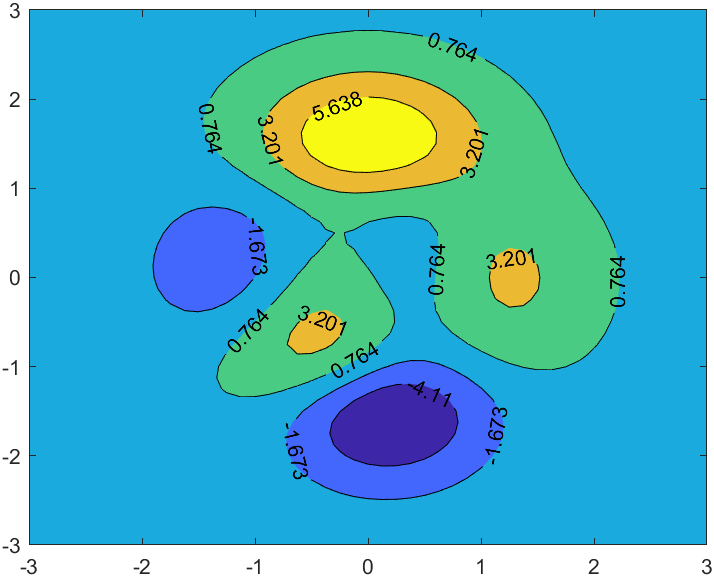
原始绘图:

根据等高线颜色设置文本颜色
[X,Y,Z] = peaks;
[C,hContour] = contour(X,Y,Z, 'ShowText','on', 'LevelStep',1, 'LineWidth',1.5);


updateContours(hContour);
% 因为标签位置是自动更新的属性,会刷新掉颜色,因此添加listener检测
addlistener(hContour, 'MarkedClean', @(h,e)updateContours(hContour));
function updateContours(hContour)
    drawnow
    levels = hContour.LevelList;
    labels = hContour.TextPrims; % 获取标签基础对象
    lines  = hContour.EdgePrims; % 获取边缘基础对象
    for idx = 1 : numel(labels)
        labelValue = str2double(labels(idx).String);
        lineIdx = find(abs(levels-labelValue)<10*eps, 1);  % 找到对应层级
        labels(idx).ColorData = lines(lineIdx).ColorData;  % 修改标签颜色
        labels(idx).Font.Size = 11;
    end
    drawnow
end
- hAxes.XRuler.FirstCrossoverValue
-
相关阅读:
x shell 用作串口调试助手
12.从架构设计角度分析AAC源码-Room源码解析第1篇:当前demo为主线查看涉及的Room源码解析
前端常用操作(一)
nginx-配置拆分(各个模块详细说明)
Hive集群部署实验
大数据开发面试笔记Day1
深度学习提高模型准确率方法
一条龙-T检验+绘制boxplot
springboot曦乐苹果园林管理系统的设计与实现毕业设计源码100854
【C进阶】字符串函数
- 原文地址:https://blog.csdn.net/slandarer/article/details/127027507