-
数据分析——matplotlib1
第一个绘图程序
- 首先导入Matplotlib包中的Pyplot模块,并以as别名的形式简化引入包的名称
from matplotlib import pyplot as plt- 1
- 接下来,使用Numpy提供的函数arange()创建一组数据来绘制图像
#引入numpy包 import numpy as np #获得-50——50之间的ndarray对象 x=np.arange(-50,51)- 1
- 2
- 3
- 4
- 上述所得x的值作用到x轴上,而该值对应的平方值,也就是y值,使用以下方式获取
y=x**2- 1
- 使用plt的plot()函数对x、y进行绘制
#plot()绘制线性图表 plt.plot(x,y)- 1
- 2
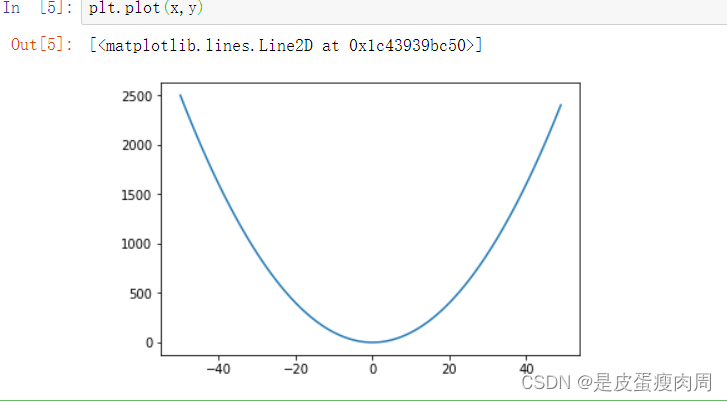
matplotlib基本方法
方法名 说明 title() 设置图表名称 xlabel() 设置x轴名称 ylable() 设置y轴名称 xticks(ticks,label,rotation) 设置x轴的刻度,rotation旋转角度 yticks() 设置y轴的刻度 show() 显示图表 legend() 显示图例 text(x,y,text) 显示每条数据的值x,y的位置 图表名称plt.title()
import numpy as np #x获得-50——50之间的ndarray对象 x=np.arange(-50,50) #y轴的值是x轴的平方 y=x**2 #设置图名 plt.title("y=x^2") #绘制图表 plt.plot(x,y)- 1
- 2
- 3
- 4
- 5
- 6
- 7
- 8
- 9
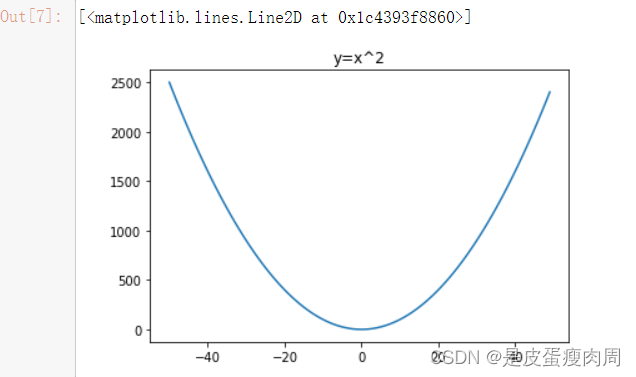
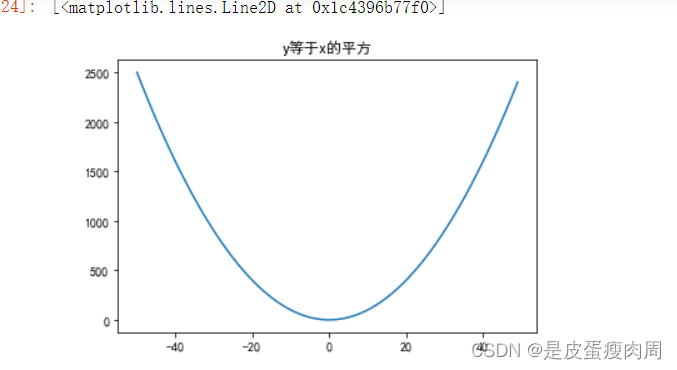
如何标题写成中文呢?
#设置图名 plt.title("y等于x的平方")
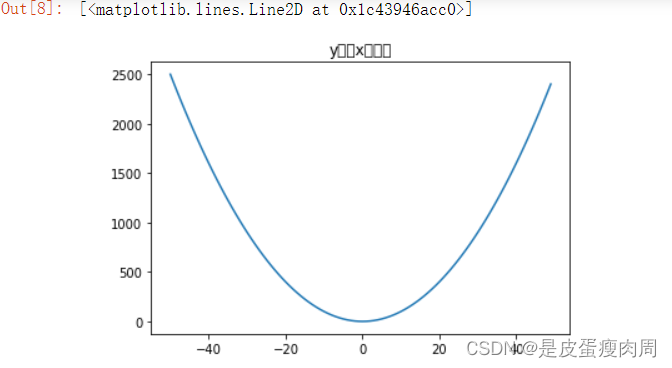
解决方法:
修改字体配置plt.rcParams[“font.sans-serif”]
字体说明:
“SimHei” ------中文黑体
“Kaiti”------中文楷体
“LiSu”—中文隶书
“FangSong”------中文仿宋
“YouYuan”------中文幼圆
“STSong”-----华文仿宋plt.rcParams['font.sans-serif']=["SimHei"]- 1
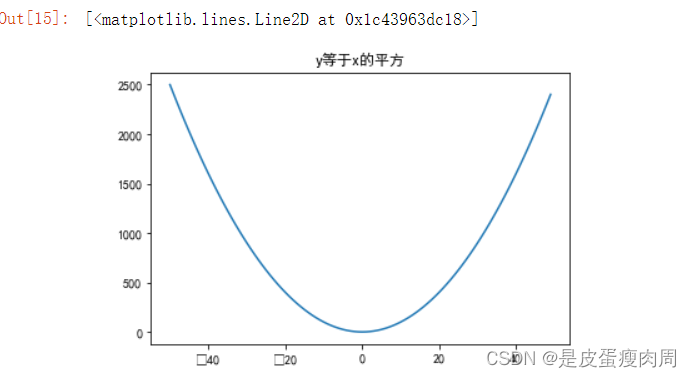
设置之后,负号又没办法正确显示?
#解决方式:修改轴中的负号编码 plt.rcParams['axes.unicode_minus']=False
x轴和y轴的名称
plt.xlabel("x轴") plt.ylabel("y轴")- 1
- 2
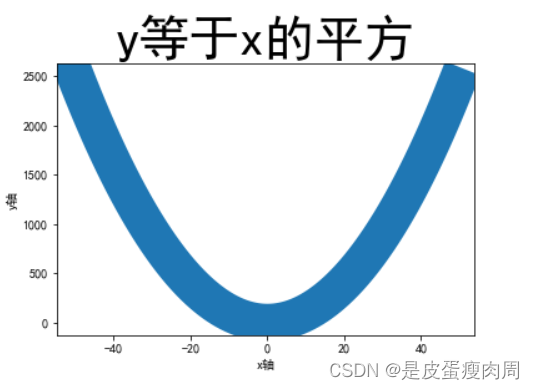
对于上面的图,如果觉得字体偏小或线条太细,可以设置标签文字大小和线条粗细
fontsize:设置文字大小
plt.title("y等于x的平方",fontsize=50)
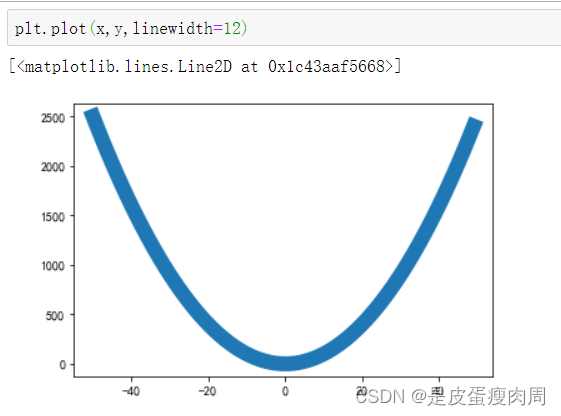
linewidth:设置线条
plt.plot(x,y,linewidth=30)
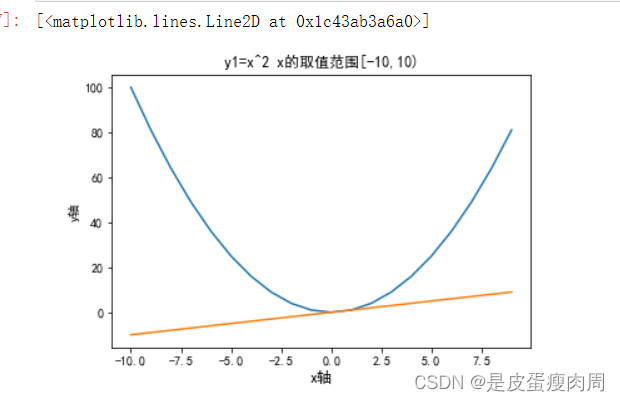
一张图 绘制多个线条
#创建x为-10到10的整数 x=np.arange(-10,10) #y1是x的平方 y1=x**2 y2=x #设置标题 plt.title("y1=x^2 x的取值范围[-10,10)") #设置x轴名称 plt.xlabel("x轴",fontsize=12) #设置y轴名称 plt.ylabel("y轴") #绘图线条y1 plt.plot(x,y1) #绘图线条y2 plt.plot(x,y2)- 1
- 2
- 3
- 4
- 5
- 6
- 7
- 8
- 9
- 10
- 11
- 12
- 13
- 14
- 15
- 设置x轴、y轴刻度
matplotlib.pyplot.xticks=(ticks=None,labels=None,**kwargs)
1.ticks:此参数是xtick位置的列表。和一个可选参数。
2.labels:此参数包含放置在给定刻度线位置的标签。它是一个可选参数
3.**kwargs:此参数是文本属性,用于控制标签的外观
-----------rotation:旋转角度
-----------color:颜色#每个时间点的销量绘图 times=['2015/6/26','2015/8/1','2012/9/6','2015/10/12','2015/11/17','2016/1/28'] #随机出销量 sales=np.random.randint(500,2000,size=len(times)) #绘制图形 plt.plot(times,sales)- 1
- 2
- 3
- 4
- 5
- 6
- 7
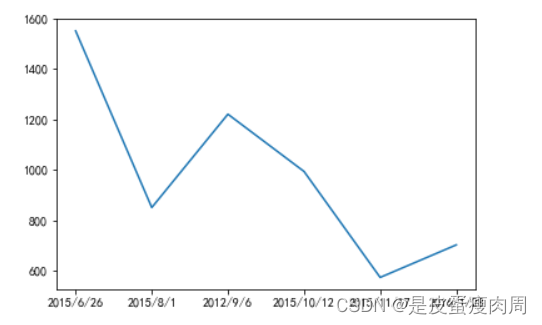
plt.xticks(range(1,len(time),2))- 1
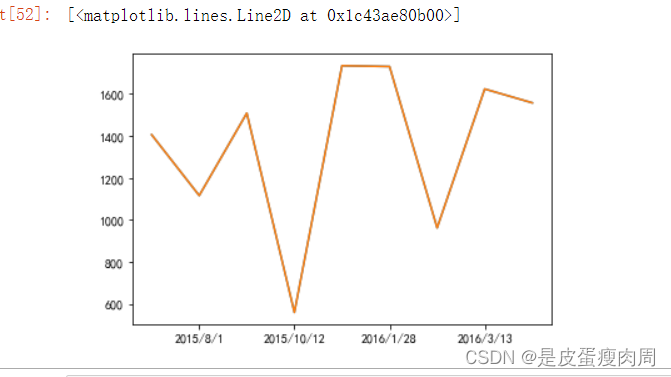
plt.xticks(range(1,len(times),2),rotation=4) plt.plot(times,sales)- 1
- 2
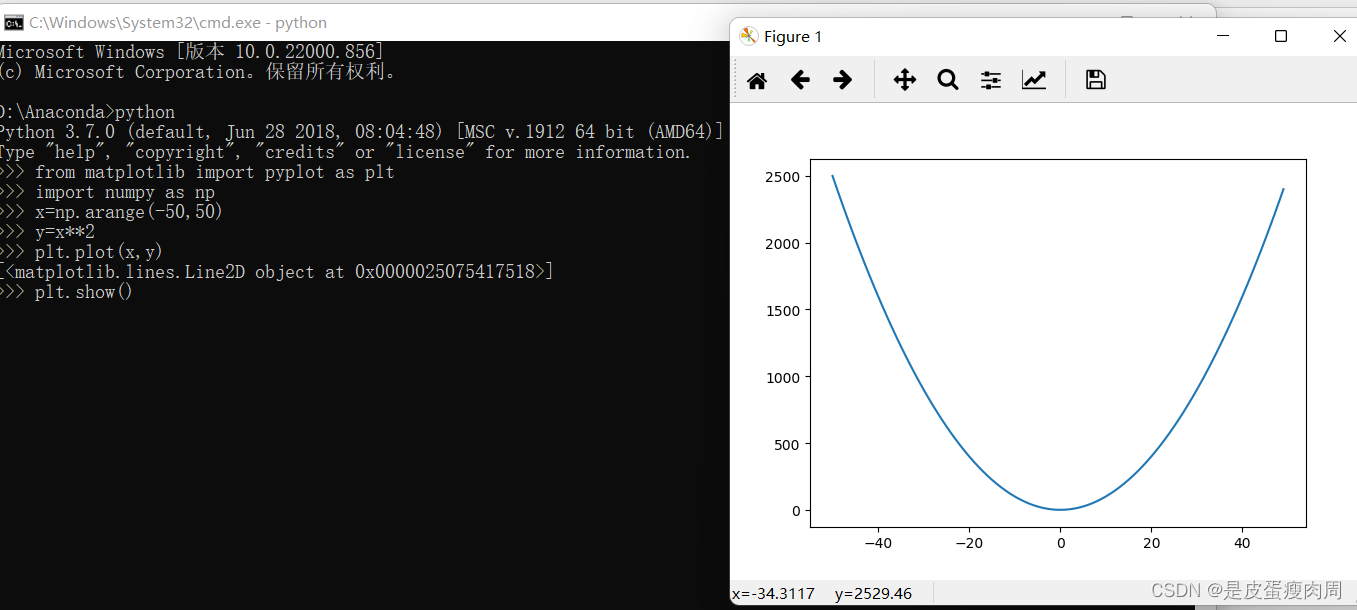
显示图表
显示所有打开的图形
jupyter notebooks会自动显性#此处通过python交互模式演示- 1
需要调用show()才会显示
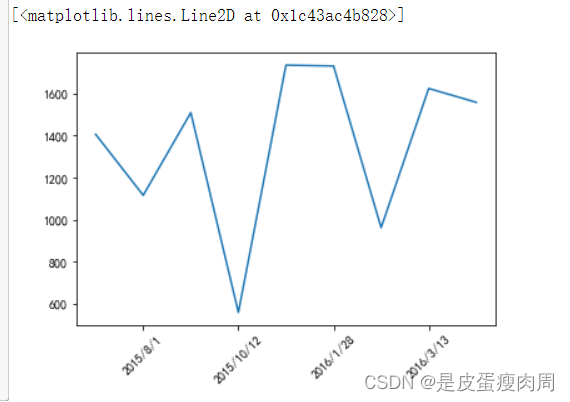
#如果在jupyter中也想出现图形操作菜单,可以使用matplotlib中的魔术方法 %matlpotlib notebook plt.xticks(range(1,len(times),2),rotation=45) plt.plot(times,sales)- 1
- 2
- 3
- 4
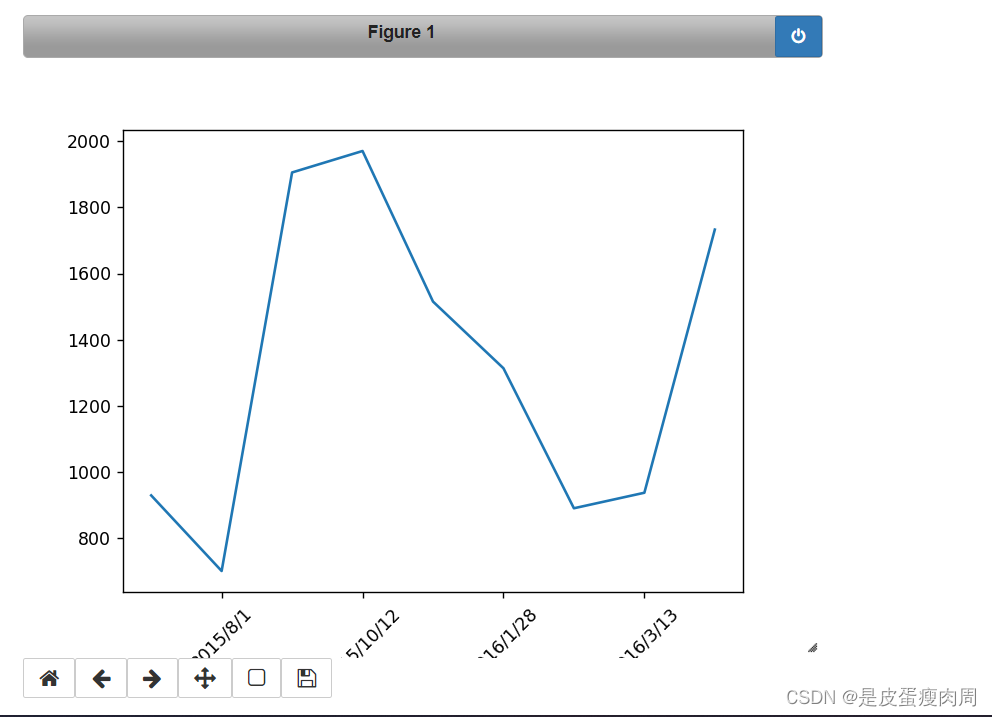
#如果又想回去原来的展示,使用另一个%matplotlib inline %matplotlib inline- 1
- 2
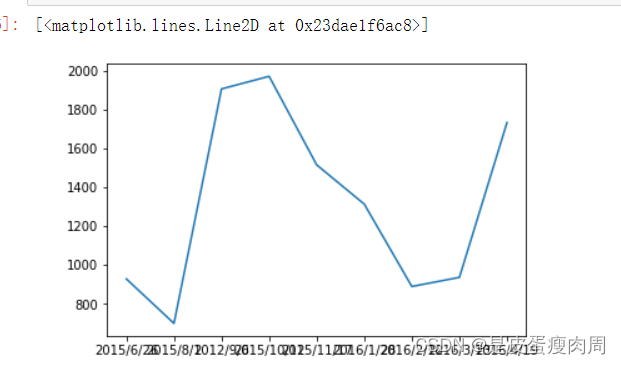
显示图例
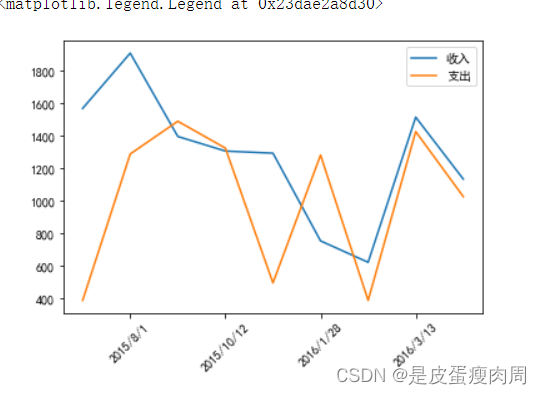
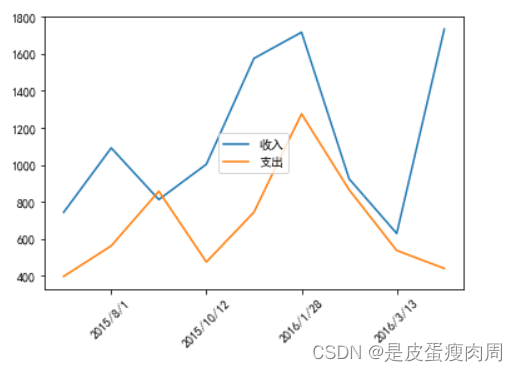
from matplotlib import pyplot as plt import numpy as np plt.rcParams['font.sans-serif']=["SimHei"] times=['2015/6/26','2015/8/1','2012/9/6','2015/10/12','2015/11/17','2016/1/28','2016/2/12','2016/3/13','2016/4/19'] #随机出收入 income=np.random.randint(500,2000,size=len(times)) #支出 expenses=np.random.randint(300,1500,size=len(times)) #绘制图形 plt.xticks(range(1,len(times),2),rotation=45) #注意:在使用图例前为每个图形设置label参数 plt.plot(times,income,label="收入") plt.plot(times,expenses,label="支出") #默认使用每个图形的label值作为图例说明 plt.legend()- 1
- 2
- 3
- 4
- 5
- 6
- 7
- 8
- 9
- 10
- 11
- 12
- 13
- 14
- 15
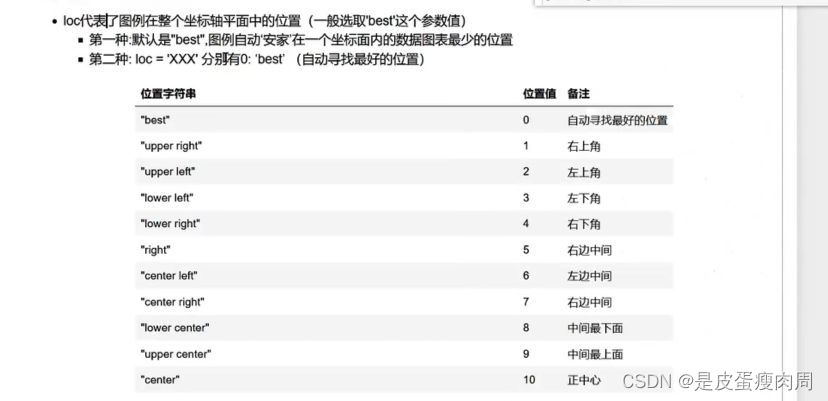
plt.legend(loc="center")- 1
显示每条数据的值x、y
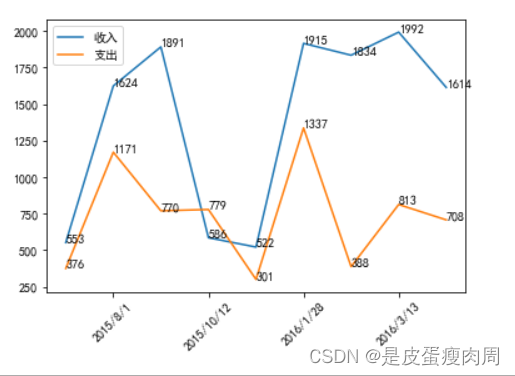
plt.text(x,y,string,fontsize=15,vericalalignment=“top”,horizontalalignment=“right”)
1.x,y:表示坐标值上的值
2.string:表示说明文字
3.fontsize:表示字体大小
4.vericalalignment:(va)垂直对齐方式,参数:[‘center’|‘top’|‘botton’|‘baselin’]
5.horizontalalignment:(ha)水平对齐方式,参数:[‘center’|'‘right’|‘left’]from matplotlib import pyplot as plt import numpy as np plt.rcParams['font.sans-serif']=["SimHei"] times=['2015/6/26','2015/8/1','2012/9/6','2015/10/12','2015/11/17','2016/1/28','2016/2/12','2016/3/13','2016/4/19'] #随机出收入 income=np.random.randint(500,2000,size=len(times)) #支出 expenses=np.random.randint(300,1500,size=len(times)) #绘制图形 plt.xticks(range(1,len(times),2),rotation=45) #注意:在使用图例前为每个图形设置label参数 plt.plot(times,income,label="收入") plt.plot(times,expenses,label="支出") #默认使用每个图形的label值作为图例说明 plt.legend(loc="upper left") #显示值 for a,b in zip(times,income): plt.text(a,b,b) for a,b in zip(times,expenses): plt.text(a,b,b)- 1
- 2
- 3
- 4
- 5
- 6
- 7
- 8
- 9
- 10
- 11
- 12
- 13
- 14
- 15
- 16
- 17
- 18
- 19
- 20
-
相关阅读:
使用 Qt for Android 获取并利用手机传感器数据(1)开发环境省心搭建
基于opengauss数据库的酒水销售管理系统
TypeScript常用知识点及其最佳实践总结
融合注意力机制和Bi-LSTM的旅游评价情感分析模型
你与年薪百万的项目经理,可能就差一个字母
手机强制移除ppt密码,ppt权限密码多少?
【MySQL】——Select查询语句知识点练习(其一)
个人如何申请发明专利,需要的资料有哪些
RAR压缩包如何加密,忘记密码如何找回?
ElasticSearch安装为Win11服务
- 原文地址:https://blog.csdn.net/weixin_66610130/article/details/126808182
