-
Machine learning week 8(Andrew Ng)
Unsupervised learning
1.Clustering
1.1.What is clustering?
Namely, look at the dataset like this and try to see if it can be grouped into clusters, meaning groups of points that are similar to each other.
1.2+1.3.K-means
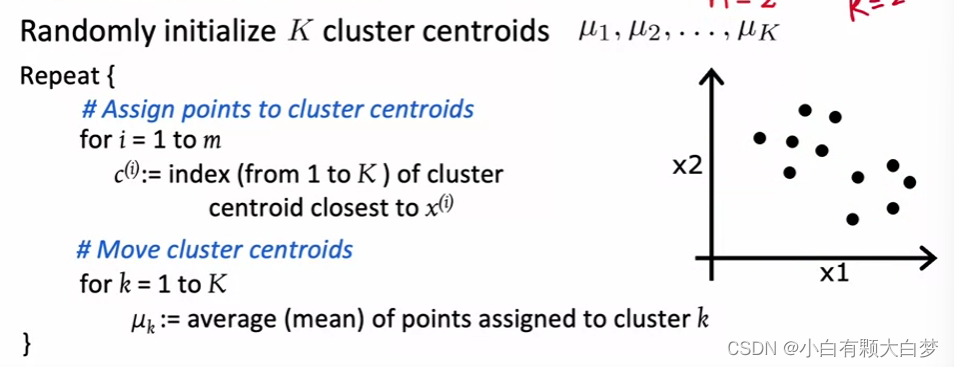
def find_closest_centroids(X, centroids): """ Computes the centroid memberships for every example Args: X (ndarray): (m, n) Input values centroids (ndarray): k centroids Returns: idx (array_like): (m,) closest centroids """ # Set K K = centroids.shape[0] # You need to return the following variables correctly idx = np.zeros(X.shape[0], dtype=int) ### START CODE HERE ### for i in range(X.shape[0]): distance = [] for j in range(centroids.shape[0]): norm_ij = np.linalg.norm(X[i] - centroids[j]) distance.append(norm_ij) idx[i] = np.argmin(distance) # return the index of the minimum value ### END CODE HERE ### return idx def compute_centroids(X, idx, K): """ Returns the new centroids by computing the means of the data points assigned to each centroid. Args: X (ndarray): (m, n) Data points idx (ndarray): (m,) Array containing index of closest centroid for each example in X. Concretely, idx[i] contains the index of the centroid closest to example i K (int): number of centroids Returns: centroids (ndarray): (K, n) New centroids computed """ # Useful variables m, n = X.shape # You need to return the following variables correctly centroids = np.zeros((K, n)) ### START CODE HERE ### for i in range(K): points = X[idx == i] # different from c++ centroids[i] = np.mean(points ,axis = 0) ### END CODE HERE ## return centroids def run_kMeans(X, initial_centroids, max_iters=10, plot_progress=False): """ Runs the K-Means algorithm on data matrix X, where each row of X is a single example """ # Initialize values m, n = X.shape K = initial_centroids.shape[0] centroids = initial_centroids previous_centroids = centroids idx = np.zeros(m) # Run K-Means for i in range(max_iters): #Output progress print("K-Means iteration %d/%d" % (i, max_iters-1)) # For each example in X, assign it to the closest centroid idx = find_closest_centroids(X, centroids) # Given the memberships, compute new centroids centroids = compute_centroids(X, idx, K) return centroids, idx- 1
- 2
- 3
- 4
- 5
- 6
- 7
- 8
- 9
- 10
- 11
- 12
- 13
- 14
- 15
- 16
- 17
- 18
- 19
- 20
- 21
- 22
- 23
- 24
- 25
- 26
- 27
- 28
- 29
- 30
- 31
- 32
- 33
- 34
- 35
- 36
- 37
- 38
- 39
- 40
- 41
- 42
- 43
- 44
- 45
- 46
- 47
- 48
- 49
- 50
- 51
- 52
- 53
- 54
- 55
- 56
- 57
- 58
- 59
- 60
- 61
- 62
- 63
- 64
- 65
- 66
- 67
- 68
- 69
- 70
- 71
- 72
- 73
- 74
- 75
- 76
- 77
- 78
- 79
- 80
- 81
- 82
- 83
- 84
- 85
- 86
- 87
- 88
- 89
1.4.Optimization objective
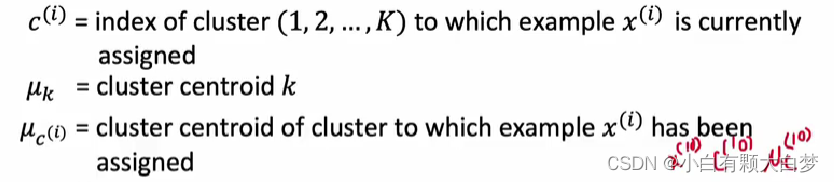
Some notations
Cost function

Notice :the meaning of μ c ( i ) \mu_{c^{(i)}} μc(i)
For each step, the cost function must decrease other than there are some bugs in the code. Actually, in K-means, the cost never increases. If the rate at which the cost function is going down has become very, very slow. You might also just say this is good enough.1.5.Initializing K-means
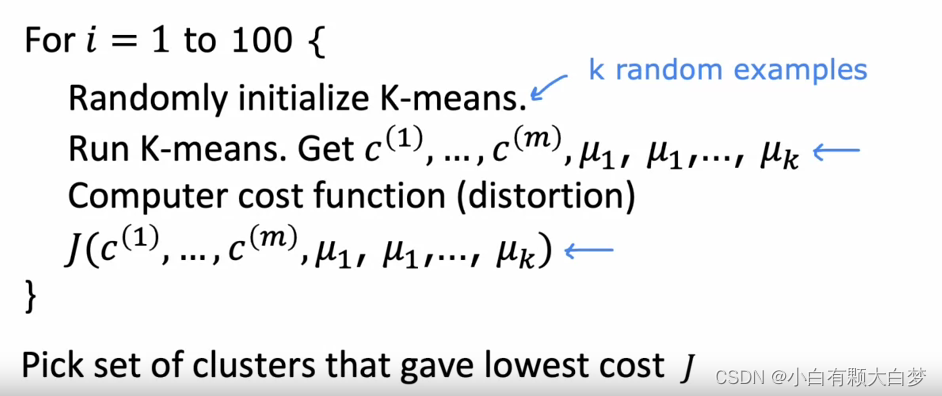
def kMeans_init_centroids(X, K): """ This function initializes K centroids that are to be used in K-Means on the dataset X Args: X (ndarray): Data points K (int): number of centroids/clusters Returns: centroids (ndarray): Initialized centroids """ # Randomly reorder the indices of examples randidx = np.random.permutation(X.shape[0]) # K-mean++的内涵,初始选点使用原数据集里的 # Take the first K examples as centroids centroids = X[randidx[:K]] return centroids- 1
- 2
- 3
- 4
- 5
- 6
- 7
- 8
- 9
- 10
- 11
- 12
- 13
- 14
- 15
- 16
- 17
- 18
- 19
- 20
1.6.Choosing the number of clusters

Unusual way:
2.Anomaly detection
2.1.Finding unusual events

2.2. Gaussian distribution

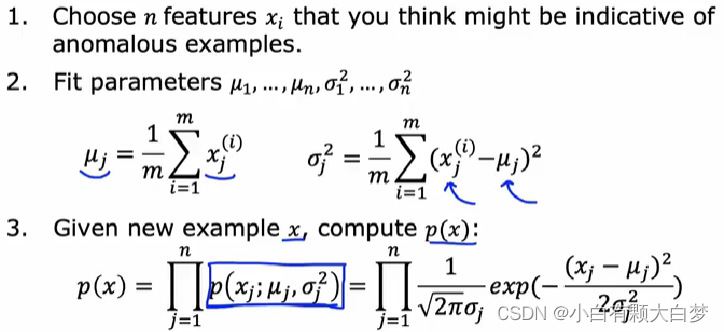
def estimate_gaussian(X): """ Calculates mean and variance of all features in the dataset Args: X (ndarray): (m, n) Data matrix Returns: mu (ndarray): (n,) Mean of all features var (ndarray): (n,) Variance of all features """ m, n = X.shape ### START CODE HERE ### mu = np.mean(X, axis = 0) var = np.sum((X - mu) ** 2, axis = 0) / m ### END CODE HERE ### return mu, var def multivariate_gaussian(X, mu, var): """ Computes the probability density function of the examples X under the multivariate gaussian distribution with parameters mu and var. If var is a matrix, it is treated as the covariance matrix. If var is a vector, it is treated as the var values of the variances in each dimension (a diagonal covariance matrix """ k = len(mu) if var.ndim == 1: var = np.diag(var) X = X - mu p = (2* np.pi)**(-k/2) * np.linalg.det(var)**(-0.5) * \ np.exp(-0.5 * np.sum(np.matmul(X, np.linalg.pinv(var)) * X, axis=1)) return p def select_threshold(y_val, p_val): """ Finds the best threshold to use for selecting outliers based on the results from a validation set (p_val) and the ground truth (y_val) Args: y_val (ndarray): Ground truth on validation set p_val (ndarray): Results on validation set(probabilities) Returns: epsilon (float): Threshold chosen F1 (float): F1 score by choosing epsilon as threshold """ best_epsilon = 0 best_F1 = 0 F1 = 0 step_size = (max(p_val) - min(p_val)) / 1000 for epsilon in np.arange(min(p_val), max(p_val), step_size): ### START CODE HERE ### prediction = [] prediction = (p_val < epsilon) # 对整个列表进行操作 tp = sum((prediction ==1) & (y_val ==1)) fp = sum((prediction ==1) & (y_val ==0)) fn = sum((prediction ==0) & (y_val ==1)) # if you have several binary values in an 𝑛 -dimensional binary vector, # you can find out how many values in this vector are 0 by using: # np.sum(v == 0) prec = tp / (tp +fp) rec = tp / (tp +fn) F1 = (2 * prec * rec) / (prec +rec) ### END CODE HERE ### if F1 > best_F1: best_F1 = F1 best_epsilon = epsilon return best_epsilon, best_F1 p_val = multivariate_gaussian(X_val, mu, var) epsilon, F1 = select_threshold(y_val, p_val) print('Best epsilon found using cross-validation: %e' % epsilon) print('Best F1 on Cross Validation Set: %f' % F1)- 1
- 2
- 3
- 4
- 5
- 6
- 7
- 8
- 9
- 10
- 11
- 12
- 13
- 14
- 15
- 16
- 17
- 18
- 19
- 20
- 21
- 22
- 23
- 24
- 25
- 26
- 27
- 28
- 29
- 30
- 31
- 32
- 33
- 34
- 35
- 36
- 37
- 38
- 39
- 40
- 41
- 42
- 43
- 44
- 45
- 46
- 47
- 48
- 49
- 50
- 51
- 52
- 53
- 54
- 55
- 56
- 57
- 58
- 59
- 60
- 61
- 62
- 63
- 64
- 65
- 66
- 67
- 68
- 69
- 70
- 71
- 72
- 73
- 74
- 75
- 76
- 77
- 78
- 79
- 80
- 81
- 82
- 83
- 84
- 85
- 86
- 87
- 88
- 89
- 90
- 91
- 92
- 93
- 94
- 95
- 96
2.3. Algorithm
2.4.Developing and evaluating an anomaly detection system

2.5. The compare between anomaly detection and supervised learning


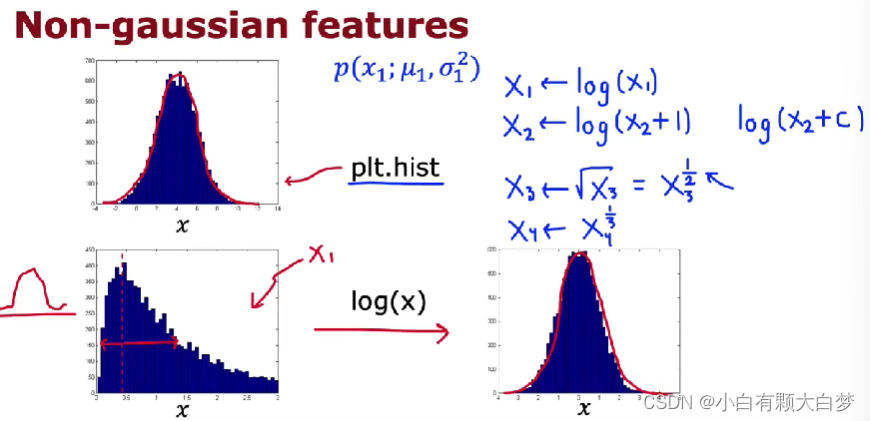
2.6.Choosing features

-
相关阅读:
冷链监测之稳定性预算
文字转音频软件哪个好用?这3款文字转换音频的软件识别率很高
Java多线程
FFmpeg入门详解之18:视频基础概念
等级保护2.0安全体系框架新升级,山石网科助力企业网络安全建设
sonic云真机通过linux系统接入苹果手机
Windows OpenGL 图像反色
java版工程管理系统Spring Cloud+Spring Boot+Mybatis实现工程管理系统源码
win11改成win7界面的设置方法
能耗管理系统在煤矿行业中的应用
- 原文地址:https://blog.csdn.net/weixin_62012485/article/details/126497319

- 最新文章
-
沪漂五周年了:我越来越迷茫了
Agentic Skill Routing 实战:别再把所有 Skill 塞进 AI Agent 上下文
MySQL-Seconds_behind_master的精度误差
[MAF预定义ChatClient中间件-03]CachingChatClient——利用缓存省钱省时间
AI的至暗历史:从万众期待到被政府撤资,AI的两次死亡徘徊
Agent OS :五种驯服不确定性的范式
PortSwigger SQL注入LAB11
数据库即时编译JIT
[Begin]AI Learn Data Day 0
深度学习进阶(二十七)现代 LLM 的核心架构设计其二:SwiGLU