-
无监督距离评估
分类
1.评价指标,主要有两个维度
- 凝聚度(cohesion)
- 分离度(separation)
2.使用邻近度矩阵
Sklearn中的集成的评价
1.Silhouette( /ˌsɪl.uˈet/) Coefficient
s = b − a m a x ( a , b ) s = \frac{b- a}{max(a, b)} s=max(a,b)b−a
- a: The mean distance between a sample and all other points in the same class.(一个类间的平均距离)
- b: The mean distance between a sample and all other points in the next nearest cluster.(相邻类间的距离平均)
越大聚类效果越好
from sklearn import metrics from sklearn.metrics import pairwise_distances from sklearn import datasets X, y = datasets.load_iris(return_X_y=True) import numpy as np from sklearn.cluster import KMeans kmeans_model = KMeans(n_clusters=3, random_state=1).fit(X) labels = kmeans_model.labels_ metrics.silhouette_score(X, labels, metric='euclidean') 0.55...- 1
- 2
- 3
- 4
- 5
- 6
- 7
- 8
- 9
- 10
- 11
Advantages
故名思义,这个方法是衡量不同类和同一类的距离,越大表示同一类越紧密,不同类间距离越大,聚类效果越好
-1表示错误的聚类,b为0的情况,不同类完全没差别
+1表示聚类效果极佳,a为0,类间完全没差别
0表示类间有overlapping
(The score is bounded between -1 for incorrect clustering and +1 for highly dense clustering. Scores around zero indicate overlapping clusters.
The score is higher when clusters are dense and well separated, which relates to a standard concept of a cluster.)Drawbacks
The Silhouette Coefficient is generally higher for convex clusters than other concepts of clusters, such as density based clusters like those obtained through DBSCAN.2. Calinski-Harabasz Index
CH指标通过计算类中各点与类中心的距离平方和来度量类内的紧密度,通过计算各类中心点与数据集中心点距离平方和来度量数据集的分离度,CH指标由分离度与紧密度的比值得到。从而,CH越大代表着类自身越紧密,类与类之间越分散,即更优的聚类结果。
from sklearn import metrics from sklearn.metrics import pairwise_distances from sklearn import datasets X, y = datasets.load_iris(return_X_y=True) import numpy as np from sklearn.cluster import KMeans kmeans_model = KMeans(n_clusters=3, random_state=1).fit(X) labels = kmeans_model.labels_ metrics.calinski_harabasz_score(X, labels) 561.62...- 1
- 2
- 3
- 4
- 5
- 6
- 7
- 8
- 9
- 10
- 11
3.Davies-Bouldin Index
与前两个一致,也是一个分离度/聚集度评价指标,与之前不一样的是这个指标越小越好。
This index signifies the average ‘similarity’ between clusters, where the similarity is a measure that compares the distance between clusters with the size of the clusters themselves.
Zero is the lowest possible score. Values closer to zero indicate a better partition.from sklearn import datasets iris = datasets.load_iris() X = iris.data from sklearn.cluster import KMeans from sklearn.metrics import davies_bouldin_score kmeans = KMeans(n_clusters=3, random_state=1).fit(X) labels = kmeans.labels_ davies_bouldin_score(X, labels) 0.6619...- 1
- 2
- 3
- 4
- 5
- 6
- 7
- 8
- 9
前三个对比,根据实际测试,calinski-harabasz,davies_bouldin的计算时间与silouette有数量集的有数量级差异,silhouette已弃疗。

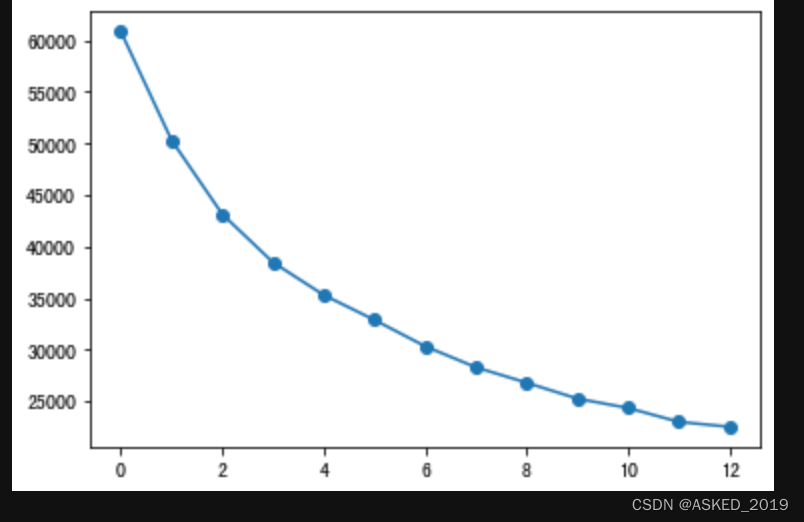
本人使用时,利用calinski_harabasz没有找到拐点,但是利用davies_bouldin有。

4.Contingency Matrix
卡方检验的前置表,计算标签和特征的统计量,可以看到不同特征值聚类后的分布情况,人工评估。
from sklearn.metrics.cluster import contingency_matrix x = ["a", "a", "a", "b", "b", "b"] y = [0, 0, 1, 1, 2, 2] contingency_matrix(x, y) array([[2, 1, 0], [0, 1, 2]])- 1
- 2
- 3
- 4
- 5
- 6
5.Pair Confusion Matrix
待补充
Reference:
1.scikit_learn
2.calinski_harabasz -
相关阅读:
LeetCode--215. 数组中的第K个最大元素(C++描述)
我的创作纪念日
音视频学习(十四)——rtsp详解
2-1.spring源码--Container
Vue2组件通信 - dispatch 和 broadcast
【C++】从入门到精通第三弹——友元函数与静态类成员
【Java面试】Redis存在线程安全问题吗?为什么?
es的优势
K8S部署Dashboard和Heapster
序列化-反序列化--json-xml-protoBuf
- 原文地址:https://blog.csdn.net/weixin_42223090/article/details/126300708