-
深度学习实战(2):肺炎预测|附数据集与源码
目录
写在前面
* 本篇文章仅作为深度学习学习用途 而非商用
* 运行系统 :MacOS / Windows
* Python版本 :Python3.0
* 运行平台:Visual Studio Code
🤯

项目任务简介
在已有的数据集下,训练一个CNN模型,预测一张CT图的肺部照片是否患有肺炎,若是患有肺炎,是因为细菌还是病毒引起的。数据集共有三个子文件夹:train / test / val 他们的作用相信各位都已经很清楚了 字面意思 这里不再多加赘述。
实验结果
接近80%的Accuracy,验证集和训练集的拟合程度较好(并未达到最好,赠机epoch或者更换学习函数可能可以更好的训练模型,这里只迭代30次(呜呜CPU的痛 各位如果有GPU可以适当增肌迭代次数)
导入需要的第三方库
在执行深度学习项目时,要做的第一件事就是加载所有必需的模块和图像数据本身。
在这里qdm模块的作用是来显示进度条。
- import os
- import cv2
- import pickle
- import numpy as np
- import matplotlib.pyplot as plt
- import seaborn as sns
- from tqdm import tqdm
- from sklearn.preprocessing import OneHotEncoder
- from sklearn.metrics import confusion_matrix
- from keras.models import Model, load_model
- from keras.layers import Dense, Input, Conv2D, MaxPool2D, Flatten
- from keras.preprocessing.image import ImageDataGenerator
- np.random.seed(22)
定义预处理函数
以下两个函数来从每个文件夹加载图像数据。
首先,所有图像的大小都将调整为200 x 200像素。这很重要,因为所有文件夹中的图像都具有不同的维度,而神经网络只能接受具有固定阵列大小的数据。接下来,默认情况所有图像都存储在3个彩色通道中,但本次试验我们所用的数据集的图片均为灰度图,因此,这里需要将所有这些彩色图像转换为灰度。( 很重要的点!)
其中的这句话:
if image == '.DS_Store' : continue如果您是Mac电脑,需要加上,Windows电脑的删去即可,当然不删也不会有任何的影响。
- def load_normal(norm_path):
- norm_files = np.array(os.listdir(norm_path))
- norm_labels = np.array(['normal']*len(norm_files))
- norm_images = []
- for image in tqdm(norm_files):
- # Read image
- if image == '.DS_Store' : continue
- image = cv2.imread(norm_path + image)
- # Resize image to 200x200 px
- image = cv2.resize(image, dsize=(200,200))
- # Convert to grayscale
- image = cv2.cvtColor(image, cv2.COLOR_BGR2GRAY)
- norm_images.append(image)
- norm_images = np.array(norm_images)
- return norm_images, norm_labels
- def load_pneumonia(pneu_path):
- pneu_files = np.array(os.listdir(pneu_path))
- pneu_labels = np.array([pneu_file.split('_')[1] for pneu_file in pneu_files])
- pneu_images = []
- for image in tqdm(pneu_files):
- # Read image
- if image == '.DS_Store' : continue
- image = cv2.imread(pneu_path + image)
- # Resize image to 200x200 px
- image = cv2.resize(image, dsize=(200,200))
- # Convert to grayscale
- image = cv2.cvtColor(image, cv2.COLOR_BGR2GRAY)
- pneu_images.append(image)
- pneu_images = np.array(pneu_images)
- return pneu_images, pneu_labels
加载数据集路径
- norm_images, norm_labels = load_normal('/Users/liqun/Desktop/KS/MyPython/DataSet/chest_xray/train/NORMAL/')
- pneu_images, pneu_labels = load_pneumonia('/Users/liqun/Desktop/KS/MyPython/DataSet/chest_xray/train/PNEUMONIA/')
加载训练集的图像和标签
- X_train = np.append(norm_images, pneu_images, axis=0)
- y_train = np.append(norm_labels, pneu_labels)
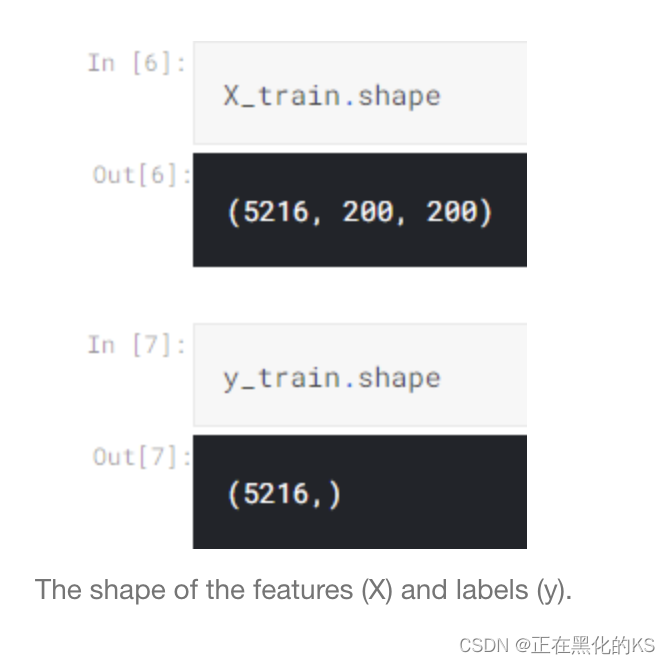
在Jupyter Notebook中可以输入这两个语句查看是否成功导入了数据

同理,可以查看每一个类别分别有多少张图片
部分图片展示
这个展示并不是必须的,只是这里可以用于检查图片的颜色通道、尺寸等是否已经转化为期待的样子了。
- fig, axes = plt.subplots(ncols=7, nrows=2, figsize=(16, 4))
- indices = np.random.choice(len(X_train), 14)
- counter = 0
- for i in range(2):
- for j in range(7):
- axes[i,j].set_title(y_train[indices[counter]])
- axes[i,j].imshow(X_train[indices[counter]], cmap='gray')
- axes[i,j].get_xaxis().set_visible(False)
- axes[i,j].get_yaxis().set_visible(False)
- counter += 1
- plt.show()
加载测试图片
和上方加载训练集的图片过程类似,函数也是相同的,测试集共有624张图片
- print('Loading test images')
- # Do the exact same thing as what we have done on train data
- norm_images_test, norm_labels_test = load_normal('/Users/liqun/Desktop/KS/MyPython/DataSet/chest_xray/test/NORMAL/')
- pneu_images_test, pneu_labels_test = load_pneumonia('/Users/liqun/Desktop/KS/MyPython/DataSet/chest_xray/test/PNEUMONIA/')
- X_test = np.append(norm_images_test, pneu_images_test, axis=0)
- y_test = np.append(norm_labels_test, pneu_labels_test)
Pickle存储已处理好的图片
由于这里处理图片格式就花费大量的时间,所以可以使用pickle库,它可以存储这些转化好的图片,下次再使用的时候就不需要重新重复上面的操作了
- with open('pneumonia_data.pickle', 'wb') as f:
- pickle.dump((X_train, X_test, y_train, y_test), f)
- with open('pneumonia_data.pickle', 'rb') as f:
- (X_train, X_test, y_train, y_test) = pickle.load(f)
标签预处理
此时,两个Y变量都由以字符串数据类型编写的正常变量、细菌或病毒组成。但是,神经网络无法接受这样的标签。因此,我们需要将其转换为单热格式。
- y_train = y_train[:, np.newaxis]
- y_test = y_test[:, np.newaxis]
- one_hot_encoder = OneHotEncoder(sparse=False)
- y_train_one_hot = one_hot_encoder.fit_transform(y_train)
- y_test_one_hot = one_hot_encoder.transform(y_test)
将X转化为(None, 200,200,1)的格式
- X_train = X_train.reshape(X_train.shape[0], X_train.shape[1], X_train.shape[2], 1)
- X_test = X_test.reshape(X_test.shape[0], X_test.shape[1], X_test.shape[2], 1)
数据增强
增加数据指的是,我们将通过在每个样本上创建更多具有某种随机性的样本来增加用于训练的数据数量。这些随机性可能包括翻译、旋转、缩放、剪切和翻转。这种技术能够帮助我们的神经网络分类器减少过度拟合。
- datagen = ImageDataGenerator(
- rotation_range = 10,
- zoom_range = 0.1,
- width_shift_range = 0.1,
- height_shift_range = 0.1)
- datagen.fit(X_train)
- train_gen = datagen.flow(X_train, y_train_one_hot, batch_size=32)
如有需要,可以了解一下ImageDataGenerator函数的参数构成:
构建CNN神经网络
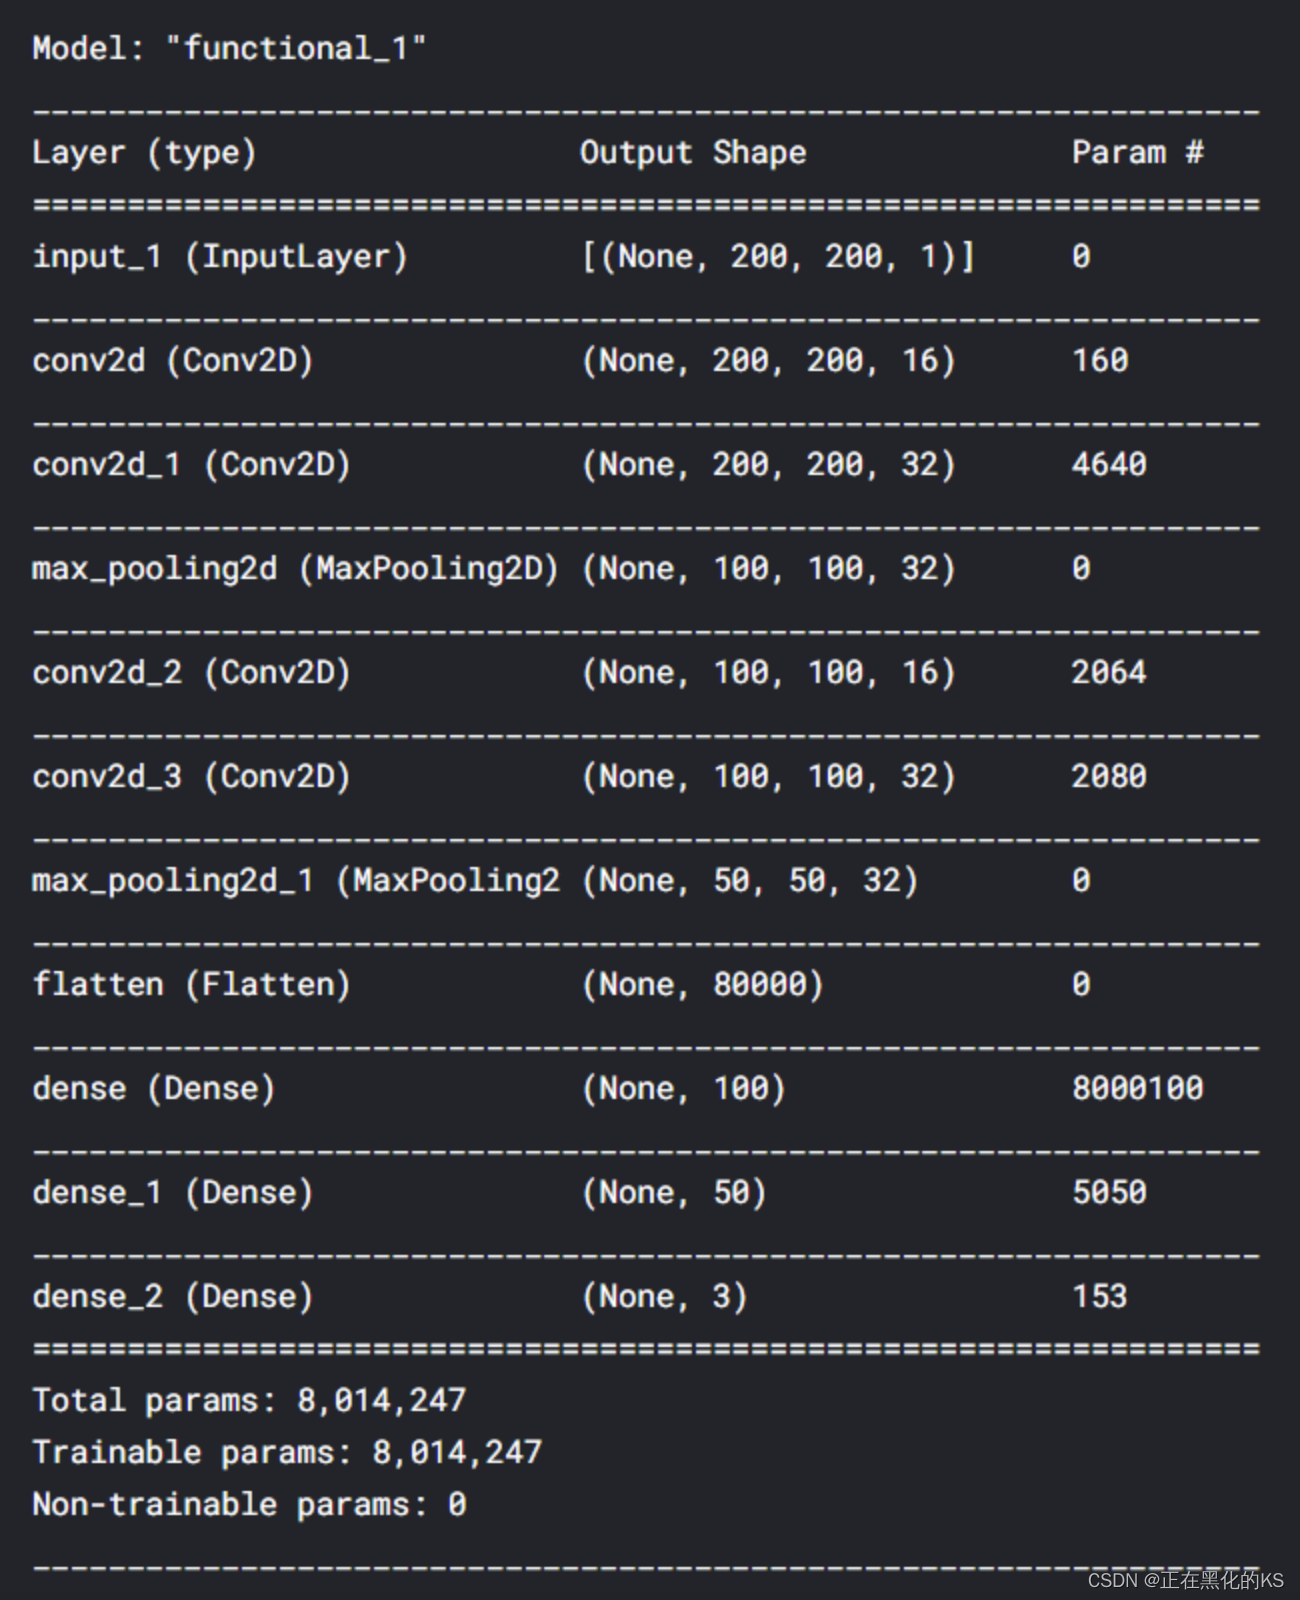
我们需要确保第一层接受与图像大小完全相同的形状。值得注意的是,我们需要定义的只是(宽度、高度、通道),而不是(样本、宽度、高度、通道)。
之后,该输入层连接到几个卷积池层,最终被扁平并连接到Dense层。模型中的所有隐藏层都在使用Relu激活函数,RelU的计算速度快,因此所需的训练时间短。最后,连接的最后一层是输出,它由3个具有softmax激活功能的神经元组成。这里使用softmax是因为我们希望输出是每个类的概率值。
- input1 = Input(shape=(X_train.shape[1], X_train.shape[2], 1))
- cnn = Conv2D(16, (3, 3), activation='relu', strides=(1, 1),
- padding='same')(input1)
- cnn = Conv2D(32, (3, 3), activation='relu', strides=(1, 1),
- padding='same')(cnn)
- cnn = MaxPool2D((2, 2))(cnn)
- cnn = Conv2D(16, (2, 2), activation='relu', strides=(1, 1),
- padding='same')(cnn)
- cnn = Conv2D(32, (2, 2), activation='relu', strides=(1, 1),
- padding='same')(cnn)
- cnn = MaxPool2D((2, 2))(cnn)
- cnn = Flatten()(cnn)
- cnn = Dense(100, activation='relu')(cnn)
- cnn = Dense(50, activation='relu')(cnn)
- output1 = Dense(3, activation='softmax')(cnn)
- model = Model(inputs=input1, outputs=output1)
展示CNN模型的详细信息
Model.complie
在构建模型后,现在我们使用categorical_crossentropy损失函数和Adam优化器编译神经网络。使用这个点损失函数的原因是,它是多类分类任务中常用的函数。而Adam作为优化器,是大多数神经网络任务中最小化损失值的最佳优化器。
- model.compile(loss='categorical_crossentropy',
- optimizer='adam', metrics=['acc'])
训练过程展示

一共迭代了30次,这里仅展示了最后四次的迭代结果
结果展示
- plt.figure(figsize=(8,6))
- plt.title('Accuracy scores')
- plt.plot(history.history['acc'])
- plt.plot(history.history['val_acc'])
- plt.legend(['acc', 'val_acc'])
- plt.show()
- plt.figure(figsize=(8,6))
- plt.title('Loss value')
- plt.plot(history.history['loss'])
- plt.plot(history.history['val_loss'])
- plt.legend(['loss', 'val_loss'])
- plt.show()
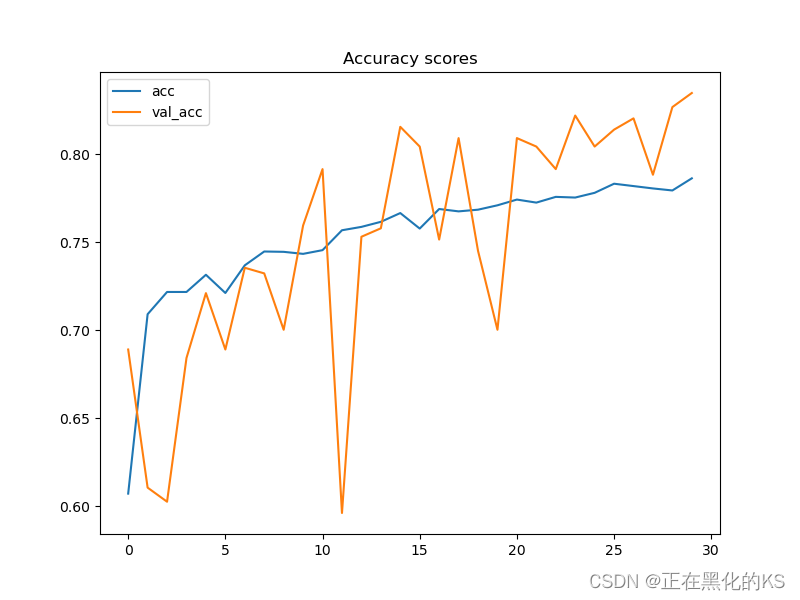
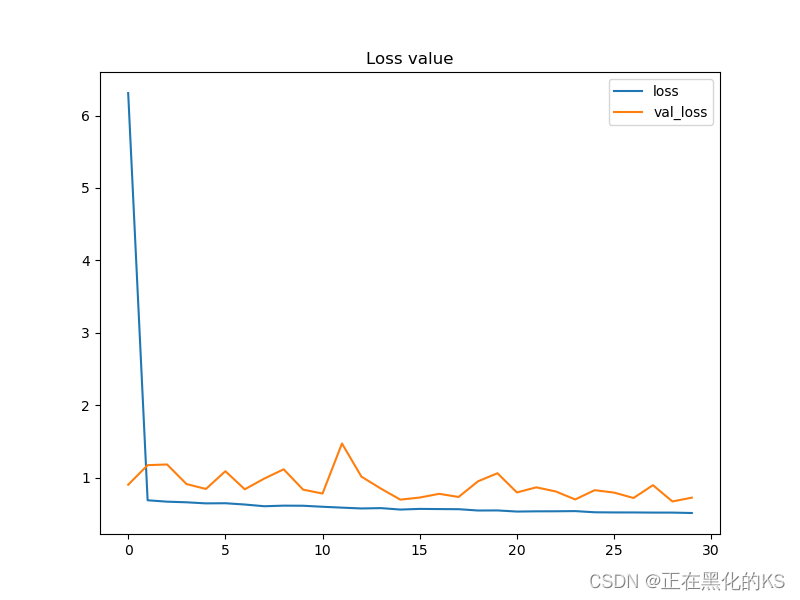
结果分析
由于我们前面将数据增强了,所以我们发现模型训练结果没有出现过拟合的状况,尽管accuracy的波动仍然存在,但整体的趋势是较为正常且能接受的。
模型评估
- predictions = model.predict(X_test)
- predictions = one_hot_encoder.inverse_transform(predictions)
- cm = confusion_matrix(y_test, predictions)
- classnames = ['bacteria', 'normal', 'virus']
- plt.figure(figsize=(8,8))
- plt.title('Confusion matrix')
- sns.heatmap(cm, cbar=False, xticklabels=classnames, yticklabels=classnames, fmt='d', annot=True, cmap=plt.cm.Blues)
- plt.xlabel('Predicted')
- plt.ylabel('Actual')
- plt.show()
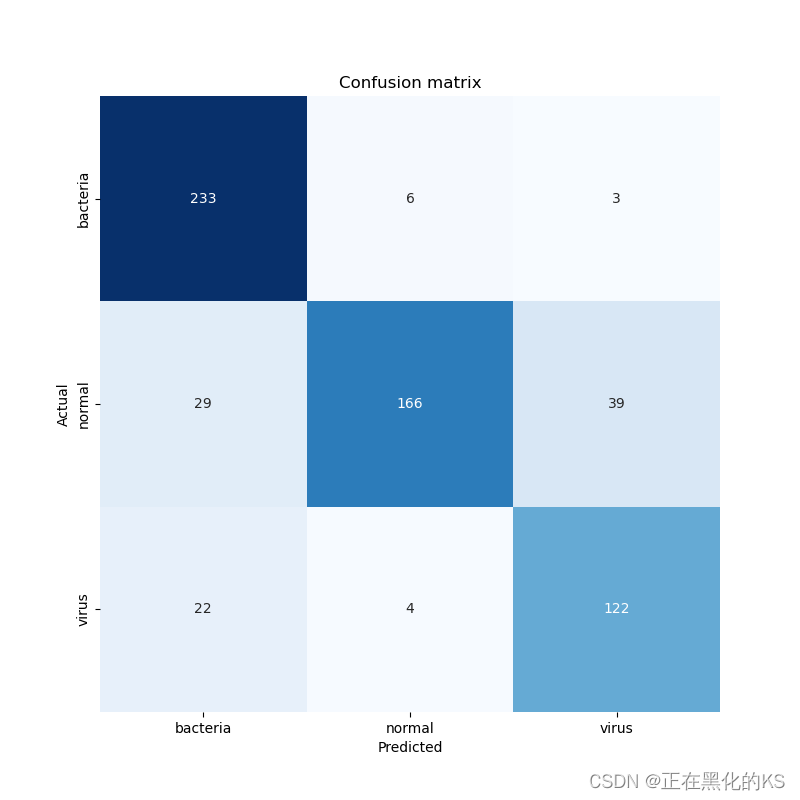
根据上面的混淆矩阵,我们可以看到22张病毒X射线图像被预测为细菌。这可能是因为这两种肺炎类型很难区分。但是,至少我们的模型能够很好地预测细菌引起的肺炎,因为242个样本中有233个被正确分类。
🫥 以上是本次深度学习实战的全部解析,以下是完整代码,需要请自取:
- import os
- import cv2
- import pickle # Used to save variables
- import numpy as np
- import matplotlib.pyplot as plt
- import seaborn as sns
- from tqdm import tqdm # Used to display progress bar
- from sklearn.preprocessing import OneHotEncoder
- from sklearn.metrics import confusion_matrix
- from keras.models import Model, load_model
- from keras.layers import Dense, Input, Conv2D, MaxPool2D, Flatten
- from keras.preprocessing.image import ImageDataGenerator # Used to generate images
- np.random.seed(22)
- # Do not forget to include the last slash
- def load_normal(norm_path):
- norm_files = np.array(os.listdir(norm_path))
- norm_labels = np.array(['normal']*len(norm_files))
- norm_images = []
- for image in tqdm(norm_files):
- # Read image
- if image == '.DS_Store' : continue
- image = cv2.imread(norm_path + image)
- # Resize image to 200x200 px
- image = cv2.resize(image, dsize=(200,200))
- # Convert to grayscale
- image = cv2.cvtColor(image, cv2.COLOR_BGR2GRAY)
- norm_images.append(image)
- norm_images = np.array(norm_images)
- return norm_images, norm_labels
- def load_pneumonia(pneu_path):
- pneu_files = np.array(os.listdir(pneu_path))
- pneu_labels = np.array([pneu_file.split('_')[1] for pneu_file in pneu_files])
- pneu_images = []
- for image in tqdm(pneu_files):
- # Read image
- if image == '.DS_Store' : continue
- image = cv2.imread(pneu_path + image)
- # Resize image to 200x200 px
- image = cv2.resize(image, dsize=(200,200))
- # Convert to grayscale
- image = cv2.cvtColor(image, cv2.COLOR_BGR2GRAY)
- pneu_images.append(image)
- pneu_images = np.array(pneu_images)
- return pneu_images, pneu_labels
- print('Loading images')
- # All images are stored in _images, all labels are in _labels
- norm_images, norm_labels = load_normal('/Users/liqun/Desktop/KS/MyPython/DataSet/chest_xray/train/NORMAL/')
- pneu_images, pneu_labels = load_pneumonia('/Users/liqun/Desktop/KS/MyPython/DataSet/chest_xray/train/PNEUMONIA/')
- # Put all train images to X_train
- X_train = np.append(norm_images, pneu_images, axis=0)
- # Put all train labels to y_train
- y_train = np.append(norm_labels, pneu_labels)
- print(X_train.shape)
- print(y_train.shape)
- # Finding out the number of samples of each class
- print(np.unique(y_train, return_counts=True))
- # print('Display several images')
- fig, axes = plt.subplots(ncols=7, nrows=2, figsize=(16, 4))
- indices = np.random.choice(len(X_train), 14)
- counter = 0
- for i in range(2):
- for j in range(7):
- axes[i,j].set_title(y_train[indices[counter]])
- axes[i,j].imshow(X_train[indices[counter]], cmap='gray')
- axes[i,j].get_xaxis().set_visible(False)
- axes[i,j].get_yaxis().set_visible(False)
- counter += 1
- # plt.show()
- print('Loading test images')
- # Do the exact same thing as what we have done on train data
- norm_images_test, norm_labels_test = load_normal('/Users/liqun/Desktop/KS/MyPython/DataSet/chest_xray/test/NORMAL/')
- pneu_images_test, pneu_labels_test = load_pneumonia('/Users/liqun/Desktop/KS/MyPython/DataSet/chest_xray/test/PNEUMONIA/')
- X_test = np.append(norm_images_test, pneu_images_test, axis=0)
- y_test = np.append(norm_labels_test, pneu_labels_test)
- # Save the loaded images to pickle file for future use
- with open('pneumonia_data.pickle', 'wb') as f:
- pickle.dump((X_train, X_test, y_train, y_test), f)
- # Here's how to load it
- with open('pneumonia_data.pickle', 'rb') as f:
- (X_train, X_test, y_train, y_test) = pickle.load(f)
- print('Label preprocessing')
- # Create new axis on all y data
- y_train = y_train[:, np.newaxis]
- y_test = y_test[:, np.newaxis]
- # Initialize OneHotEncoder object
- one_hot_encoder = OneHotEncoder(sparse=False)
- # Convert all labels to one-hot
- y_train_one_hot = one_hot_encoder.fit_transform(y_train)
- y_test_one_hot = one_hot_encoder.transform(y_test)
- print('Reshaping X data')
- # Reshape the data into (no of samples, height, width, 1), where 1 represents a single color channel
- X_train = X_train.reshape(X_train.shape[0], X_train.shape[1], X_train.shape[2], 1)
- X_test = X_test.reshape(X_test.shape[0], X_test.shape[1], X_test.shape[2], 1)
- print('Data augmentation')
- # Generate new images with some randomness
- datagen = ImageDataGenerator(
- rotation_range = 10,
- zoom_range = 0.1,
- width_shift_range = 0.1,
- height_shift_range = 0.1)
- datagen.fit(X_train)
- train_gen = datagen.flow(X_train, y_train_one_hot, batch_size = 32)
- print('CNN')
- # Define the input shape of the neural network
- input_shape = (X_train.shape[1], X_train.shape[2], 1)
- print(input_shape)
- input1 = Input(shape=input_shape)
- cnn = Conv2D(16, (3, 3), activation='relu', strides=(1, 1),
- padding='same')(input1)
- cnn = Conv2D(32, (3, 3), activation='relu', strides=(1, 1),
- padding='same')(cnn)
- cnn = MaxPool2D((2, 2))(cnn)
- cnn = Conv2D(16, (2, 2), activation='relu', strides=(1, 1),
- padding='same')(cnn)
- cnn = Conv2D(32, (2, 2), activation='relu', strides=(1, 1),
- padding='same')(cnn)
- cnn = MaxPool2D((2, 2))(cnn)
- cnn = Flatten()(cnn)
- cnn = Dense(100, activation='relu')(cnn)
- cnn = Dense(50, activation='relu')(cnn)
- output1 = Dense(3, activation='softmax')(cnn)
- model = Model(inputs=input1, outputs=output1)
- model.compile(loss='categorical_crossentropy',
- optimizer='adam', metrics=['acc'])
- # Using fit_generator() instead of fit() because we are going to use data
- # taken from the generator. Note that the randomness is changing
- # on each epoch
- history = model.fit_generator(train_gen, epochs=30,
- validation_data=(X_test, y_test_one_hot))
- # Saving model
- model.save('pneumonia_cnn.h5')
- print('Displaying accuracy')
- plt.figure(figsize=(8,6))
- plt.title('Accuracy scores')
- plt.plot(history.history['acc'])
- plt.plot(history.history['val_acc'])
- plt.legend(['acc', 'val_acc'])
- plt.show()
- print('Displaying loss')
- plt.figure(figsize=(8,6))
- plt.title('Loss value')
- plt.plot(history.history['loss'])
- plt.plot(history.history['val_loss'])
- plt.legend(['loss', 'val_loss'])
- plt.show()
- # Predicting test data
- predictions = model.predict(X_test)
- print(predictions)
- predictions = one_hot_encoder.inverse_transform(predictions)
- print('Model evaluation')
- print(one_hot_encoder.categories_)
- classnames = ['bacteria', 'normal', 'virus']
- # Display confusion matrix
- cm = confusion_matrix(y_test, predictions)
- plt.figure(figsize=(8,8))
- plt.title('Confusion matrix')
- sns.heatmap(cm, cbar=False, xticklabels=classnames, yticklabels=classnames, fmt='d', annot=True, cmap=plt.cm.Blues)
- plt.xlabel('Predicted')
- plt.ylabel('Actual')
- plt.show()
🫥 本次实验所用到的数据集也为大家整理好了,从这里下载即可:
链接: https://pan.baidu.com/s/1h4Ve-YiXw0FyJDXCFlU1eA?pwd=qak4 提取码: qak4
———————————————————————————————————————————
码字不易
如果我的文章对你有帮助的话 麻烦留下赞哇 😋
感谢浏览!
-
相关阅读:
ESP32网络开发实例-HTTP-POST请求
【语音识别】高斯混合模型(GMM)说话人识别【含Matlab源码 574期】
关于前面文章的内容补充
贝锐向日葵亮相阿里云“云栖大会”:独创专利算法赋能全新云桌面
【Golang】判断某一类型是否实现指定接口的几种方法
应用于供暖、供水管道等场景的一种智能控制阀
【无标题】
自然语言处理基础——词表示
树【LeetCode】
Qt——对话框详解
- 原文地址:https://blog.csdn.net/m0_54689021/article/details/126495422