-
【深度学习21天学习挑战赛】7、卷积神经网络(CNN)医学领域应用——乳腺癌识别
活动地址:CSDN21天学习挑战赛
- 🍨 本文为🔗365天深度学习训练营 中的学习记录博客
- 🍦 参考文章地址: 🔗深度学习100例 | 第26天-卷积神经网络(CNN):乳腺癌识别
- 🍖 作者:K同学啊
今天继续学习CNN,案例是深度学习在医学领域的应用,乳腺癌是女性最常见的癌症形式,浸润性导管癌 (IDC) 是最常见的乳腺癌形式。准确识别和分类乳腺癌亚型是一项重要的临床任务,利用深度学习方法识别可以有效节省时间并减少错误。(完整源码附后)
1、数据导入、配置
数据集是由多张以 40 倍扫描的乳腺癌 (BCa) 标本的完整载玻片图像组成。
分为两类,即:正常细胞、乳腺癌细胞
图片总数为: 134031.1 导入数据
import matplotlib.pyplot as plt import os,PIL,pathlib import numpy as np import pandas as pd import warnings from tensorflow import keras import pathlib warnings.filterwarnings("ignore") plt.rcParams['font.sans-serif'] = ['SimHei'] plt.rcParams['axes.unicode_minus'] = False data_dir = "./26-data" data_dir = pathlib.Path(data_dir) image_count = len(list(data_dir.glob('*/*'))) print("图片总数为:",image_count) batch_size = 16 img_height = 50 img_width = 50 train_ds = tf.keras.preprocessing.image_dataset_from_directory( data_dir, validation_split=0.2, subset="training", seed=12, image_size=(img_height, img_width), batch_size=batch_size) val_ds = tf.keras.preprocessing.image_dataset_from_directory( data_dir, validation_split=0.2, subset="validation", seed=12, image_size=(img_height, img_width), batch_size=batch_size) class_names = train_ds.class_names print(class_names) for image_batch, labels_batch in train_ds: print(image_batch.shape) print(labels_batch.shape) break- 1
- 2
- 3
- 4
- 5
- 6
- 7
- 8
- 9
- 10
- 11
- 12
- 13
- 14
- 15
- 16
- 17
- 18
- 19
- 20
- 21
- 22
- 23
- 24
- 25
- 26
- 27
- 28
- 29
- 30
- 31
- 32
- 33
- 34
- 35
- 36
- 37
- 38
- 39
- 40

1.2 配置数据集
AUTOTUNE = tf.data.experimental.AUTOTUNE def train_preprocessing(image,label): return (image/255.0,label) train_ds = ( train_ds.cache() .shuffle(1000) .map(train_preprocessing) # 这里可以设置预处理函数 # .batch(batch_size) # 在image_dataset_from_directory处已经设置了batch_size .prefetch(buffer_size=AUTOTUNE) ) val_ds = ( val_ds.cache() .shuffle(1000) .map(train_preprocessing) # 这里可以设置预处理函数 # .batch(batch_size) # 在image_dataset_from_directory处已经设置了batch_size .prefetch(buffer_size=AUTOTUNE) )- 1
- 2
- 3
- 4
- 5
- 6
- 7
- 8
- 9
- 10
- 11
- 12
- 13
- 14
- 15
- 16
- 17
- 18
- 19
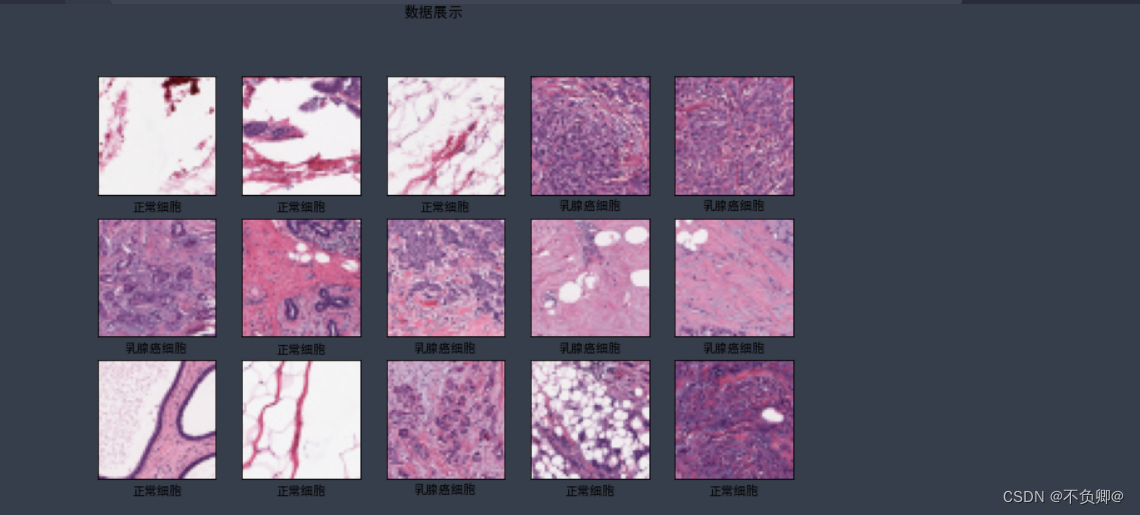
1.3 可视化预览数据
plt.figure(figsize=(10, 8)) # 图形的宽为10高为5 plt.suptitle("数据展示") class_names = ["乳腺癌细胞","正常细胞"] for images, labels in train_ds.take(1): for i in range(15): plt.subplot(4, 5, i + 1) plt.xticks([]) plt.yticks([]) plt.grid(False) # 显示图片 plt.imshow(images[i]) # 显示标签 plt.xlabel(class_names[labels[i]-1]) plt.show()- 1
- 2
- 3
- 4
- 5
- 6
- 7
- 8
- 9
- 10
- 11
- 12
- 13
- 14
- 15
- 16
- 17
- 18

2、模型的构建、编译、训练
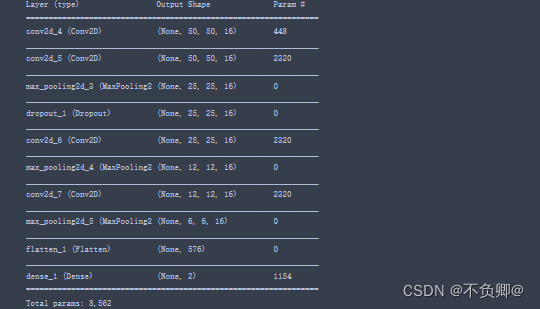
2.1 构建模型
model = tf.keras.Sequential([ tf.keras.layers.Conv2D(filters=16,kernel_size=(3,3),padding="same",activation="relu",input_shape=[img_width, img_height, 3]), tf.keras.layers.Conv2D(filters=16,kernel_size=(3,3),padding="same",activation="relu"), tf.keras.layers.MaxPooling2D((2,2)), tf.keras.layers.Dropout(0.5), tf.keras.layers.Conv2D(filters=16,kernel_size=(3,3),padding="same",activation="relu"), tf.keras.layers.MaxPooling2D((2,2)), tf.keras.layers.Conv2D(filters=16,kernel_size=(3,3),padding="same",activation="relu"), tf.keras.layers.MaxPooling2D((2,2)), tf.keras.layers.Flatten(), tf.keras.layers.Dense(2, activation="softmax") ]) model.summary()- 1
- 2
- 3
- 4
- 5
- 6
- 7
- 8
- 9
- 10
- 11
- 12
- 13
- 14

2.2 编译模型
model.compile(optimizer="adam", loss='sparse_categorical_crossentropy', metrics=['accuracy'])- 1
- 2
- 3
2.3 训练模型
from tensorflow.keras.callbacks import ModelCheckpoint, Callback, EarlyStopping, ReduceLROnPlateau, LearningRateScheduler NO_EPOCHS = 100 PATIENCE = 5 VERBOSE = 1 # 设置动态学习率 annealer = LearningRateScheduler(lambda x: 1e-3 * 0.99 ** (x+NO_EPOCHS)) # 设置早停 earlystopper = EarlyStopping(monitor='loss', patience=PATIENCE, verbose=VERBOSE) # checkpointer = ModelCheckpoint('best_model.h5', monitor='val_accuracy', verbose=VERBOSE, save_best_only=True, save_weights_only=True) train_model = model.fit(train_ds, epochs=NO_EPOCHS, verbose=1, validation_data=val_ds, callbacks=[earlystopper, checkpointer, annealer])- 1
- 2
- 3
- 4
- 5
- 6
- 7
- 8
- 9
- 10
- 11
- 12
- 13
- 14
- 15
- 16
- 17
- 18
- 19
- 20
- 21
- 22
- 23
- 24
训练结果:
Epoch 90/100 670/671 [============================>.] - ETA: 0s - loss: 0.2175 - accuracy: 0.9089 Epoch 00090: val_accuracy did not improve from 0.89851 671/671 [==============================] - 19s 29ms/step - loss: 0.2174 - accuracy: 0.9089 - val_loss: 0.3031 - val_accuracy: 0.8649 Epoch 91/100 670/671 [============================>.] - ETA: 0s - loss: 0.2185 - accuracy: 0.9083 Epoch 00091: val_accuracy did not improve from 0.89851 671/671 [==============================] - 19s 29ms/step - loss: 0.2183 - accuracy: 0.9083 - val_loss: 0.3082 - val_accuracy: 0.8701 Epoch 92/100 671/671 [==============================] - ETA: 0s - loss: 0.2160 - accuracy: 0.9074 Epoch 00092: val_accuracy did not improve from 0.89851 671/671 [==============================] - 18s 27ms/step - loss: 0.2160 - accuracy: 0.9074 - val_loss: 0.2741 - val_accuracy: 0.8869 Epoch 93/100 671/671 [==============================] - ETA: 0s - loss: 0.2165 - accuracy: 0.9103 Epoch 00093: val_accuracy did not improve from 0.89851 671/671 [==============================] - 20s 30ms/step - loss: 0.2165 - accuracy: 0.9103 - val_loss: 0.2739 - val_accuracy: 0.8877 Epoch 94/100 671/671 [==============================] - ETA: 0s - loss: 0.2152 - accuracy: 0.9080 Epoch 00094: val_accuracy did not improve from 0.89851 671/671 [==============================] - 18s 27ms/step - loss: 0.2152 - accuracy: 0.9080 - val_loss: 0.2740 - val_accuracy: 0.8866 Epoch 95/100 671/671 [==============================] - ETA: 0s - loss: 0.2138 - accuracy: 0.9092 Epoch 00095: val_accuracy did not improve from 0.89851 671/671 [==============================] - 18s 27ms/step - loss: 0.2138 - accuracy: 0.9092 - val_loss: 0.3400 - val_accuracy: 0.8541 Epoch 96/100 671/671 [==============================] - ETA: 0s - loss: 0.2149 - accuracy: 0.9092 Epoch 00096: val_accuracy did not improve from 0.89851 671/671 [==============================] - 18s 26ms/step - loss: 0.2149 - accuracy: 0.9092 - val_loss: 0.2897 - val_accuracy: 0.8806 Epoch 97/100 670/671 [============================>.] - ETA: 0s - loss: 0.2123 - accuracy: 0.9110 Epoch 00097: val_accuracy did not improve from 0.89851 671/671 [==============================] - 18s 27ms/step - loss: 0.2122 - accuracy: 0.9110 - val_loss: 0.3222 - val_accuracy: 0.8593 Epoch 98/100 671/671 [==============================] - ETA: 0s - loss: 0.2120 - accuracy: 0.9107 Epoch 00098: val_accuracy did not improve from 0.89851 671/671 [==============================] - 19s 28ms/step - loss: 0.2120 - accuracy: 0.9107 - val_loss: 0.3023 - val_accuracy: 0.8757 Epoch 99/100 670/671 [============================>.] - ETA: 0s - loss: 0.2113 - accuracy: 0.9114 Epoch 00099: val_accuracy did not improve from 0.89851 671/671 [==============================] - 19s 29ms/step - loss: 0.2112 - accuracy: 0.9114 - val_loss: 0.2606 - val_accuracy: 0.8918 Epoch 100/100 670/671 [============================>.] - ETA: 0s - loss: 0.2130 - accuracy: 0.9112 Epoch 00100: val_accuracy did not improve from 0.89851 671/671 [==============================] - 19s 28ms/step - loss: 0.2131 - accuracy: 0.9112 - val_loss: 0.2939 - val_accuracy: 0.8799- 1
- 2
- 3
- 4
- 5
- 6
- 7
- 8
- 9
- 10
- 11
- 12
- 13
- 14
- 15
- 16
- 17
- 18
- 19
- 20
- 21
- 22
- 23
- 24
- 25
- 26
- 27
- 28
- 29
- 30
- 31
- 32
- 33
- 34
- 35
- 36
- 37
- 38
- 39
- 40
- 41
- 42
- 43
- 44
3、评估模型
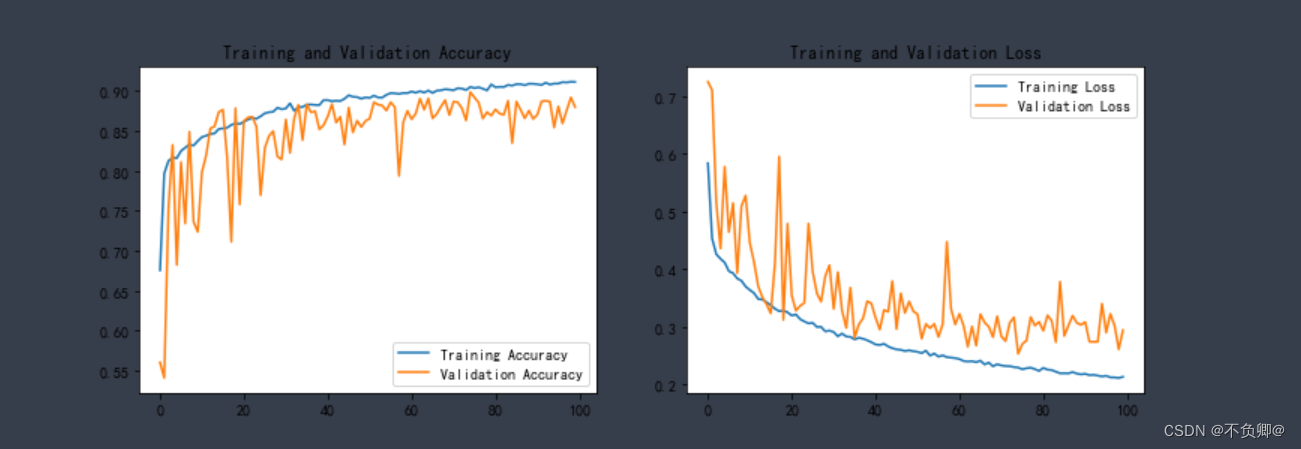
3.1 Accuracy与Loss图
acc = train_model.history['accuracy'] val_acc = train_model.history['val_accuracy'] loss = train_model.history['loss'] val_loss = train_model.history['val_loss'] epochs_range = range(len(acc)) plt.figure(figsize=(12, 4)) plt.subplot(1, 2, 1) plt.plot(epochs_range, acc, label='Training Accuracy') plt.plot(epochs_range, val_acc, label='Validation Accuracy') plt.legend(loc='lower right') plt.title('Training and Validation Accuracy') plt.subplot(1, 2, 2) plt.plot(epochs_range, loss, label='Training Loss') plt.plot(epochs_range, val_loss, label='Validation Loss') plt.legend(loc='upper right') plt.title('Training and Validation Loss') plt.show()- 1
- 2
- 3
- 4
- 5
- 6
- 7
- 8
- 9
- 10
- 11
- 12
- 13
- 14
- 15
- 16
- 17
- 18
- 19
- 20
- 21
- 22

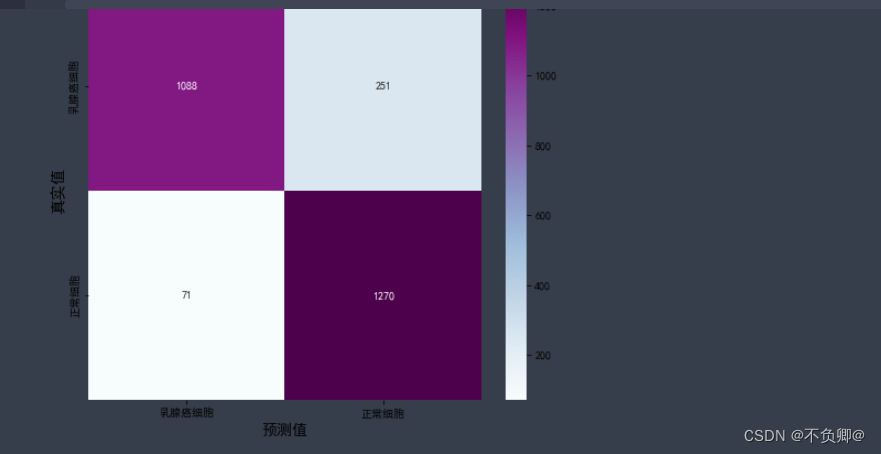
3.2 混淆矩阵
from sklearn.metrics import confusion_matrix import seaborn as sns import pandas as pd # 定义一个绘制混淆矩阵图的函数 def plot_cm(labels, predictions): # 生成混淆矩阵 conf_numpy = confusion_matrix(labels, predictions) # 将矩阵转化为 DataFrame conf_df = pd.DataFrame(conf_numpy, index=class_names ,columns=class_names) plt.figure(figsize=(8,7)) sns.heatmap(conf_df, annot=True, fmt="d", cmap="BuPu") plt.title('混淆矩阵',fontsize=15) plt.ylabel('真实值',fontsize=14) plt.xlabel('预测值',fontsize=14) val_pre = [] val_label = [] for images, labels in val_ds:#这里可以取部分验证数据(.take(1))生成混淆矩阵 for image, label in zip(images, labels): # 需要给图片增加一个维度 img_array = tf.expand_dims(image, 0) # 使用模型预测图片中的人物 prediction = model.predict(img_array) val_pre.append(class_names[np.argmax(prediction)]) val_label.append(class_names[label]) plot_cm(val_label, val_pre)- 1
- 2
- 3
- 4
- 5
- 6
- 7
- 8
- 9
- 10
- 11
- 12
- 13
- 14
- 15
- 16
- 17
- 18
- 19
- 20
- 21
- 22
- 23
- 24
- 25
- 26
- 27
- 28
- 29
- 30
- 31
- 32
- 33
- 34

3.3 各项指标评估
from sklearn import metrics def test_accuracy_report(model): print(metrics.classification_report(val_label, val_pre, target_names=class_names)) score = model.evaluate(val_ds, verbose=0) print('Loss function: %s, accuracy:' % score[0], score[1]) test_accuracy_report(model)- 1
- 2
- 3
- 4
- 5
- 6
- 7
- 8

完整源码
import tensorflow as tf import matplotlib.pyplot as plt import os,PIL,pathlib import numpy as np import pandas as pd import warnings from tensorflow import keras warnings.filterwarnings("ignore") #忽略警告信息 plt.rcParams['font.sans-serif'] = ['SimHei'] # 用来正常显示中文标签 plt.rcParams['axes.unicode_minus'] = False # 用来正常显示负号 import pathlib data_dir = "./26-data" data_dir = pathlib.Path(data_dir) image_count = len(list(data_dir.glob('*/*'))) print("图片总数为:",image_count) batch_size = 16 img_height = 50 img_width = 50 """ 关于image_dataset_from_directory()的详细介绍可以参考文章:https://mtyjkh.blog.csdn.net/article/details/117018789 """ train_ds = tf.keras.preprocessing.image_dataset_from_directory( data_dir, validation_split=0.2, subset="training", seed=12, image_size=(img_height, img_width), batch_size=batch_size) """ 关于image_dataset_from_directory()的详细介绍可以参考文章:https://mtyjkh.blog.csdn.net/article/details/117018789 """ val_ds = tf.keras.preprocessing.image_dataset_from_directory( data_dir, validation_split=0.2, subset="validation", seed=12, image_size=(img_height, img_width), batch_size=batch_size) class_names = train_ds.class_names print(class_names) for image_batch, labels_batch in train_ds: print(image_batch.shape) print(labels_batch.shape) break AUTOTUNE = tf.data.experimental.AUTOTUNE # 这里如果是 tf2.6 或者报错,使用 AUTOTUNE = tf.data.experimental.AUTOTUNE def train_preprocessing(image,label): return (image/255.0,label) train_ds = ( train_ds.cache() .shuffle(1000) .map(train_preprocessing) # 这里可以设置预处理函数 # .batch(batch_size) # 在image_dataset_from_directory处已经设置了batch_size .prefetch(buffer_size=AUTOTUNE) ) val_ds = ( val_ds.cache() .shuffle(1000) .map(train_preprocessing) # 这里可以设置预处理函数 # .batch(batch_size) # 在image_dataset_from_directory处已经设置了batch_size .prefetch(buffer_size=AUTOTUNE) ) plt.figure(figsize=(10, 8)) # 图形的宽为10高为5 plt.suptitle("数据展示") class_names = ["乳腺癌细胞","正常细胞"] for images, labels in train_ds.take(1): for i in range(15): plt.subplot(4, 5, i + 1) plt.xticks([]) plt.yticks([]) plt.grid(False) # 显示图片 plt.imshow(images[i]) # 显示标签 plt.xlabel(class_names[labels[i]-1]) plt.show() import tensorflow as tf model = tf.keras.Sequential([ tf.keras.layers.Conv2D(filters=16,kernel_size=(3,3),padding="same",activation="relu",input_shape=[img_width, img_height, 3]), tf.keras.layers.Conv2D(filters=16,kernel_size=(3,3),padding="same",activation="relu"), tf.keras.layers.MaxPooling2D((2,2)), tf.keras.layers.Dropout(0.5), tf.keras.layers.Conv2D(filters=16,kernel_size=(3,3),padding="same",activation="relu"), tf.keras.layers.MaxPooling2D((2,2)), tf.keras.layers.Conv2D(filters=16,kernel_size=(3,3),padding="same",activation="relu"), tf.keras.layers.MaxPooling2D((2,2)), tf.keras.layers.Flatten(), tf.keras.layers.Dense(2, activation="softmax") ]) model.summary() model.compile(optimizer="adam", loss='sparse_categorical_crossentropy', metrics=['accuracy']) from tensorflow.keras.callbacks import ModelCheckpoint, Callback, EarlyStopping, ReduceLROnPlateau, LearningRateScheduler NO_EPOCHS = 100 PATIENCE = 5 VERBOSE = 1 # 设置动态学习率 annealer = LearningRateScheduler(lambda x: 1e-3 * 0.99 ** (x+NO_EPOCHS)) # 设置早停 earlystopper = EarlyStopping(monitor='loss', patience=PATIENCE, verbose=VERBOSE) # checkpointer = ModelCheckpoint('best_model.h5', monitor='val_accuracy', verbose=VERBOSE, save_best_only=True, save_weights_only=True) train_model = model.fit(train_ds, epochs=NO_EPOCHS, verbose=1, validation_data=val_ds, callbacks=[earlystopper, checkpointer, annealer]) acc = train_model.history['accuracy'] val_acc = train_model.history['val_accuracy'] loss = train_model.history['loss'] val_loss = train_model.history['val_loss'] epochs_range = range(len(acc)) plt.figure(figsize=(12, 4)) plt.subplot(1, 2, 1) plt.plot(epochs_range, acc, label='Training Accuracy') plt.plot(epochs_range, val_acc, label='Validation Accuracy') plt.legend(loc='lower right') plt.title('Training and Validation Accuracy') plt.subplot(1, 2, 2) plt.plot(epochs_range, loss, label='Training Loss') plt.plot(epochs_range, val_loss, label='Validation Loss') plt.legend(loc='upper right') plt.title('Training and Validation Loss') plt.show() from sklearn.metrics import confusion_matrix import seaborn as sns import pandas as pd # 定义一个绘制混淆矩阵图的函数 def plot_cm(labels, predictions): # 生成混淆矩阵 conf_numpy = confusion_matrix(labels, predictions) # 将矩阵转化为 DataFrame conf_df = pd.DataFrame(conf_numpy, index=class_names ,columns=class_names) plt.figure(figsize=(8,7)) sns.heatmap(conf_df, annot=True, fmt="d", cmap="BuPu") plt.title('混淆矩阵',fontsize=15) plt.ylabel('真实值',fontsize=14) plt.xlabel('预测值',fontsize=14) val_pre = [] val_label = [] for images, labels in val_ds:#这里可以取部分验证数据(.take(1))生成混淆矩阵 for image, label in zip(images, labels): # 需要给图片增加一个维度 img_array = tf.expand_dims(image, 0) # 使用模型预测图片中的人物 prediction = model.predict(img_array) val_pre.append(class_names[np.argmax(prediction)]) val_label.append(class_names[label]) plot_cm(val_label, val_pre) from sklearn import metrics def test_accuracy_report(model): print(metrics.classification_report(val_label, val_pre, target_names=class_names)) score = model.evaluate(val_ds, verbose=0) print('Loss function: %s, accuracy:' % score[0], score[1]) test_accuracy_report(model)- 1
- 2
- 3
- 4
- 5
- 6
- 7
- 8
- 9
- 10
- 11
- 12
- 13
- 14
- 15
- 16
- 17
- 18
- 19
- 20
- 21
- 22
- 23
- 24
- 25
- 26
- 27
- 28
- 29
- 30
- 31
- 32
- 33
- 34
- 35
- 36
- 37
- 38
- 39
- 40
- 41
- 42
- 43
- 44
- 45
- 46
- 47
- 48
- 49
- 50
- 51
- 52
- 53
- 54
- 55
- 56
- 57
- 58
- 59
- 60
- 61
- 62
- 63
- 64
- 65
- 66
- 67
- 68
- 69
- 70
- 71
- 72
- 73
- 74
- 75
- 76
- 77
- 78
- 79
- 80
- 81
- 82
- 83
- 84
- 85
- 86
- 87
- 88
- 89
- 90
- 91
- 92
- 93
- 94
- 95
- 96
- 97
- 98
- 99
- 100
- 101
- 102
- 103
- 104
- 105
- 106
- 107
- 108
- 109
- 110
- 111
- 112
- 113
- 114
- 115
- 116
- 117
- 118
- 119
- 120
- 121
- 122
- 123
- 124
- 125
- 126
- 127
- 128
- 129
- 130
- 131
- 132
- 133
- 134
- 135
- 136
- 137
- 138
- 139
- 140
- 141
- 142
- 143
- 144
- 145
- 146
- 147
- 148
- 149
- 150
- 151
- 152
- 153
- 154
- 155
- 156
- 157
- 158
- 159
- 160
- 161
- 162
- 163
- 164
- 165
- 166
- 167
- 168
- 169
- 170
- 171
- 172
- 173
- 174
- 175
- 176
- 177
- 178
- 179
- 180
- 181
- 182
- 183
- 184
- 185
- 186
- 187
- 188
- 189
- 190
- 191
- 192
- 193
- 194
- 195
- 196
- 197
- 198
- 199
- 200
- 201
- 202
- 203
-
相关阅读:
HWS-2022 夏令营线上赛 WP
Everest Group发布《2023年RPA供应商评估报告》:2家中国厂商持续上榜
元宇宙会成为IPv6的拐点吗?
es进阶语法查询
BL808:【M1s DOCK开发板】与LVGL 使用体验
自定义springboot starter,你学废了吗
微服务从代码到k8s部署应有尽有系列(二、网关)
es各种报错问题及解决方案20231121
我们又重写了一个关键服务
KingbaseES ksql使用指南
- 原文地址:https://blog.csdn.net/m0_48300767/article/details/126375619
