-
【图像分割】基于和声搜索算法实现图像多级阈值分割附matlab代码
1 内容介绍
本文介绍了一种基于和声搜索算法(HSA)的多级阈值(MT)算法。 HSA 是一种进化方法,其灵感来自音乐家在演奏时即兴创作新的和声。 与其他进化算法不同,HSA 展示了有趣的搜索能力,仍然保持较低的计算开销。 所提出的算法将来自图像直方图中可行搜索空间的随机样本编码为候选解决方案,而考虑 Otsu 或 Kapur 方法所采用的目标函数来评估它们的质量。 在这些目标值的指导下,候选解集通过 HSA 算子进行演进,直到找到最优解。 实验结果证明了所提出的数字图像分割方法的高性能。
2 仿真代码
%Intructions:
% I -> Original Image, could be RGB or Gray Scale
% level -> Number of threshold to find
% This version works with KAPUR as fitness function.
close all
clear all
% Se carga la imagen RGB o escala de grises
I1 = imread('Picture 148710088.jpg');
I=rgb2gray(I1);
level = 3;
% Se obtienen los histogramas si la imagen es RGB uno por cada canal si es
% en escala de grises solamente un historgrama.
if size(I,3) == 1 %grayscale image
[n_countR, x_valueR] = imhist(I(:,:,1));
elseif size(I,3) == 3 %RGB image
%histograma para cada canal RGB
[n_countR, x_valueR] = imhist(I(:,:,1));
[n_countG, x_valueG] = imhist(I(:,:,2));
[n_countB, x_valueB] = imhist(I(:,:,3));
end
Nt = size(I,1) * size(I,2); %Cantidad total de pixeles en la imagen RENG X COL
%Lmax niveles de color a segmentar 0 - 256
Lmax = 256; %256 different maximum levels are considered in an image (i.e., 0 to 255)
% Distribucion de probabilidades de cada nivel de intensidad del histograma 0 - 256
for i = 1:Lmax
if size(I,3) == 1
%grayscale image
probR(i) = n_countR(i) / Nt;
elseif size(I,3) == 3
%RGB image
probR(i) = n_countR(i) / Nt;
probG(i) = n_countG(i) / Nt;
probB(i) = n_countB(i) / Nt;
end
end
%%%%%%%%%%%%%%%%%%%%%%%%%%%%%%%%%%%%%%%%%%%%%%%%%%%%%%%%%%%%%%%%%%%%%%%%%%%
% Parametros del problema de segmentacion
N_PAR = level; %number of thresholds (number of levels-1) (dimensiones)
ndim = N_PAR;
%Parametros Harmony Search %%%%%%%%%%%%%%%%%%%%%%%%%%%%%%%%%%%%%%%%%%%%%%%%
MaxAttempt = 25000; % Max number of Attempt
% Initial parameter setting
HS_size = 50; %Length of solution vector
HMacceptRate = 0.95; %HM Accepting Rate
PArate = 0.5; %Pitch Adjusting rate
if size(I,3) == 1
%Imagen escala de grises
range = ones(ndim,2);
range(:,2) = range(:,2) * Lmax;
%initializa harmony memory
HM = zeros(HS_size,ndim);
% Pitch range for pitch adjusting
pa_range = ones(ndim);
pa_range = pa_range * 100;
elseif size(I,3) == 3
%Imagen RGB
range = ones(ndim,2);
range(:,2) = range(:,2) * Lmax;
%IR
xR = zeros(HS_size,ndim);
%IG
xG = zeros(HS_size,ndim);
%IB
xB = zeros(HS_size,ndim);
end
C_Func = 0;
tic
%%%%%%%%%%%%%%%%%%%%%%%%%%%%%%%%%%%%%%%%%%%%%%%%%%%%%%%%%%%%%%%%%%%%%%%%%%%
% Generating Initial Solution Vector
for i = 1:HS_size,
for j = 1:ndim,
x(j) = range(j,1) + (range(j,2) - range(j,1)) * rand;
end
x = fix(sort(x));
HM(i, :) = x;
end %% for i
%evalua x en la funcion objetivo
%[HMbest, fitBestR] = fitnessIMG(I, HS_size, Lmax, level, HM, probR);
% C_Func = length(HMbest);
%evalua x en la funcion objetivo
x = fix(sort(x));
%evalua x en la funcion objetivo
%[fbest, fitBestR] = fitnessIMG(I, 1, Lmax, level, x, probR);
fbest = Kapur(1,level,x,probR);
C_Func = C_Func + 1;
% Find the best in the HS solution vector
[HStemp, ii] = sort(HMbest, 'descend'); %Maximiza
HMbest = HMbest(ii);
HM = HM(ii,:);
% Updating the current solution if better
if fbest > HMbest(HS_size), %maximiza
HM(HS_size, :) = x;
HMbest(HS_size) = fbest;
end
solution = x; % Record the solution
%Obtiene los mejores valores de cada attempt y los alamacena
[mm,ii] = max(HMbest); %maximiza
Fit_bests(count) = mm; %Mejores Fitness
HS_elem(count,:) = HM(ii,1:ndim-1); %Mejores Elementos de HM
HS_bestit = HM(ii,1:ndim-1); %Guarda el mejor HS
HS_bestF = mm; %Guarda el mejor fitness
% Output the results to screen
str=strcat('Best estimates: =',num2str(HS_bestit));
str=strcat(str,' fmin='); str=strcat(str,num2str(HS_bestF));
str=strcat(str,' Iteration='); str=strcat(str,num2str(count));
disp(str);
%Save the best values that will be chek in the stop criterion
if count == 1 || HS_bestF > HS_ant
HS_ant = HS_bestF;
cc = 0;
elseif HS_bestF == HS_ant
cc = cc + 1;
end
if cc > (MaxAttempt * 0.10)
break;
end
end %% for count (harmony search)
toc
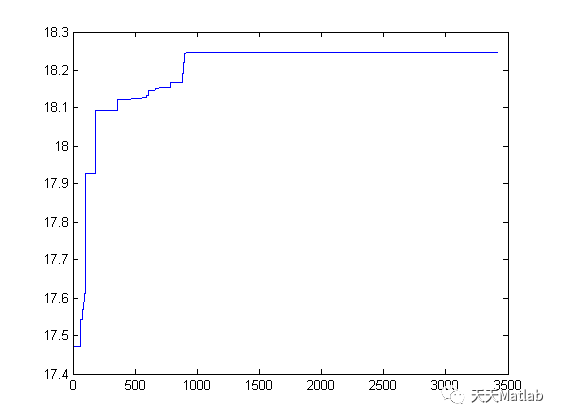
%plot fitness
plot(Fit_bests)
%Prepare results to be show
gBestR = sort(HS_bestit);
Iout = imageGRAY(I,gBestR);
Iout2 = mat2gray(Iout);
%Show results
intensity = gBestR(1:ndim-1)
STDR = std(Fit_bests) %Standar deviation of fitness
MEANR = mean(Fit_bests) %Mean of fitness
PSNRV = PSNR(I, Iout) %PSNR between original image I and the segmented image Iout
Fit_bests(count) %Best fitness
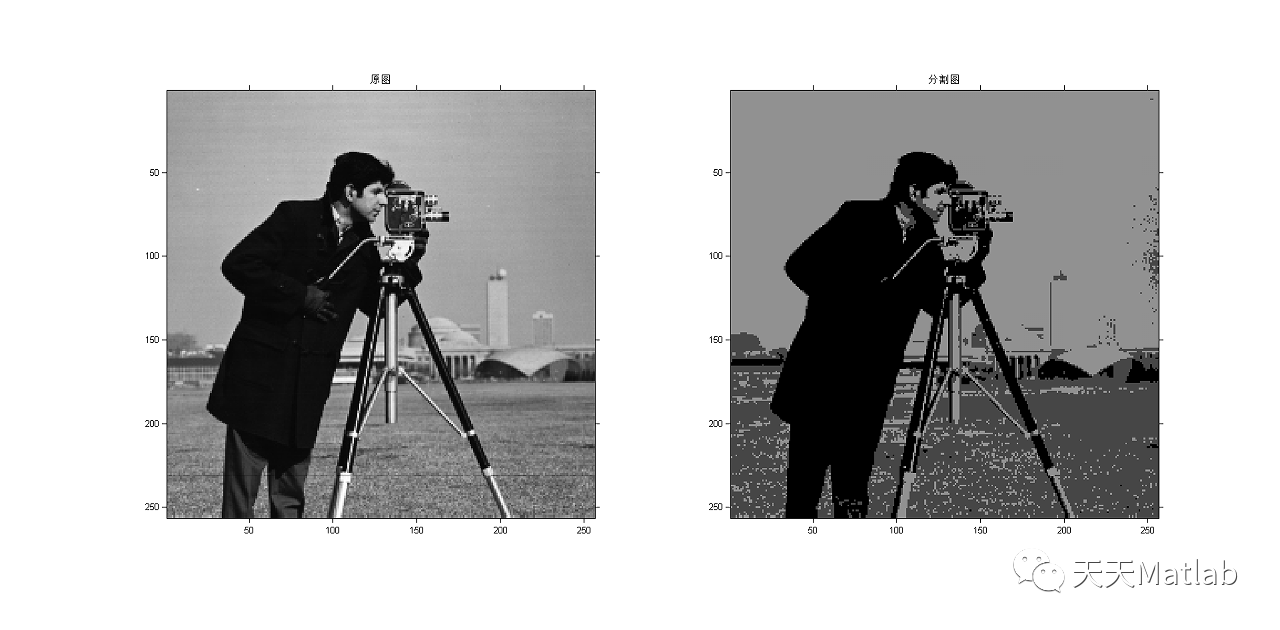
%Show results on images
figure
subplot(121)
imshow(I);title('原图')
subplot(122)
imshow(Iout);title('分割图')
%Plot the threshold values over the histogram
figure
plot(probR)
hold on
vmax = max(probR);
for i = 1:ndim-1
line([intensity(i), intensity(i)],[0 vmax],[1 1],'Color','r','Marker','.','LineStyle','-')
%plot(lineas(i,:))
hold on
end
hold off
3 运行结果


4 参考文献
[1] Oliva D , Cuevas E , Pajares G , et al. Multilevel Thresholding Segmentation Based on Harmony Search Optimization[J]. Journal of Applied Mathematics, 2013, 2013:1-12.
博主简介:擅长智能优化算法、神经网络预测、信号处理、元胞自动机、图像处理、路径规划、无人机等多种领域的Matlab仿真,相关matlab代码问题可私信交流。
部分理论引用网络文献,若有侵权联系博主删除。
-
相关阅读:
ReLU,Sigmoid,Tanh,softmax【基础知识总结】
windows 驱动与内核调试 学习
Redis 中的原子操作(1)-Redis 中命令的原子性
【七:docken+jenkens部署】
Selenium+python怎么搭建自动化测试框架、执行自动化测试用例、生成自动化测试报告、发送测试报告邮件
Java面试题:简述Java线程的生命周期及其状态转换。
left join on和 join on的区别
丹磺酰荧光素/5-羧基四甲基罗丹明标记PCL聚已内酯纳米载体Dansyl-PCL|TMR-TK-PEG-PCL
线程池:ThreadPoolExecutor源码解读
Logic Pro X10.7.9(mac乐曲制作软件)
- 原文地址:https://blog.csdn.net/qq_59747472/article/details/126356605