-
Qt+ECharts开发笔记(三):ECharts的柱状图介绍、基础使用和Qt封装Demo
若该文为原创文章,转载请注明原文出处
本文章博客地址:https://hpzwl.blog.csdn.net/article/details/125731144红胖子(红模仿)的博文大全:开发技术集合(包含Qt实用技术、树莓派、三维、OpenCV、OpenGL、ffmpeg、OSG、单片机、软硬结合等等)持续更新中…(点击传送门)
Qt开发专栏:三方库开发技术
上一篇:《Qt+ECharts开发笔记(二):Qt窗口动态调整大小,使ECharts跟随Qt窗口大小变换而变换大小》
下一篇:敬请期待…前言
上一篇成功是EChart随着Qt窗口变化而变化,本篇将开始正式介绍柱状图介绍、基础使用,并将其封装一层Qt。
本篇的demo实现了隐藏js代码的方式,实现了一个条形图的基本交互方式,即Qt调用js脚本操作html。Demo演示

ECharts调试工具
ECharts提供的纯JS代码编辑开发调试工具,可编辑js,并且查看运行效果:
https://echarts.apache.org/examples/zh/editor.html

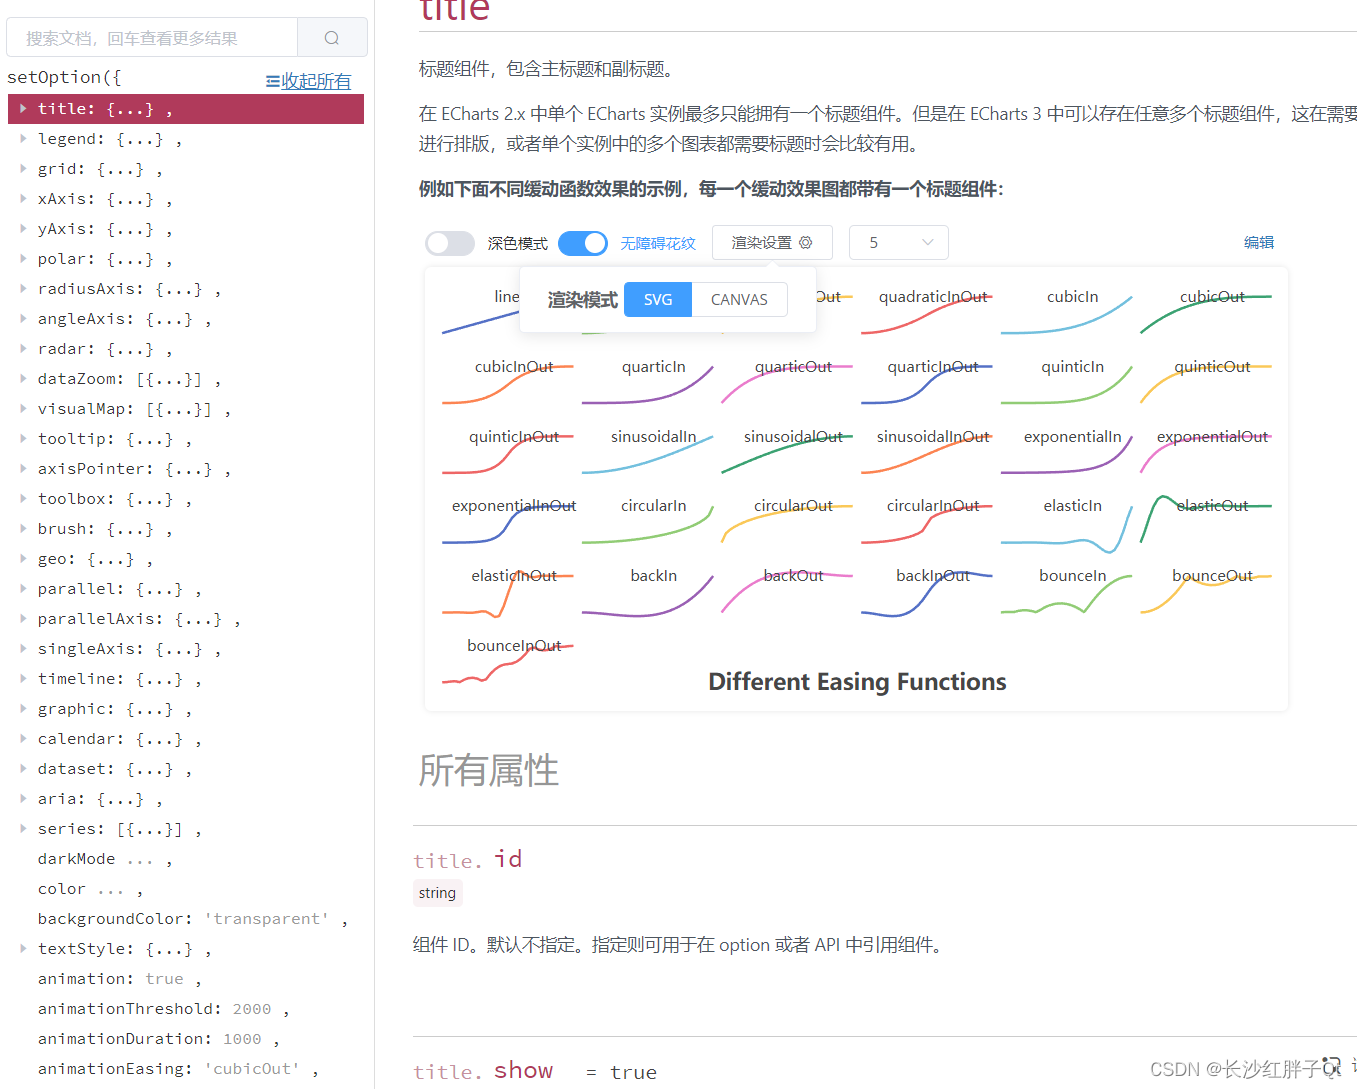
开发过程中对于属性的查询和调试ECharts也提供了配置帮助。
官方配置手册:https://echarts.apache.org/zh/option.html
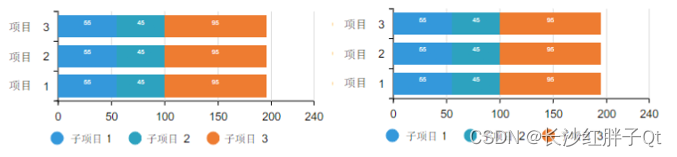
目标
随便找一个预期目标:
ECharts接口静态方式
使用EChart调试工具开发,先调试出基础框架。
这里贴出的全部代码:ECharts - 1
- 2
- 3
- 4
- 5
- 6
- 7
- 8
- 9
- 10
- 11
- 12
- 13
- 14
- 15
- 16
- 17
- 18
- 19
- 20
- 21
- 22
- 23
- 24
- 25
- 26
- 27
- 28
- 29
- 30
- 31
- 32
- 33
- 34
- 35
- 36
- 37
- 38
- 39
- 40
- 41
- 42
- 43
- 44
- 45
- 46
- 47
- 48
- 49
- 50
- 51
- 52
- 53
- 54
- 55
- 56
- 57
- 58
- 59
- 60
- 61
- 62
- 63
- 64
- 65
- 66
- 67
- 68
- 69
- 70
- 71
- 72
- 73
- 74
- 75
- 76
- 77
- 78
- 79
- 80
- 81
- 82
- 83
- 84
- 85
- 86
- 87
- 88
- 89
- 90
- 91
- 92
- 93
- 94
- 95
- 96
- 97
- 98
- 99
- 100
- 101
- 102
- 103
- 104
- 105
- 106
- 107
- 108
- 109
- 110
- 111
- 112
- 113
- 114
- 115
- 116
- 117
- 118
- 119
- 120
- 121
- 122
- 123
- 124
- 125
- 126
ECharts接口动态方式
动态方式,最初目的是为了动态实现数据的js操作,在开发过程中发现动态方式还能隐藏echarts代码,使echarts代码不被抓取,最后决定全部改为动态加载方式。
步骤一:修改html
ECharts - 1
- 2
- 3
- 4
- 5
- 6
- 7
- 8
- 9
- 10
- 11
- 12
- 13
- 14
- 15
- 16
- 17
- 18
- 19
- 20
- 21
- 22
- 23
- 24
- 25
- 26
- 27
- 28
- 29
- 30
步骤二:初始化
新增了loadFinished信号槽关联。
void BarEChartWidget::initControl() { _pWebEngineView = new QWebEngineView(this); _pWebEnginePage = new QWebEnginePage(this); _pWebChannel = new QWebChannel(this); QString filePath; #if 1 filePath = QString("%1/%2").arg(_htmlDir).arg(_indexFileName); #else filePath = "qrc:/barEChartWidget/html/barEChartWidget.html"; #endif LOG << "file exist:" << QFile::exists(filePath) << filePath; #if 0 // 打印html文件内容 QFile file(_indexFilePath); file.open(QIODevice::ReadOnly); LOG << QString(file.readAll()); file.close(); #endif connect(_pWebEnginePage, SIGNAL(loadFinished(bool)), this, SLOT(slot_loadFinished(bool))); _pWebEnginePage->load(QUrl(filePath)); _pWebEnginePage->setWebChannel(_pWebChannel); _pWebEngineView->setPage(_pWebEnginePage); // 背景透明 // _pWebEngineView->setStyleSheet("background-color: transparent"); _pWebEnginePage->setBackgroundColor(Qt::transparent); }- 1
- 2
- 3
- 4
- 5
- 6
- 7
- 8
- 9
- 10
- 11
- 12
- 13
- 14
- 15
- 16
- 17
- 18
- 19
- 20
- 21
- 22
- 23
- 24
- 25
- 26
- 27
- 28
步骤三:加载完成页面后进行初始化
void BarEChartWidget::slot_loadFinished(bool result) { if(result) { initJs(); } } void BarEChartWidget::initJs() { _initJsStr = QSTRING( "var option;" "option = {" " tooltip: {" " trigger: 'axis'" " }," " grid: {" " left: '10'," " right: '10'," " top: '10'," " bottom: 30," " containLabel: true" " }," " legend: {" " orient: 'horizontal'," " x: 'center'," " y: 'bottom'," " itemGap: 20" " }," " xAxis: {" " type: 'value'" " }," " yAxis: {" " type: 'category'," " data: ['项目1', '项目2', '项目3']" " }," " series: [" " {" " name: '变量1'," " type: 'bar'," " stack: 'totla'," " label: {" " show: true" " }," " data: [11, 12, 13]" " }," " {" " name: '变量2'," " type: 'bar'," " stack: 'totla'," " label: {" " show: true" " }," " data: [24, 20, 21]" " }," " {" " name: '变量3'," " type: 'bar'," " stack: 'totla'," " label: {" " show: true" " }," " data: [95, 87, 55]" " }" " ]" "};" "myChart.setOption(option);"); runJsScript(_initJsStr); } void BarEChartWidget::runJsScript(QString str) { if(_pWebEnginePage) { _pWebEnginePage->runJavaScript(str); } }- 1
- 2
- 3
- 4
- 5
- 6
- 7
- 8
- 9
- 10
- 11
- 12
- 13
- 14
- 15
- 16
- 17
- 18
- 19
- 20
- 21
- 22
- 23
- 24
- 25
- 26
- 27
- 28
- 29
- 30
- 31
- 32
- 33
- 34
- 35
- 36
- 37
- 38
- 39
- 40
- 41
- 42
- 43
- 44
- 45
- 46
- 47
- 48
- 49
- 50
- 51
- 52
- 53
- 54
- 55
- 56
- 57
- 58
- 59
- 60
- 61
- 62
- 63
- 64
- 65
- 66
- 67
- 68
- 69
- 70
- 71
- 72
- 73
- 74
- 75
- 76
步骤四:动态执行js操作
重置
void BarEChartWidget::on_pushButton_reset_clicked() { initJs(); }- 1
- 2
- 3
- 4
刷新
void BarEChartWidget::on_pushButton_flush_clicked() { QString jsStr = "var empty = {};" "myChart.setOption(empty, true);" "myChart.setOption(option, true);"; runJsScript(jsStr); }- 1
- 2
- 3
- 4
- 5
- 6
- 7
- 8
清空
void BarEChartWidget::on_pushButton_clear_clicked() { QString jsStr = "option.series[0].data = [];" "option.series[1].data = [];" "option.series[2].data = [];" "myChart.setOption(option, true);"; runJsScript(jsStr); }- 1
- 2
- 3
- 4
- 5
- 6
- 7
- 8
- 9
随机生成(使用js代码)
void BarEChartWidget::on_pushButton_createRandom_clicked() { QString jsStr = "var min = 0;" "var max = 100;" "for(var i = 0; i < option.series.length; i++)" "{" " for(var j = 0; j < option.yAxis.data.length; j++)" " {" " option.series[i].data[j] = Math.floor(Math.random() * (max - min)) + min;" " }" "}" "myChart.setOption(option, true);"; runJsScript(jsStr); }- 1
- 2
- 3
- 4
- 5
- 6
- 7
- 8
- 9
- 10
- 11
- 12
- 13
- 14
- 15
后续用会将数据进行Qt的一份缓存数据,由Qt的数据去生成ecahrts的js脚本。
Demo
html文件
ECharts - 1
- 2
- 3
- 4
- 5
- 6
- 7
- 8
- 9
- 10
- 11
- 12
- 13
- 14
- 15
- 16
- 17
- 18
- 19
- 20
- 21
- 22
- 23
- 24
- 25
- 26
- 27
- 28
- 29
- 30
在代码中使用js初始化echarts:
BarECartWidget.h#ifndef BARECHARTWIDGET_H #define BARECHARTWIDGET_H #include#include #include #include namespace Ui { class BarEChartWidget; } class BarEChartWidget : public QWidget { Q_OBJECT public: explicit BarEChartWidget(QWidget *parent = 0); ~BarEChartWidget(); protected: void initControl(); protected slots: void slot_loadFinished(bool result); protected: void initJs(); protected: void runJsScript(QString str); protected: void resizeEvent(QResizeEvent *event); private slots: void on_pushButton_clear_clicked(); void on_pushButton_flush_clicked(); void on_pushButton_createRandom_clicked(); void on_pushButton_reset_clicked(); private: Ui::BarEChartWidget *ui; private: QWebEngineView *_pWebEngineView; // 浏览器窗口 QWebEnginePage *_pWebEnginePage; // 浏览器页面 QWebChannel *_pWebChannel; // 浏览器js交互 QString _htmlDir; // html文件夹路径 QString _indexFileName; // html文件 QString _initJsStr; // 第一次初始化的表格 }; #endif // BARECHARTWIDGET_H - 1
- 2
- 3
- 4
- 5
- 6
- 7
- 8
- 9
- 10
- 11
- 12
- 13
- 14
- 15
- 16
- 17
- 18
- 19
- 20
- 21
- 22
- 23
- 24
- 25
- 26
- 27
- 28
- 29
- 30
- 31
- 32
- 33
- 34
- 35
- 36
- 37
- 38
- 39
- 40
- 41
- 42
- 43
- 44
- 45
- 46
- 47
- 48
- 49
- 50
- 51
- 52
- 53
- 54
- 55
- 56
BarEChartWidget.cpp
#include "BarEChartWidget.h" #include "ui_BarEChartWidget.h" #include#include #include // QtCreator在msvc下设置编码也或有一些乱码,直接一刀切,避免繁琐的设置 //#define MSVC #ifdef MSVC #define QSTRING(s) QString::fromLocal8Bit(s) #else #define QSTRING(s) QString(s) #endif #include #include //#define LOG qDebug()<<__FILE__<<__LINE__ //#define LOG qDebug()<<__FILE__<<__LINE__<<__FUNCTION__ //#define LOG qDebug()<<__FILE__<<__LINE__< - 1
- 2
- 3
- 4
- 5
- 6
- 7
- 8
- 9
- 10
- 11
- 12
- 13
- 14
- 15
- 16
- 17
- 18
- 19
- 20
- 21
- 22
- 23
- 24
- 25
- 26
- 27
- 28
- 29
- 30
- 31
- 32
- 33
- 34
- 35
- 36
- 37
- 38
- 39
- 40
- 41
- 42
- 43
- 44
- 45
- 46
- 47
- 48
- 49
- 50
- 51
- 52
- 53
- 54
- 55
- 56
- 57
- 58
- 59
- 60
- 61
- 62
- 63
- 64
- 65
- 66
- 67
- 68
- 69
- 70
- 71
- 72
- 73
- 74
- 75
- 76
- 77
- 78
- 79
- 80
- 81
- 82
- 83
- 84
- 85
- 86
- 87
- 88
- 89
- 90
- 91
- 92
- 93
- 94
- 95
- 96
- 97
- 98
- 99
- 100
- 101
- 102
- 103
- 104
- 105
- 106
- 107
- 108
- 109
- 110
- 111
- 112
- 113
- 114
- 115
- 116
- 117
- 118
- 119
- 120
- 121
- 122
- 123
- 124
- 125
- 126
- 127
- 128
- 129
- 130
- 131
- 132
- 133
- 134
- 135
- 136
- 137
- 138
- 139
- 140
- 141
- 142
- 143
- 144
- 145
- 146
- 147
- 148
- 149
- 150
- 151
- 152
- 153
- 154
- 155
- 156
- 157
- 158
- 159
- 160
- 161
- 162
- 163
- 164
- 165
- 166
- 167
- 168
- 169
- 170
- 171
- 172
- 173
- 174
- 175
- 176
- 177
- 178
- 179
- 180
- 181
- 182
- 183
- 184
- 185
- 186
- 187
- 188
- 189
- 190
- 191
- 192
- 193
- 194
- 195
- 196
- 197
- 198
- 199
- 200
- 201
- 202
- 203
- 204
- 205
- 206
- 207
- 208
- 209
- 210
入坑
入坑一:调用js函数失败
问题
通过qt代码跑js调用函数失败。


原理
先要等页面加载完成后才能调用定义的函数。
解决
发现是调用成功了,原来只定义也会报这个错误。

由此可以看出,在qt中去初始化需要等待页面加载完成才行。入坑二:Qt的msvc编译器少数中文乱码
问题
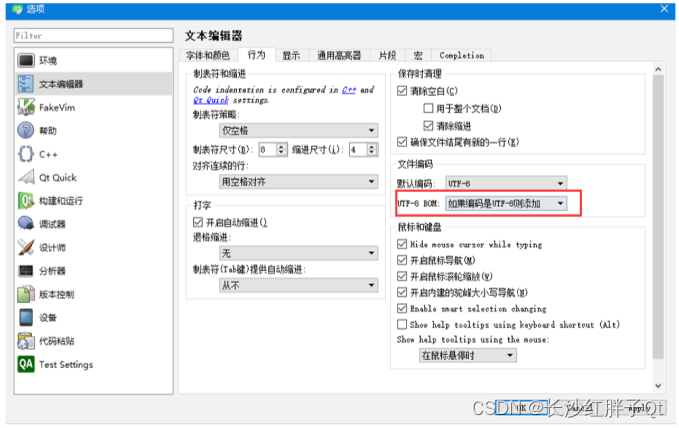
少数中文乱码,加空格等都无法解决。

解决
最终解决了,尝试了QTextCodec等各种都不行,最终:

工程模板v1.2.0

后话
条形图将会根据实际需求持续升级版本,下一篇会继续折线图的基础封装。
上一篇:《Qt+ECharts开发笔记(二):Qt窗口动态调整大小,使ECharts跟随Qt窗口大小变换而变换大小》
下一篇:敬请期待…若该文为原创文章,转载请注明原文出处
本文章博客地址:https://hpzwl.blog.csdn.net/article/details/125731144先自我介绍一下,小编13年上师交大毕业,曾经在小公司待过,去过华为OPPO等大厂,18年进入阿里,直到现在。深知大多数初中级java工程师,想要升技能,往往是需要自己摸索成长或是报班学习,但对于培训机构动则近万元的学费,着实压力不小。自己不成体系的自学效率很低又漫长,而且容易碰到天花板技术停止不前。因此我收集了一份《java开发全套学习资料》送给大家,初衷也很简单,就是希望帮助到想自学又不知道该从何学起的朋友,同时减轻大家的负担。添加下方名片,即可获取全套学习资料哦
-
相关阅读:
LeetCode题解:171. Excel 表列序号,哈希表,TypeScript,详细注释
【SQL数据分析 | 手把手教你做淘宝用户分析!】
多环境镜像晋级/复用最佳实践
【机器学习】消息传递神经网络(MPNN)在分子预测领域的医学应用
「计算机基础」进制转换
CentOS安装Docker
高项_第九章人力资源管理
C语言——问题总结
(附源码)计算机毕业设计SSM基于的婚恋系统
Spring原理
- 原文地址:https://blog.csdn.net/Bejpse/article/details/126113954
