-
GEE开发之Landsat8_SR计算NDVI逐年时序变化
前言:这次用到了LANDSAT/LT05/C01/T1_SR、LANDSAT/LE07/C01/T1_SR、LANDSAT/LC08/C01/T1_SR三个平台的数据,通过去云和计算NDVI的值,获取该地区20年NDVI值的变化。
1 去云算法
去云LANDSAT5和7的算法代码:
//去云457的算法 function cloudMaskL457(image) { var qa = image.select('pixel_qa'); // If the cloud bit (5) is set and the cloud confidence (7) is high // or the cloud shadow bit is set (3), then it's a bad pixel. var cloud = qa.bitwiseAnd(1 << 5).and(qa.bitwiseAnd(1 << 7)).or(qa.bitwiseAnd(1 << 3)); // Remove edge pixels that don't occur in all bands var mask2 = image.mask().reduce(ee.Reducer.min()); return image.updateMask(cloud.not()).updateMask(mask2); };- 1
- 2
- 3
- 4
- 5
- 6
- 7
- 8
- 9
- 10
去云LANDSAT8的算法代码:
//去云8的算法 function cloudMaskL8sr(image) { // Bits 3 and 5 are cloud shadow and cloud, respectively. var cloudShadowBitMask = (1 << 3); var cloudsBitMask = (1 << 5); // Get the pixel QA band. var qa = image.select('pixel_qa'); // Both flags should be set to zero, indicating clear conditions. var mask = qa.bitwiseAnd(cloudShadowBitMask).eq(0) .and(qa.bitwiseAnd(cloudsBitMask).eq(0)); return image.updateMask(mask); }- 1
- 2
- 3
- 4
- 5
- 6
- 7
- 8
- 9
- 10
- 11
- 12
2 NDVI的计算
LANDSAT5和7的算法代码:
//计算57NDVI的值 function opNdvi57(image){ var ndvi = image.normalizedDifference(['B4', 'B3']).rename('NDVI') return image.addBands(ndvi); }- 1
- 2
- 3
- 4
- 5
LANDSAT8的算法代码:
//计算8NDVI的值 function opNdvi8(image){ var ndvi = image.normalizedDifference(['B5', 'B4']).rename('NDVI') return image.addBands(ndvi); }- 1
- 2
- 3
- 4
- 5
3 L5、L7、L8综合计算某地区NDVI逐年时序变化
代码如下(以鹿邑县为例):
var geometry = ee.FeatureCollection('users/www1573979951/luyixian') Map.centerObject(geometry,6) var L5_COL = getNdvi(2000, 2011, "LANDSAT/LT05/C01/T1_SR", cloudMaskL457, opNdvi57); var L7_COL = getNdvi(2012, 2012, "LANDSAT/LE07/C01/T1_SR", cloudMaskL457, opNdvi57); var L8_COL = getNdvi(2013, 2020, "LANDSAT/LC08/C01/T1_SR", cloudMaskL8sr, opNdvi8); var data = ee.ImageCollection(L5_COL.merge(L7_COL).merge(L8_COL)) print(data); var yearlychart = ui.Chart.image.series({ imageCollection: data.select('NDVI_median'), region: geometry, reducer: ee.Reducer.mean(), scale: 500, xProperty:'Year' }).setOptions({ interpolateNulls: true, lineWidth: 2, title: 'NDVI Daily Time Seires', vAxis: {title: 'NDVI', viewWindow: {max: 0.7,min: 0.2,}}, hAxis: {title: 'Date'}, trendlines: { 0: {title: 'NDVI_trend',type:'linear', showR2: true, color:'red', visibleInLegend: true}} }); print(yearlychart); function getNdvi(startYear, finishYear, name, cloudMask, op){ var years = ee.List.sequence(startYear, finishYear); return ee.ImageCollection(years.map(function(year){ var start = ee.Date.fromYMD(year, 1, 1); var end = start.advance(12, 'month'); var ndvi = ee.ImageCollection(name).filterDate(start, end).map(cloudMask).map(op); return ndvi.reduce(ee.Reducer.median()).clip(geometry).set('Year',year); })) } //去云457的算法 function cloudMaskL457(image) { var qa = image.select('pixel_qa'); // If the cloud bit (5) is set and the cloud confidence (7) is high // or the cloud shadow bit is set (3), then it's a bad pixel. var cloud = qa.bitwiseAnd(1 << 5).and(qa.bitwiseAnd(1 << 7)).or(qa.bitwiseAnd(1 << 3)); // Remove edge pixels that don't occur in all bands var mask2 = image.mask().reduce(ee.Reducer.min()); return image.updateMask(cloud.not()).updateMask(mask2); }; //去云8的算法 function cloudMaskL8sr(image) { // Bits 3 and 5 are cloud shadow and cloud, respectively. var cloudShadowBitMask = (1 << 3); var cloudsBitMask = (1 << 5); // Get the pixel QA band. var qa = image.select('pixel_qa'); // Both flags should be set to zero, indicating clear conditions. var mask = qa.bitwiseAnd(cloudShadowBitMask).eq(0) .and(qa.bitwiseAnd(cloudsBitMask).eq(0)); return image.updateMask(mask); } //计算57NDVI的值 function opNdvi57(image){ var ndvi = image.normalizedDifference(['B4', 'B3']).rename('NDVI') return image.addBands(ndvi); } //计算8NDVI的值 function opNdvi8(image){ var ndvi = image.normalizedDifference(['B5', 'B4']).rename('NDVI') return image.addBands(ndvi); }- 1
- 2
- 3
- 4
- 5
- 6
- 7
- 8
- 9
- 10
- 11
- 12
- 13
- 14
- 15
- 16
- 17
- 18
- 19
- 20
- 21
- 22
- 23
- 24
- 25
- 26
- 27
- 28
- 29
- 30
- 31
- 32
- 33
- 34
- 35
- 36
- 37
- 38
- 39
- 40
- 41
- 42
- 43
- 44
- 45
- 46
- 47
- 48
- 49
- 50
- 51
- 52
- 53
- 54
- 55
- 56
- 57
- 58
- 59
- 60
- 61
- 62
- 63
- 64
- 65
- 66
- 67
- 68
- 69
- 70
- 71
- 72
- 73
- 74
- 75
- 76
- 77
21年的数据集截图:

表格变化趋势截图:

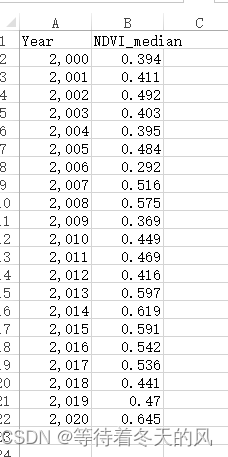
CSV数据截图:
4 通过L8计算某地区不同月份的NDVI变化情况
代码如下(以鹿邑县为例):
var geometry = ee.FeatureCollection('users/www1573979951/luyixian') Map.centerObject(geometry,11.5) var landsat8 = ee.ImageCollection("LANDSAT/LC08/C01/T1_SR").map(opNdvi8); var image_ls8_8 = ee.Image(landsat8.filterBounds(geometry).filterDate('2020-07-01', '2020-08-31').sort('CLOUD_COVER').first().clip(geometry)); var image_ls8_10 = ee.Image(landsat8.filterBounds(geometry).filterDate('2020-10-01', '2020-11-30').sort('CLOUD_COVER').first().clip(geometry)); // 显示影像的真实颜色 var trueColor_ls8 = {bands: ['B4', 'B3', 'B2'], min: 0, max: 3000}; Map.addLayer(image_ls8_8, trueColor_ls8, 'Landsat8 yr2020_07_08 true color'); Map.addLayer(image_ls8_10, trueColor_ls8, 'Landsat8 yr2020_10_11 true color'); //计算8NDVI的值 function opNdvi8(image){ var ndvi = image.normalizedDifference(['B5', 'B4']).rename('NDVI') return image.addBands(ndvi); }- 1
- 2
- 3
- 4
- 5
- 6
- 7
- 8
- 9
- 10
- 11
- 12
- 13
- 14
- 15
- 16
- 17
- 18
2020鹿邑县年7月8月遥感影像截图:

2020鹿邑县年10月11月遥感影像截图:

结果分析:虽然两张图片不是很全,但是也能得到7月8月的NDVI值比较高,植被比较丰富。10月11月的NDVI值比较低,植被比较稀少。原因:7月8月玉米生长阶段,10月11月玉米已经成熟且收获,田地里绿色植被很少。 -
相关阅读:
用户量大,Redis没法缓存响应,数据库宕机?如何排查解决?
sql优化常用技巧及理解
数据湖存储在大模型中的应用
后台管理弹出框样式设置
hadoop配置文件workers
老饼告诉你-神经网络怎么入门才更高效
小福利,递归函数具体应用
BUUCTF [GXYCTF2019]luck_guy
Kafka集群中Controller,Rebalance,HW的区别
砥砺的前行|基于labview的机器视觉图像处理|NI Vision Assisant(四)——Color(彩色图) 功能
- 原文地址:https://blog.csdn.net/qq_32306361/article/details/126099166
