前言
基于echarts5.x和vue2实现
记录以便日后查阅
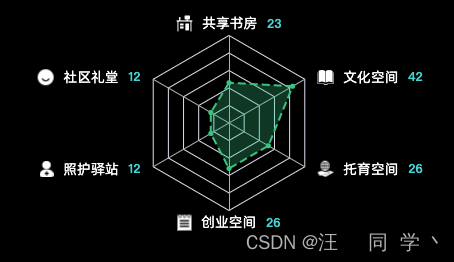
实现效果

代码实现
<template>
<div class="chart-wrap">
<div id="chart03" class="chart" />
div>
template>
<script>
export default {
name: 'Index',
data () {
return {
chart: null,
data: [
{ name: '共享书房', max: 50, data: 23, icon: 'gxsf' },
{ name: '社区礼堂', max: 50, data: 12, icon: 'sqlt' },
{ name: '照护驿站', max: 50, data: 12, icon: 'zhyz' },
{ name: '创业空间', max: 50, data: 26, icon: 'cykj' },
{ name: '托育空间', max: 50, data: 26, icon: 'tykj' },
{ name: '文化空间', max: 50, data: 42, icon: 'whkj' }
]
}
},
mounted() {
this.createChartHandler()
},
methods: {
createChartHandler () {
this.chart = this.$echarts.init(document.getElementById('chart03'))
this.chart.setOption(this.getChartOption(this.data))
window.addEventListener('resize', () => {
setTimeout(() => {
this.chart.resize()
})
})
},
getChartOption (data) {
return {
tooltip: {
position: ['50%', '50%'],
extraCssText:
'color:#fff;background: rgba(0, 38, 118, 0.5);border:none; box-shadow: 0px 0px 8px 1px rgba(0, 145, 255, 0.5);border-radius: 2px;z-index:99',
formatter: function (e) {
let str = ''
e
.value
.forEach((item, index) => {
const d
= `${data[index].name}: ${item}`
str
+= d
})
str
+= '
- 1
- 2
- 3
- 4
- 5
- 6
- 7
- 8
- 9
- 10
- 11
- 12
- 13
- 14
- 15
- 16
- 17
- 18
- 19
- 20
- 21
- 22
- 23
- 24
- 25
- 26
- 27
- 28
- 29
- 30
- 31
- 32
- 33
- 34
- 35
- 36
- 37
- 38
- 39
- 40
- 41
- 42
- 43
- 44
- 45
- 46
- 47
- 48
- 49
- 50
- 51
- 52
- 53
- 54
- 55
- 56
- 57
- 58
- 59
- 60
- 61
- 62
- 63
- 64
- 65
- 66
- 67
- 68
- 69
- 70
- 71
- 72
- 73
- 74
- 75
- 76
- 77
- 78
- 79
- 80
- 81
- 82
- 83
- 84
- 85
- 86
- 87
- 88
- 89
- 90
- 91
- 92
- 93
- 94
- 95
- 96
- 97
- 98
- 99
- 100
- 101
- 102
- 103
- 104
- 105
- 106
- 107
- 108
- 109
- 110
- 111
- 112
- 113
- 114
- 115
- 116
- 117
- 118
- 119
- 120
- 121
- 122
- 123
- 124
- 125
- 126
- 127
- 128
- 129
- 130
- 131
- 132
- 133
- 134
- 135
- 136
- 137
- 138
- 139
- 140
- 141
- 142
- 143
- 144
- 145
- 146
- 147
- 148
- 149
- 150
- 151
- 152
- 153
- 154
- 155
- 156
- 157
- 158
- 159
- 160
- 161
