-
Databend 性能剖析方法与工具
Databend 整合了一些性能剖析工具,可以方便进行深入分析。本文将会介绍如何进行 CPU / Memory Profiling。CPU Profiling
CPU Profiling
CPU 分析,按照一定的频率采集所监听的应用程序 CPU(含寄存器)的使用情况,可确定应用程序在主动消耗 CPU 周期时花费时间的位置。
pprof 是 Google 开源的代码性能分析工具,可以直接生成代码分析报告,不仅支持通过命令式交互查看,也便于可视化展示。Databend 使用 pprof-rs1 完成对 pprof 工具的支持。
必备工作
CPU 分析属于 Databend 的内置能力,部署一个 Databend 实例即可开始使用。
命令行交互
go tool pprof http://localhost:<your-databend-port>/debug/pprof/profile?seconds=<your-profile-second>若 http 端口为 8080 ,采样时间为 20 秒,结果示例如下:
- $ go tool pprof http://localhost:8080/debug/pprof/profile?seconds=20
- Fetching profile over HTTP from http://localhost:8080/debug/pprof/profile?seconds=20
- Saved profile in ~/pprof/pprof.samples.cpu.001.pb.gz
- Type: cpu
- Time: Jul 15, 2022 at 9:45am (CST)
- Duration: 20s, Total samples = 141.41ms ( 0.71%)
- Entering interactive mode (type "help" for commands, "o" for options)
- (pprof) top
- Showing nodes accounting for 141.41ms, 100% of 141.41ms total
- Showing top 10 nodes out of 218
- flat flat% sum% cum cum%
- 141.41ms 100% 100% 141.41ms 100% backtrace::backtrace::libunwind::trace
- 0 0% 100% 10.10ms 7.14% <&mut regex_syntax::utf8::Utf8Sequences as core::iter::traits::iterator::Iterator>::next
- 0 0% 100% 10.10ms 7.14% <
- 0 0% 100% 10.10ms 7.14% <
- 0 0% 100% 10.10ms 7.14% <
- 0 0% 100% 10.10ms 7.14% <
- 0 0% 100% 10.10ms 7.14% <[&str]>::iter
- 0 0% 100% 10.10ms 7.14% <[(char, &[char])]>::binary_search_by::<<[(char, &[char])]>::binary_search_by_key<char, regex_syntax::unicode::simple_fold::imp::{closure#0}>::{closure#0}>
- 0 0% 100% 10.10ms 7.14% <[(char, &[char])]>::binary_search_by_key::<char, regex_syntax::unicode::simple_fold::imp::{closure#0}>
- 0 0% 100% 10.10ms 7.14% <[(char, &[char])]>::binary_search_by_key::<char, regex_syntax::unicode::simple_fold::imp::{closure#0}>::{closure#0}
可视化
执行下述命令可以进行可视化:
go tool pprof -http=0.0.0.0:例如,执行下述语句可以在 8088 端口开启 WEB UI 。
go tool pprof -http=0.0.0.0:8088 ~/pprof/pprof.samples.cpu.001.pb.gz访问 http://0.0.0.0:8088/ui/flamegraph 即可得到火焰图。

注意事项
Databend 暂时不支持在 musl 平台上运行 pprof 。
Memory Profiling
内存分析,在应用程序进行堆分配时记录堆栈追踪,用于监视当前和历史内存使用情况,以及检查内存泄漏。通过与
jemalloc的集成,Databend 得以整合多种内存分析能力。这里使用jeprof进行内存分析。必备工作
-
安装 Jemalloc,并启用其剖析能力 ./configure --enable-prof
-
在构建二进制文件时启用 memory-profiling 特性:cargo build --features memory-profiling
-
在创建 Databend 实例时,设置环境变量 MALLOC_CONF=prof:true 以启用内存分析。示例:
MALLOC_CONF=prof:true ./target/debug/databend-query
堆快照转储
jeprof <your-profile-target> http://localhost:<your-databend-port>/debug/mem下面的例子选用 debug 模式下编译的 databend-query 作为 target,端口为 8080,结果如下所示:
- $ jeprof ./target/debug/databend-query http://localhost:8080/debug/mem
- Using local file ./target/debug/databend-query.
- Gathering CPU profile from http://localhost:8080/debug/mem/pprof/profile?seconds=30 for 30 seconds to
- ~/jeprof/databend-query.1658367127.localhost
- Be patient...
- Wrote profile to ~/jeprof/databend-query.1658367127.localhost
- Welcome to jeprof! For help, type 'help'.
- (jeprof) top
- Total: 11.1 MB
- 6.0 54.6% 54.6% 6.0 54.6% ::alloc_zeroed
- 5.0 45.4% 100.0% 5.0 45.4% ::alloc
- 0.0 0.0% 100.0% 0.5 4.5% ::add_node::{closure#0}
- 0.0 0.0% 100.0% 5.0 45.4% ::alloc_impl
- 0.0 0.0% 100.0% 5.0 45.4% ::allocate
- 0.0 0.0% 100.0% 4.5 40.8% ::allocate_in
- 0.0 0.0% 100.0% 0.5 4.5% ::apply_batch_inner
- 0.0 0.0% 100.0% 11.1 100.0% ::block_on::
- 0.0 0.0% 100.0% 11.1 100.0% ::block_on::::{closure#0}
- 0.0 0.0% 100.0% 0.5 4.5% ::clone
- (jeprof)
生成内存分配调用图
常见的用例之一是查找内存泄漏,通过比较间隔前后的内存画像即可完成这一工作。在下面的命令行中,以 10 s 为间隔,获取前后两个时间节点的内存画像。
- curl 'http://localhost:
/debug/mem/pprof/profile?seconds=0' > a.prof - sleep 10
- curl 'http://localhost:
/debug/mem/pprof/profile?seconds=0' > b.prof
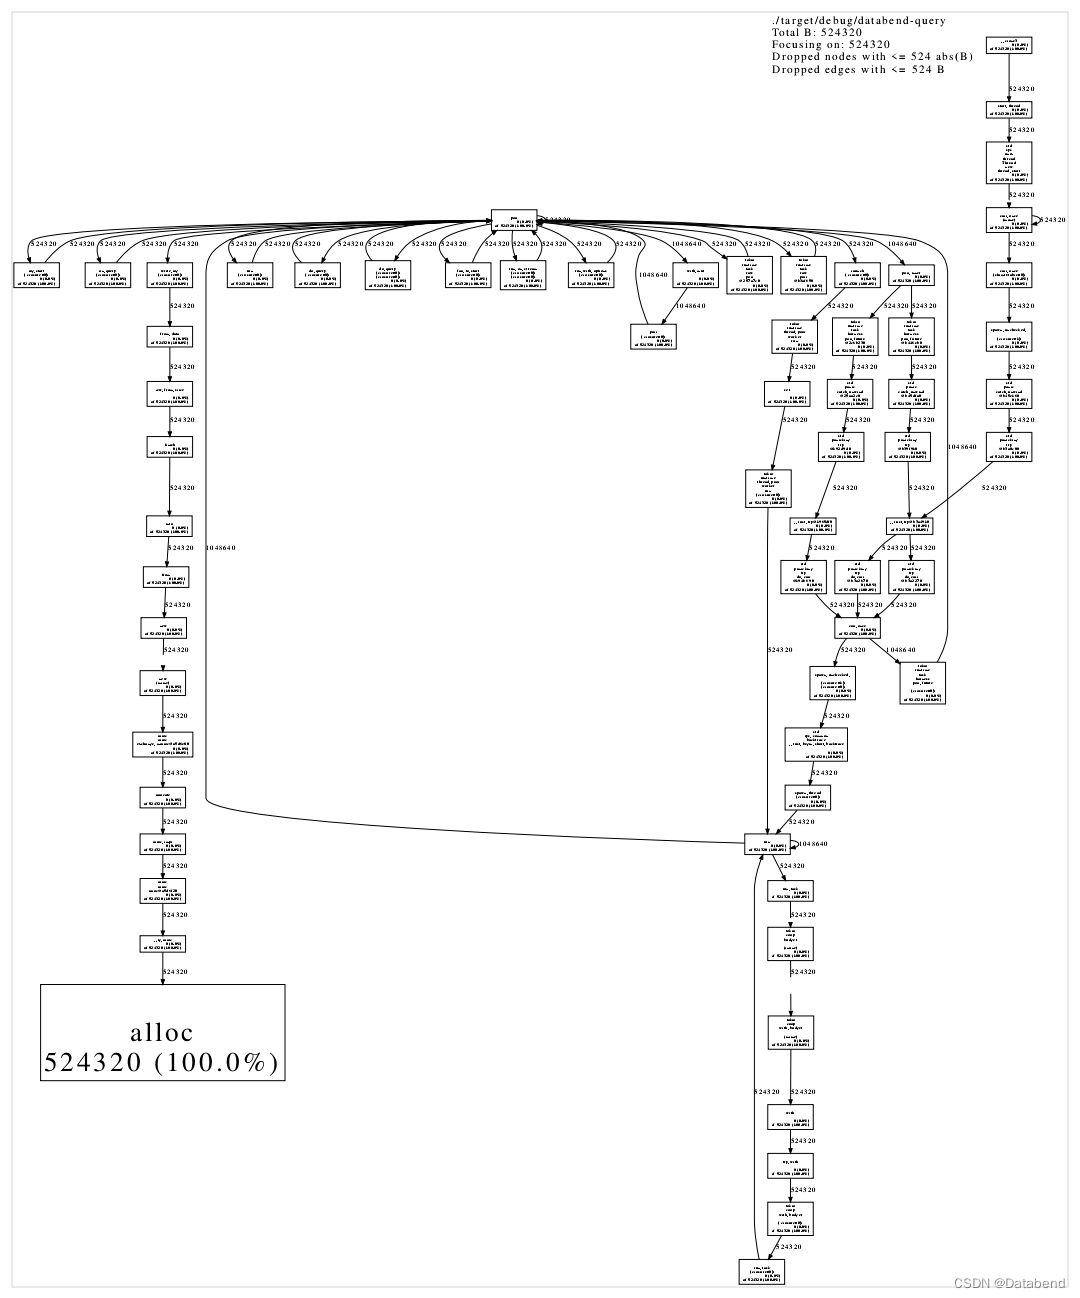
接着,可以利用这两份内存画像来生成 pdf 格式的内存分配调用图。
- jeprof \
- --show_bytes \
- --nodecount=1024 \
- --nodefraction=0.001 \
- --edgefraction=0.001 \
- --maxdegree=64 \
- --pdf \
- <your-profile-target> \
- --base=a.prof \
- b.prof \
- > mem.pdf
同样选用 debug 模式下编译的 databend-query 作为 target,端口为 8080,结果如图所示:
注意事项
目前无法在 Mac 上进行内存分析,不管是 x86_64 还是 aarch64 平台。
关于 Databend
Databend 是一款开源、弹性、低成本,基于对象存储也可以做实时分析的新式数仓。期待您的关注,一起探索云原生数仓解决方案,打造新一代开源 Data Cloud。
-
Databend 文档:Databend - Activate your Object Storage for real-time analytics | Databend
-
Slack:Slack
-
Wechat:Databend
 文章首发于公众号:Databend
Footnotes
-
相关阅读:
基于AI智能识别技术的智慧展览馆视频监管方案设计
鸿蒙Harmony应用开发—ArkTS声明式开发(通用属性:外描边设置)
官宣!苏州吴江开发区上线电子劳动合同平台
IntelliJ IDEA 如何设置类注释和方法注释
宝塔手把手教学-Linux面板安装LNMP & worldpress个人博客
ChatGPT Prompting开发实战(三)
[阅读笔记20][BTX]Branch-Train-MiX: Mixing Expert LLMs into a Mixture-of-Experts LLM
视频可回溯系统技术方案vue3+ts+tegg+mysql+redis+oss
如何实现用django读写elasticsearch
Ajax和JQuery
- 原文地址:https://blog.csdn.net/Databend/article/details/125915632
