-
python 科学计算三维可视化笔记(第一周 基础运用)
内容来自中国大学MOOC,北京理工大学,python数据分析与展示课程,侵删。
如有错误,烦请指出。
python 科学计算三维可视化笔记 第一周 基础运用
〇、系统环境
Windows 10 64 位 + python 3.9.12
建立虚拟环境conda create -n 3dvis python=3.9.12
虚拟环境中依次:- pip install VTK-9.1.0-cp39-cp39-win_amd64.whl
- pip install numpy-1.22.4+mkl-cp39-cp39-win_amd64.whl
- pip install traits-6.3.2-cp39-cp39-win_amd64.whl
- pip install mayavi-4.7.4-cp39-cp39-win_amd64.whl
- pip install PyQt5
前四个库的 下载地址
虚拟环境中启动 idle:cmd 中依次输入activate 3dvis,python -m idlelib.idle
虚拟环境中下载 jupyter notebook:cmd 中输入pip install jupyter
虚拟环境中启动 jupyter notebook:cmd 中输入jupyter notebook一、TVTK 库的基本三维对象
1. TVTK 库的基本三维对象

2. 创建基本三维对象:长方体
s = tvtk.CubeSource(traits)- 1
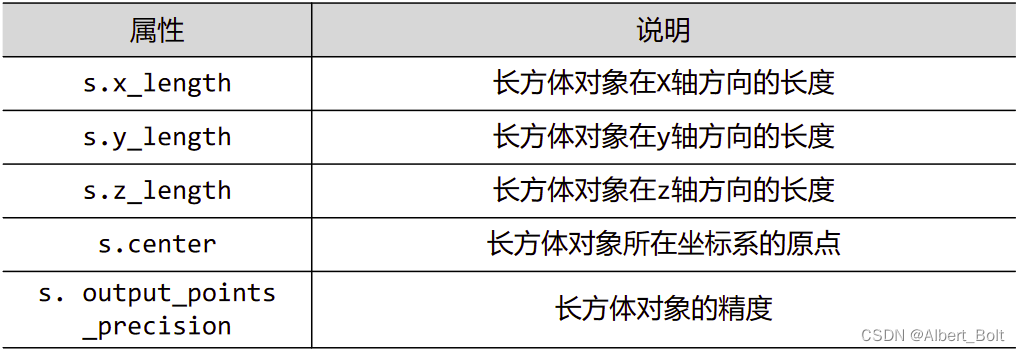
CubeSource 对象的属性如下:
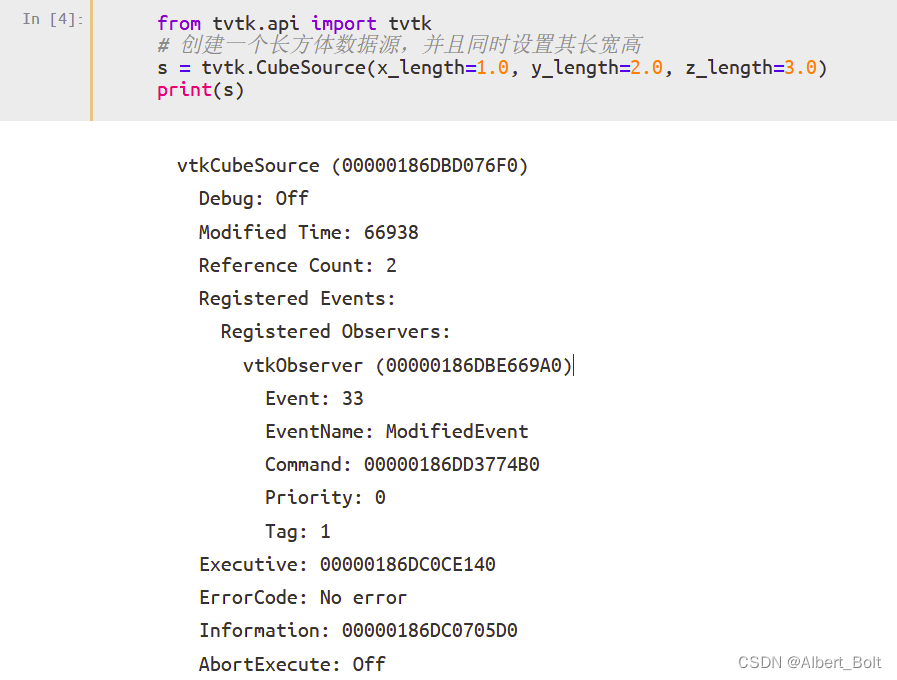
一个 CubeSource 对象实例:

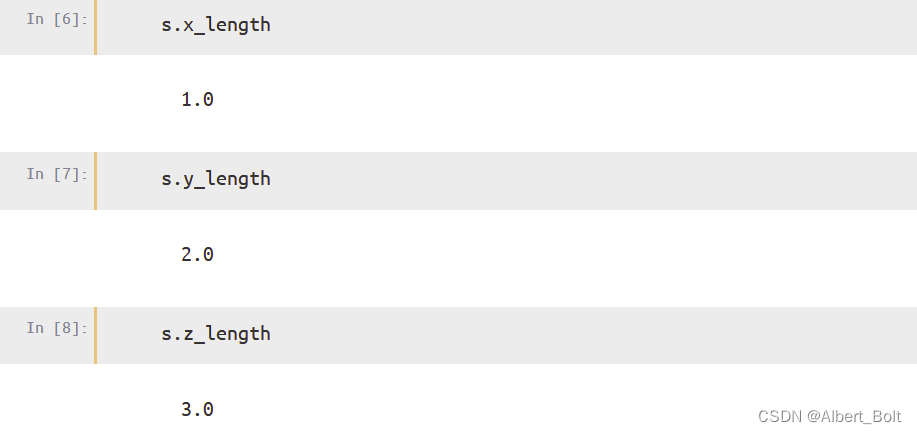
CubeSource 对象的方法如下:

3. 显示基本三维对象:长方体
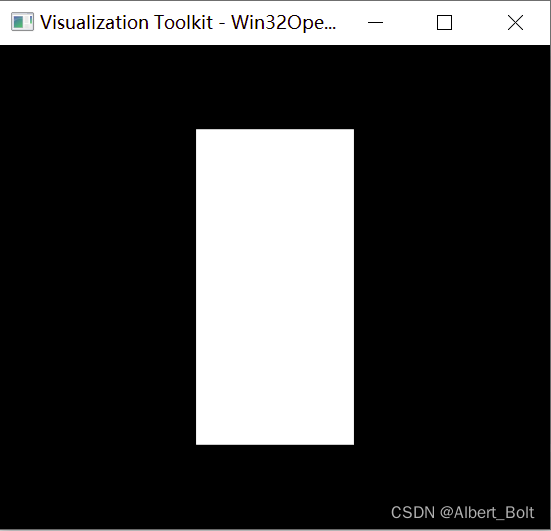
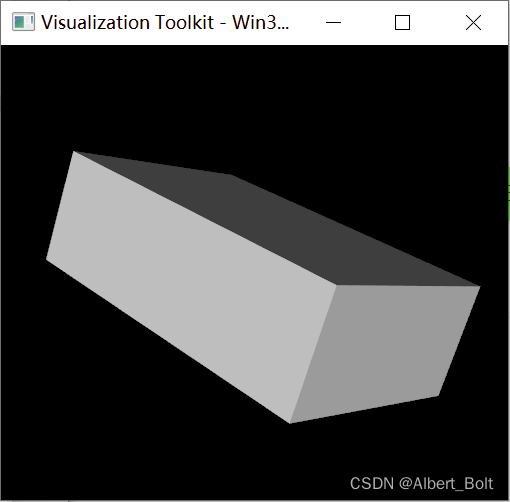
from tvtk.api import tvtk # 创建一个长方体数据源,并且同时设置其长宽高 s = tvtk.CubeSource(x_length=1.0, y_length=2.0, z_length=3.0) # 使用PolyDataMapper将数据转换为图形数据 m = tvtk.PolyDataMapper(input_connection=s.output_port) # 创建一个Actor a = tvtk.Actor(mapper=m) # 创建一个Renderer,将Actor添加进去 r = tvtk.Renderer(background=(0, 0, 0)) r.add_actor(a) # 创建一个RenderWindow(窗口),将Renderer添加进去 w = tvtk.RenderWindow(size=(300,300)) w.add_renderer(r) # 创建一个RenderWindowInteractor(窗口的交互工具) i = tvtk.RenderWindowInteractor(render_window=w) # 开启交互 i.initialize() i.start()- 1
- 2
- 3
- 4
- 5
- 6
- 7
- 8
- 9
- 10
- 11
- 12
- 13
- 14
- 15
- 16
- 17
- 18
二、TVTK 的管线
管线技术(Pipeline,流水线):
- 可视化管线(Visualization Pipeline):将原始数据加工成图形数据
- 图形管线(Graphics Pipeline):将图像数据加工为我们所看到的图像
1. 可视化管线

可视化管线中的 TVTK 对象:

2. 图形管线
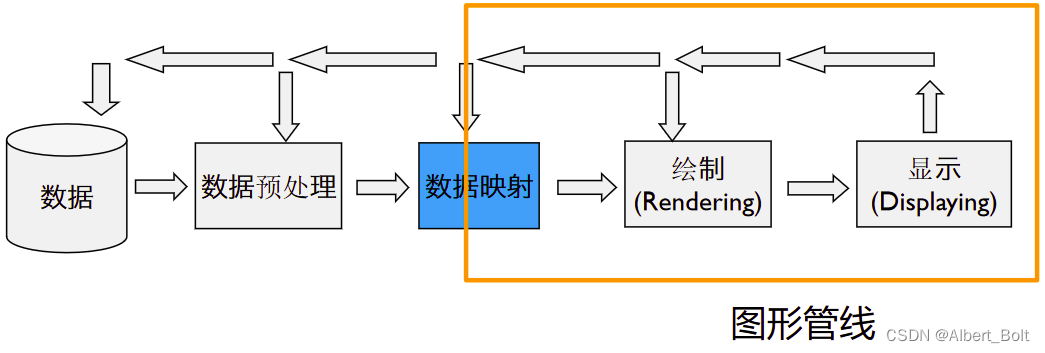
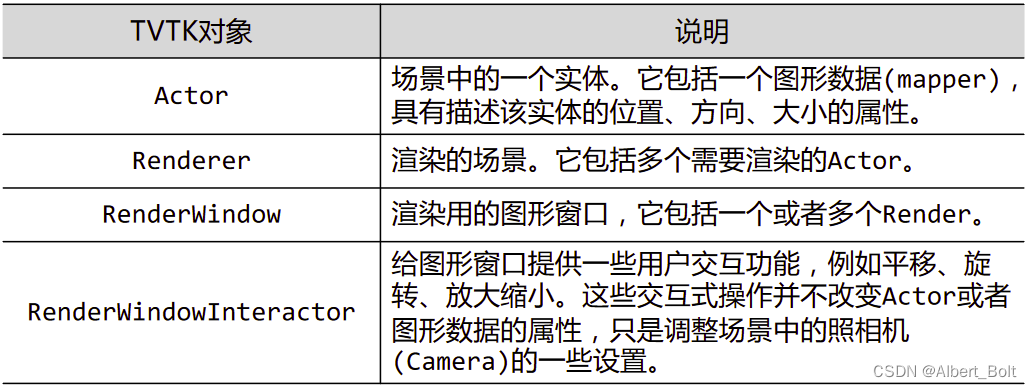
图形管线中的 TVTK 对象:
3. 用 ivtk 工具观察管线
from tvtk.api import ivtk- 1
使用 itvk 显示立方体,修复窗口显示错误,并用函数封装,存为 tvtkfunc.py 文件:
def ivtk_scene(actors): from tvtk.tools import ivtk #创建一个带Crust(Python Shell)的窗口 win = ivtk.IVTKWithCrustAndBrowser() win.open() win.scene.add_actor(actors) #修正窗口错误 dialog = win.control.centralWidget().widget(0).widget(0) from pyface.qt import QtCore dialog.setWindowFlags(QtCore.Qt.WindowFlags(0x00000000)) dialog.show() return win def event_loop(): from pyface.api import GUI gui = GUI() gui.start_event_loop()- 1
- 2
- 3
- 4
- 5
- 6
- 7
- 8
- 9
- 10
- 11
- 12
- 13
- 14
- 15
- 16
- 17
在写 cube_ivtk.py 程序时,直接调用:
from tvtk.api import tvtk from tvtkfunc import ivtk_scene,event_loop s = tvtk.CubeSource(x_length=1.0, y_length=2.0, z_length=3.0) m = tvtk.PolyDataMapper(input_connection=s.output_port) a = tvtk.Actor(mapper=m) win = ivtk_scene(a) win.scene.isometric_view() event_loop()- 1
- 2
- 3
- 4
- 5
- 6
- 7
- 8
- 9
结果如下:
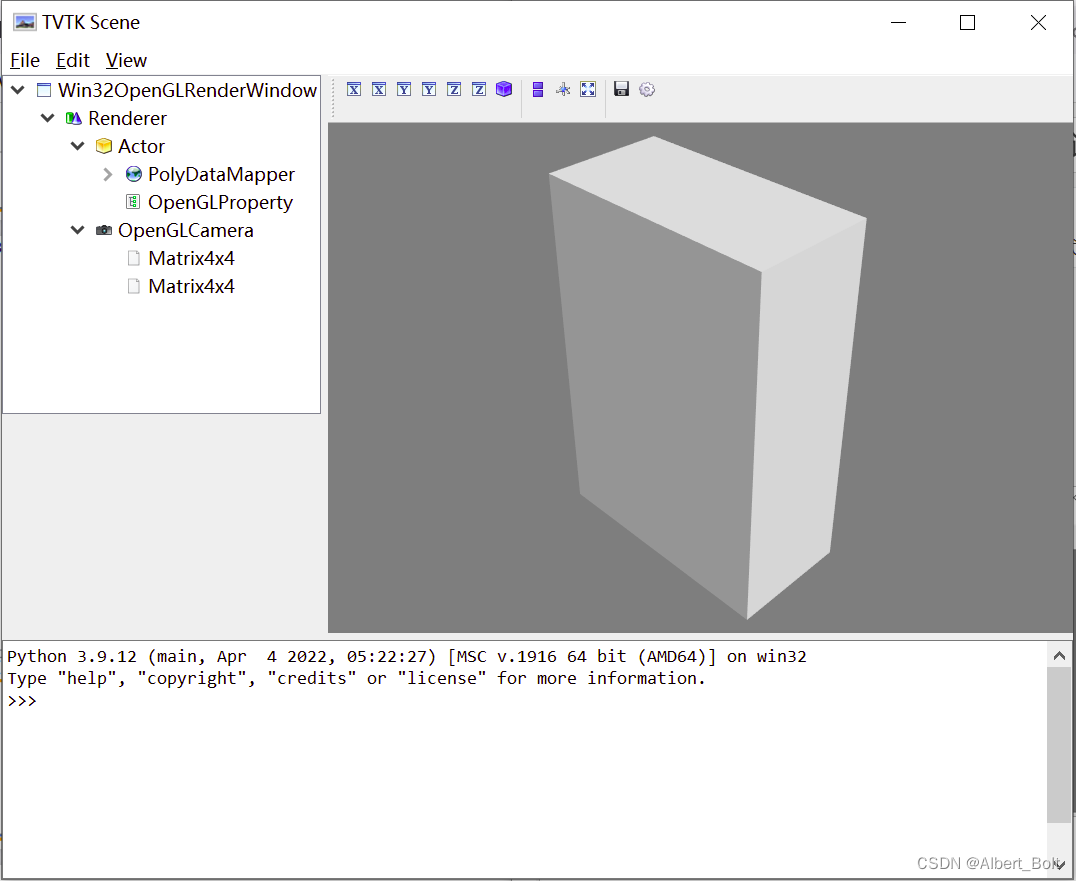
在下方命令行输入print(scene.renderer.actors[0].mapper.input.points.to_array())- 1
输出构成长方体顶点的三维坐标:

双击左侧 OpenGLCamera,可弹出照相机菜单;
双击左侧 Actor,可弹出实体 Actor 菜单:
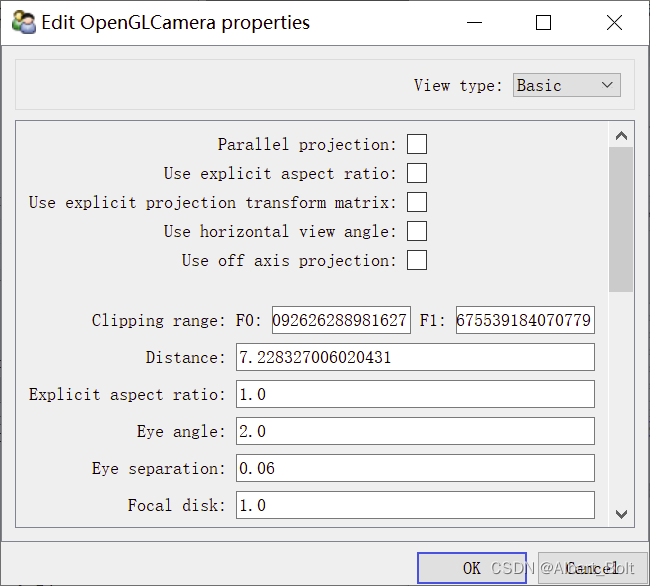
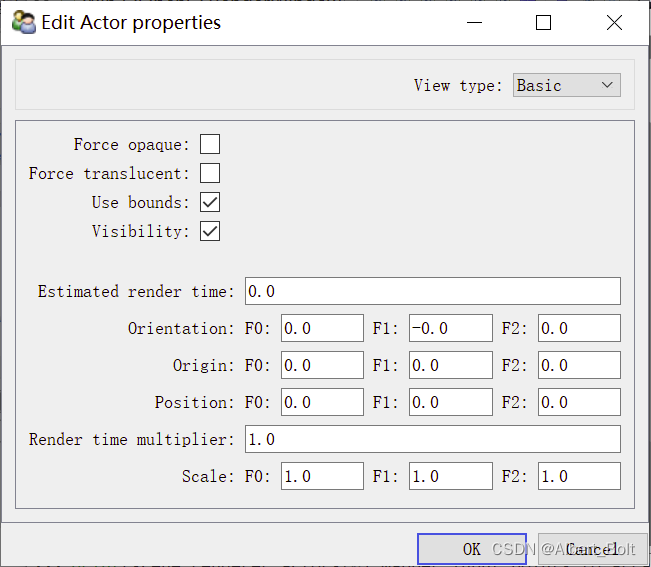
照相机包含如下属性:

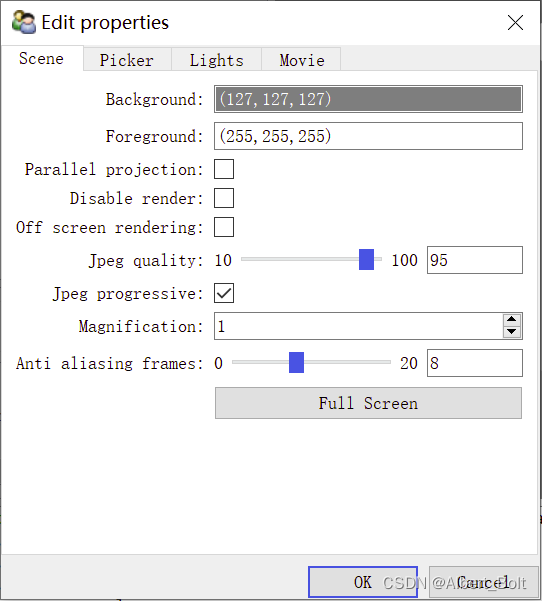
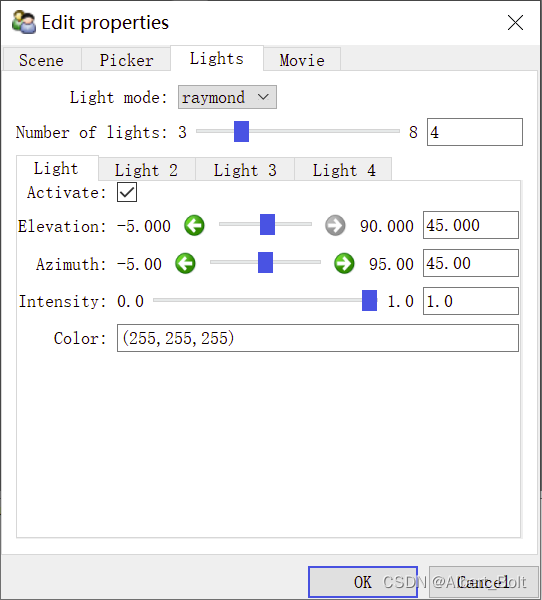
点击工具栏设置按钮,出现属性菜单,Scene 为场景,Lights 为光源:
三、TVTK 的数据
1. TVTK 的数据集
- 点(point)和数据(data)
- 点之间:连接 vs 非连接
- 多个相关的点组成单元(cell)
- 点的连接:显式 vs 隐式
- 数据:标量(scalar) vs 矢量(vector)
(1) Imagedata 数据集
表示二维或三维图像的数据结构: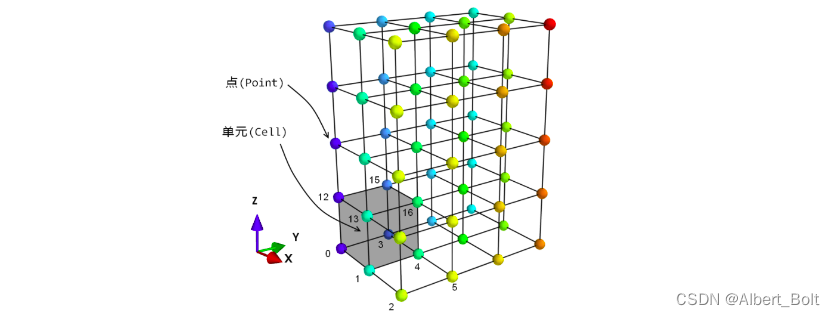

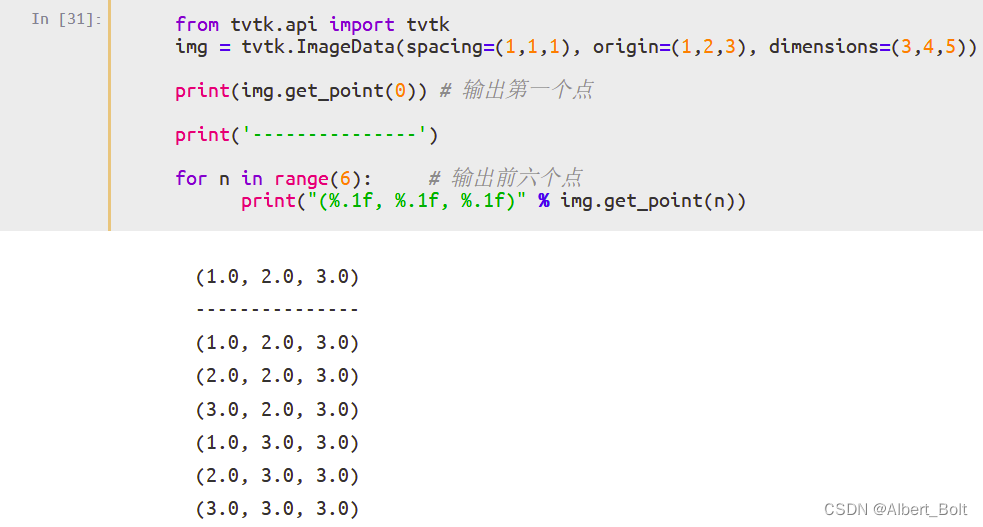
使用.get_point()获得点的坐标:
(2) RectilinearGrid 数据集
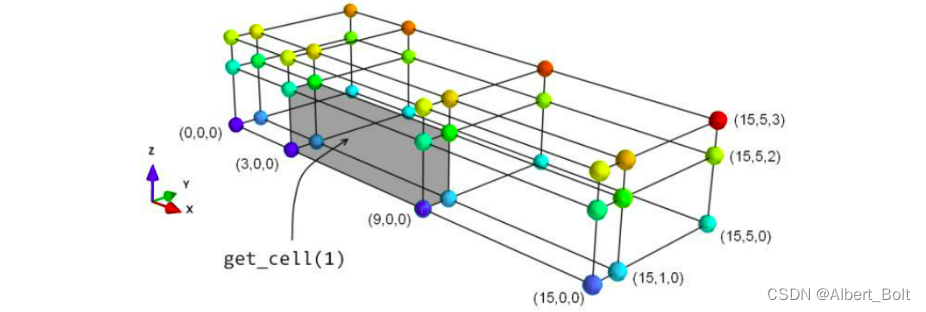
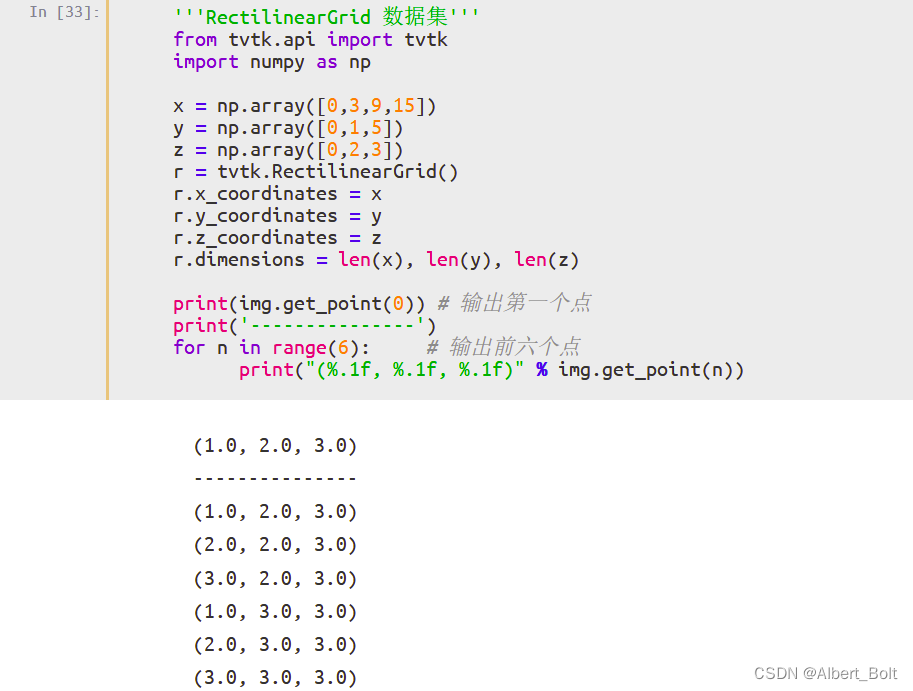
间距不均匀的网格,所有的点都在正交的网格上:
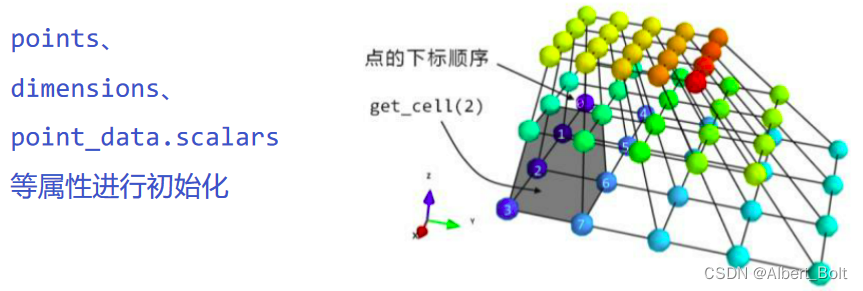
(3) StructuredGrid 数据集
创建任意形状的网格,需要指定点的坐标
(4) Polydata 数据集
由一系列的点、点之间的联系以及由点构成的多边形组成
2. TVTK 的数据加载
(1) TVTK 模型读取
s = tvtk.STLReader(file_name = 'stl文件')- 1
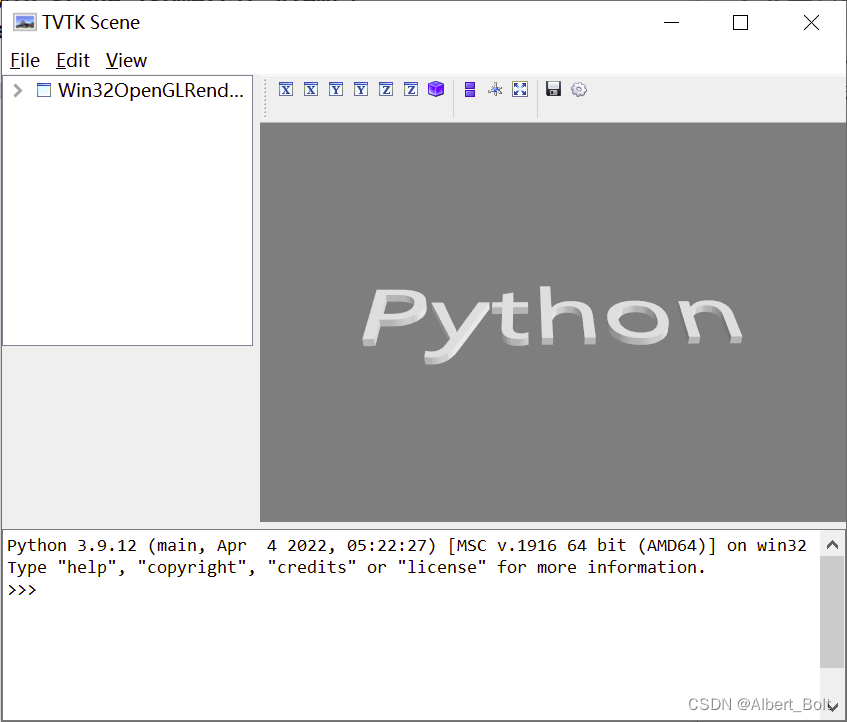
一个实例:
from tvtk.api import tvtk from tvtkfunc import ivtk_scene,event_loop s = tvtk.STLReader(file_name = "python.stl") m = tvtk.PolyDataMapper(input_connection = s.output_port) a = tvtk.Actor(mapper = m) win = ivtk_scene(a) win.scene.isometric_view() event_loop()- 1
- 2
- 3
- 4
- 5
- 6
- 7
- 8
- 9
- 10
(2) TVTK MultiBlock 数据读取一个实例:
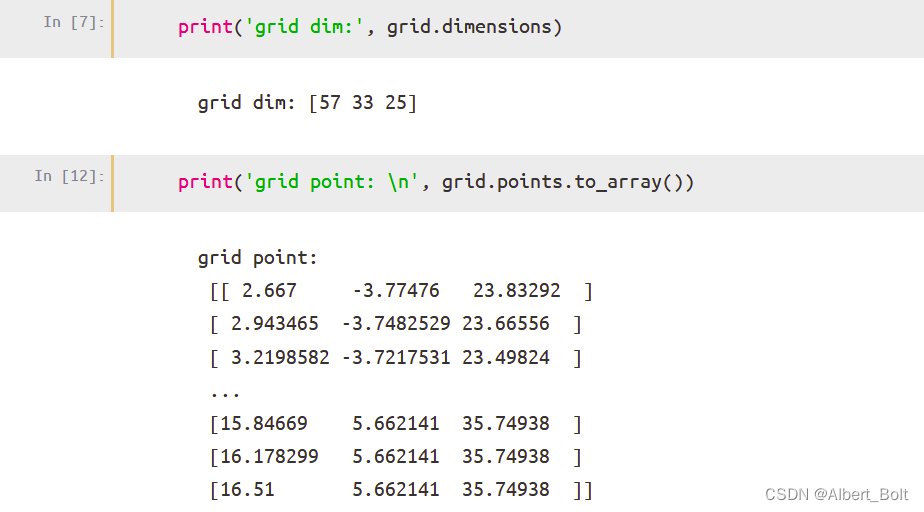
from tvtk.api import tvtk # 读入数据 def read_data(): plot3d = tvtk.MultiBlockPLOT3DReader( xyz_file_name = "combxyz.bin", # 网格文件 q_file_name = "combq.bin", # 空气动力学结果文件 scalar_function_number = 100, # 设置标量数据数量 vector_function_numbe r= 200 # 设置矢量数据数量 ) plot3d.update() return plot3d plot3d = read_data() grid = plot3d.output.get_block(0)- 1
- 2
- 3
- 4
- 5
- 6
- 7
- 8
- 9
- 10
- 11
- 12
- 13
- 14
- 15

-
相关阅读:
理德外汇:暑期美国经济活动增长“温和”,通胀放缓、就业受抑制
doris通关之概念、架构篇
java-dubbo接口测试三种方式
直播美颜SDK代码浅析:直播平台接入美颜SDK是怎样实现美颜的?
Deep Java Library(四)使用DJL Serving部署JAVA模型 For Windows
MNN简介
elementUI+Springboot实现导出excel功能
【Qt】QGroundControl入门2:下载、编译、错误处理、运行
Qml-跨窗口拖动图片、物体
Arweave/ceremic.network/cyberconnect.me/lens.dev介绍
- 原文地址:https://blog.csdn.net/Albert_Bolt/article/details/125515030
