-
【OpenCV 例程200篇】211. 绘制垂直矩形
【youcans 的 OpenCV 例程200篇】211. 绘制垂直矩形
7.1 绘图函数基本参数
OpenCV提供了绘图功能,可以在图像上绘制直线、矩形、圆、椭圆等各种几何图形。
函数 cv.line()、cv.rectangle()、cv.circle()、cv.polylines() 等分别用来在图像中绘制直线、矩形、圆形、多边形等几何形状,这些绘图函数中有一些的设置参数,介绍如下:
- img:输入输出图像,格式不限
- color:绘图线条的颜色,(b,g,r) 格式的元组,或者表示灰度值的标量
-
- thickness:绘制线条的粗细,默认值 1px,-1 表示内部填充
- lineType:绘制线段的线性,默认为 LINE_8
- cv.FILLED:内部填充(实心图形)
- cv.LINE_4:4 邻接线型
- cv.LINE_8:8 邻接线型
- cv.LINE_AA:抗锯齿线型,图像更平滑
- shift:点坐标的小数位数,默认为 0
7.3 绘制矩形
函数原型:
函数 cv.rectangle() 用来在图像上绘制垂直于图像边界的矩形。
cv.rectangle(img, pt1, pt2, color[, thickness=1, lineType=LINE_8, shift=0]) → img cv.rectangle(img, rec, color[, thickness=1, lineType=LINE_8, shift=0]) → img- 1
- 2
参数说明:
- img:输入输出图像,允许单通道灰度图像或多通道彩色图像
- pt1:矩阵第一个点的坐标,(x1, y1) 格式的元组
- pt2:与 pt1 成对角的矩阵第二个点的坐标,(x2, y2) 格式的元组
- color:绘图线条的颜色,(b,g,r) 格式的元组,或者表示灰度值的标量
- thickness:绘制矩形的线宽,默认值 1px,负数表示矩形内部填充
- lineType:绘制线段的线性,默认为 LINE_8
- shift:点坐标的小数位数,默认为 0
注意事项:
- 绘图操作会直接对传入的图像 img 进行修改,是否接受函数返回值都可以。如果要保持输入图像不变则要用 img.copy() 进行复制。
- 使用矩形的对角点 pt1、pt2 绘制矩形。pt1、pt2 次序无关可以互换,可以是左上、右下对角点,也可以是左下、右上对角点。
- 如果对角点坐标超出了图像边界,则绘制的矩形由图像边界剪裁,即只绘制图像边界内的部分矩形边框。
- 在彩色图像上绘图,线条颜色 color 可以元组 (b,g,r) 表示,如 (0,0,255) 表示红色;也可以是标量 b,但并不是表示灰度线条,而是表示颜色 (b,0,0)。
- 在单通道的灰度图像上只能绘制灰度线条,不能绘制彩色线条。但是,线条颜色 color 可以是标量 b,也可以是元组 (b,g,r),都会被解释为灰度值 b。元组中的后两个通道的参数是无效的。
- 绘制填充矩形时,推荐选择 thickness=-1 设置,关键词 “thickness” 可以省略。
- 在一些应用中,使用 (x , y, x+w, y+h) 定义对角点的坐标,注意 (x,y) 必须是矩形左上角顶点坐标。
- 使用
rec参数绘制矩形,r.tl()和r.br()是矩形的对角点。
Rect 矩形类:
在 OPenCV/C++ 中定义了 Rect 类,称为矩形类,包含 Point 类的成员变量 x、y(矩形左上角顶点坐标)和 Size 类的成员变量 width 和 height(矩形的宽度和高度)。
在 OpenCV/Python 中,不能直接创建 Rect 矩形类。但一些内部函数会使用或返回 Rect,如 cv.boundingRect。
rect = cv.boundingRect(contours[c]) cv.rectangle(img, (rect[0], rect[1]), (rect[0]+rect[2], rect[1]+rect[3]), (0,0,255))- 1
- 2
rect 在 C++中是返回的 Rect 矩形类,可以使用 rect.tl() 和 rect.br() 返回左上角和右下角的坐标。而在 python 中返回的是 4个元素的元组 (x , y, w, h),分别表示左上角顶点的坐标 (x,y)、矩形的宽度 w 和高度 h。
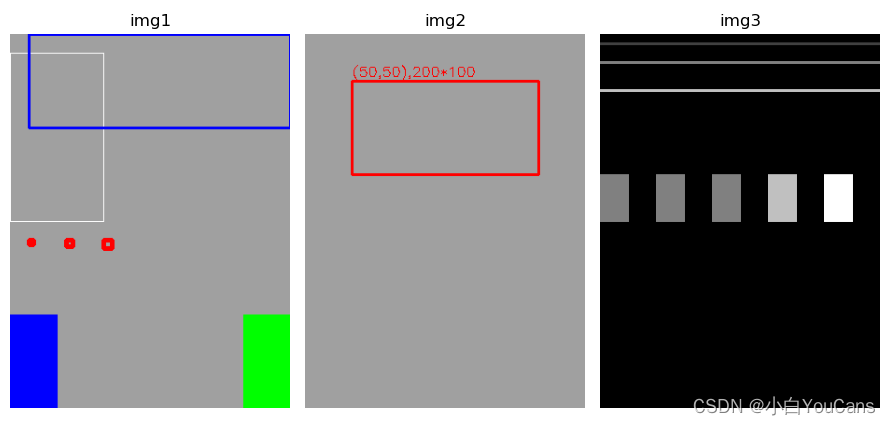
例程 A4.2:在图像上绘制垂直的矩形
# A4.2 在图像上绘制垂直的矩形 height, width, channels = 400, 300, 3 img = np.ones((height, width, channels), np.uint8)*160 # 创建黑色图像 RGB=0 img1 = img.copy() cv.rectangle(img1, (0,20), (100,200), (255,255,255)) # 白色 cv.rectangle(img1, (20,0), (300,100), (255,0,0), 2) # 蓝色 B=255 cv.rectangle(img1, (300,400), (250,300), (0,255,0), -1) # 绿色,填充 cv.rectangle(img1, (0,400), (50,300), 255, -1) # color=255 蓝色 cv.rectangle(img1, (20,220), (25,225), (0,0,255), 4) # 线宽的影响 cv.rectangle(img1, (60,220), (67,227), (0,0,255), 4) cv.rectangle(img1, (100,220), (109,229), (0,0,255), 4) img2 = img.copy() x, y, w, h = (50, 50, 200, 100) # 左上角坐标 (x,y), 宽度 w,高度 h cv.rectangle(img2, (x,y), (x+w,y+h), (0,0,255), 2) text = "({},{}),{}*{}".format(x, y, w, h) cv.putText(img2, text, (x, y-5), cv.FONT_HERSHEY_SIMPLEX, 0.5, (0,0,255)) # 绘制直线可以用于灰度图像,参数 color 只有第一通道值有效,并被设为灰度值 gray = np.zeros((height, width), np.uint8) # 创建灰度图像 img3 = cv.line(gray, (0,10), (300,10), 64, 2) cv.line(img3, (0,30), (300,30), (128,128,255), 2) cv.line(img3, (0,60), (300,60), (192,64,255), 2) cv.rectangle(img3, (0,200), (30,150), 128, -1) # Gray=128 cv.rectangle(img3, (60,200), (90,150), (128,0,0), -1) # Gray=128 cv.rectangle(img3, (120,200), (150,150), (128,255,255), -1) # Gray=128 cv.rectangle(img3, (180,200), (210,150), 192, -1) # Gray=192 cv.rectangle(img3, (240,200), (270,150), 255, -1) # Gray=255 plt.figure(figsize=(9, 6)) plt.subplot(131), plt.title("img1"), plt.axis('off') plt.imshow(cv.cvtColor(img1, cv.COLOR_BGR2RGB)) plt.subplot(132), plt.title("img2"), plt.axis('off') plt.imshow(cv.cvtColor(img2, cv.COLOR_BGR2RGB)) plt.subplot(133),plt.title("img3"), plt.axis('off') plt.imshow(img3, cmap="gray") plt.tight_layout() plt.show()- 1
- 2
- 3
- 4
- 5
- 6
- 7
- 8
- 9
- 10
- 11
- 12
- 13
- 14
- 15
- 16
- 17
- 18
- 19
- 20
- 21
- 22
- 23
- 24
- 25
- 26
- 27
- 28
- 29
- 30
- 31
- 32
- 33
- 34
- 35
- 36
- 37
- 38
- 39
例程结果:

【本节完】
版权声明:
参考文献: Use the Photoshop Levels adjustment (adobe.com)
youcans@xupt 原创作品,转载必须标注原文链接:(https://blog.csdn.net/youcans/article/details/125432101)
Copyright 2022 youcans, XUPT
Crated:2022-6-20
欢迎关注 『youcans 的 OpenCV 例程 200 篇』 系列,持续更新中
欢迎关注 『youcans 的 OpenCV学习课』 系列,持续更新中 -
相关阅读:
EasyCVR云端录像和设备录像如何区分?哪些接入协议支持设备录像回看?
设计模式-装饰器模式
Mysql连接池详解——原理部分
GraphQL(1):GraphQL简介
深度学习入门(五十四)循环神经网络——文本预处理
.NET Framework 2023 年 8 月安全和质量汇总更新
瑞利衰落条件下扩频通信系统误码率仿真
【C++从0到王者】第三十二站:异常
Go 反射
“漫丝路”主题餐饮空间设计
- 原文地址:https://blog.csdn.net/youcans/article/details/125459514