-
基于tensorflow和NasNet的皮肤癌分类项目
数据来源
https://challenge.isic-archive.com/data/#2019
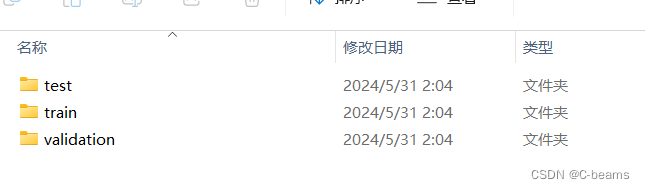
数据划分
写了个脚本划分
- for line in open('ISIC/labels.csv').readlines()[1:]:
- split_line = line.split(',')
- img_file = split_line[0]
- benign_malign = split_line[1]
- # 0.8 for train, 0.1 for test, 0.1 for validation
- random_num = random.random()
- if random_num < 0.8:
- location = train
- train_examples += 1
- elif random_num < 0.9:
- location = validation
- validation_examples += 1
- else:
- location = test
- test_examples += 1
- if int(float(benign_malign)) == 0:
- shutil.copy(
- 'ISIC/images/' + img_file + '.jpg',
- location + 'benign/' + img_file + '.jpg'
- )
- elif int(float(benign_malign)) == 1:
- shutil.copy(
- 'ISIC/images/' + img_file + '.jpg',
- location + 'malignant/' + img_file + '.jpg'
- )
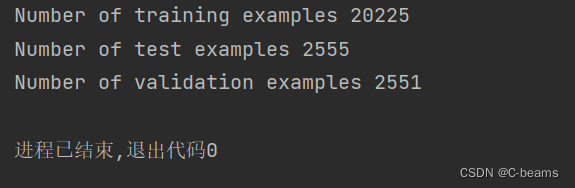
- print(f'Number of training examples {train_examples}')
- print(f'Number of test examples {test_examples}')
- print(f'Number of validation examples {validation_examples}')
数据生成模块
- train_datagen = ImageDataGenerator(
- rescale=1.0 / 255,
- rotation_range=15,
- zoom_range=(0.95, 0.95),
- horizontal_flip=True,
- vertical_flip=True,
- data_format='channels_last',
- dtype=tf.float32,
- )
- train_gen = train_datagen.flow_from_directory(
- 'data/train/',
- target_size=(img_height, img_width),
- batch_size=batch_size,
- color_mode='rgb',
- class_mode='binary',
- shuffle=True,
- seed=123,
- )
模型加载和运行
由于数据量较大,本次使用NasNet, 来源于nasnet | Kaggle
- # NasNet
- model = keras.Sequential([
- hub.KerasLayer(r'C:\\Users\\32573\\Desktop\\tools\py\\cancer_classification_project\\saved_model',
- trainable=True),
- layers.Dense(1, activation='sigmoid'),
- ])
- model.compile(
- optimizer=keras.optimizers.Adam(3e-4),
- loss=[keras.losses.BinaryCrossentropy(from_logits=False)],
- metrics=['accuracy']
- )
- model.fit(
- train_gen,
- epochs=1,
- steps_per_epoch=train_examples // batch_size,
- validation_data=validation_gen,
- validation_steps=validation_examples // batch_size,
- )
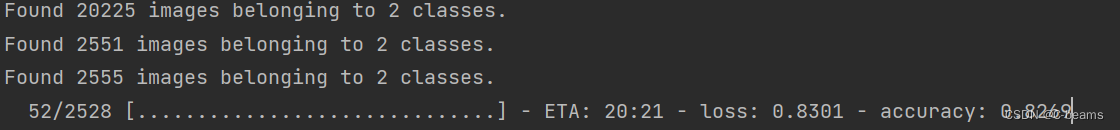
运行结果
模型其他评估指标
- METRICS = [
- keras.metrics.BinaryAccuracy(name='accuracy'),
- keras.metrics.Precision(name='precision'),
- keras.metrics.Recall(name='Recall'),
- keras.metrics.AUC(name='AUC'),
- ]
绘制roc图
- def plot_roc(label, data):
- predictions = model.predict(data)
- fp, tp, _ = roc_curve(label, predictions)
- plt.plot(100*fp, 100*tp)
- plt.xlabel('False Positives [%]')
- plt.ylabel('True Positives [%]')
- plt.show()
- test_labels = np.array([])
- num_batches = 0
- for _, y in test_gen:
- test_labels = np.append(test_labels, y)
- num_batches = 1
- if num_batches == math.ceil(test_examples / batch_size):
- break
- plot_roc(test_labels, test_gen)

-
相关阅读:
vue2+elementUI,vue3+elementPlus解决form中的下拉列表回写显示id,不显示label
GraphQL 入门
车间调度|基于遗传算法的柔性车间调度(Matlab代码实现)
迭代器的封装与反向迭代器
【pytorch09】数学运算
前端面试官会问的问题
R reason ‘拒绝访问‘的解决方案
day13:MyBatis映射文件深入
几种反序列化漏洞
什么是 mapState 助手?
- 原文地址:https://blog.csdn.net/2401_82787858/article/details/139338035