-
小程序图形:echarts-weixin 入门使用
去官网下载整个项目:
https://github.com/ecomfe/echarts-for-weixin

拷贝ec-canvs文件夹到小程序里面

index.js里面的写法
- import * as echarts from "../../components/ec-canvas/echarts"
- const app = getApp();
- function initChart(canvas, width, height, dpr) {
- const chart = echarts.init(canvas, null, {
- width: width,
- height: height,
- devicePixelRatio: dpr
- });
- canvas.setChart(chart);
- var option = {
- backgroundColor: "#ffffff",
- series: [{
- label: {
- normal: {
- fontSize: 14
- }
- },
- type: 'pie',
- center: ['50%', '50%'],
- radius: ['20%', '40%'],
- data: [{
- value: 55,
- name: '北京'
- }, {
- value: 20,
- name: '武汉'
- }, {
- value: 10,
- name: '杭州'
- }, {
- value: 20,
- name: '广州'
- }, {
- value: 38,
- name: '上海'
- }]
- }]
- };
- chart.setOption(option);
- return chart;
- }
- Page({
- /**
- * 页面的初始数据
- */
- data: {
- ec: {onInit: initChart}
- }
- })
index.json里面的写法
- {
- "usingComponents": {
- "ec-canvas":"../../components/ec-canvas/ec-canvas"
- }
- }
页面的写法
- <view class="chart">
- <ec-canvas id="mychart-dom-pie" canvas-id="mychart-pie" ec="{{ ec }}"></ec-canvas>
- </view>
样式大小控制
- .chart{
- width: 100%;
- height: 300px;
- }
- ec-canvas {width: 100%;height: 100%;}
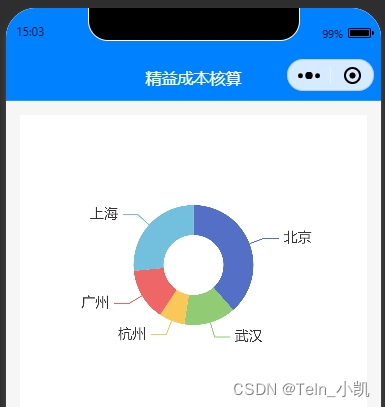
效果图

-
相关阅读:
CMS-织梦[dede]-通用免登发布插件
django基于Python的房价预测系统+爬虫+大屏可视化分析
数据链路层-可靠传输实现机制(回退N帧协议GBN)
ios CI/CD 持续集成 组件化专题三 IOS打包Bundle与加载Bundle中的图片
Oracle/PLSQL: Round Function (with numbers)
【EI会议征稿】2023计算机网络技术与电子信息工程国际学术会议(CNTEIE 2023)
1V1音视频实时互动直播系统
用了4年,终于发现了这款国产报表工具的魅力
代码随想录刷题|LeetCode 1143.最长公共子序列 1035.不相交的线 53. 最大子序和 动态规划
FFmpeg对H246进行编解码的实现
- 原文地址:https://blog.csdn.net/qq873113580/article/details/136416126
