-
vue或webpack加载highcharts与highcharts-3d
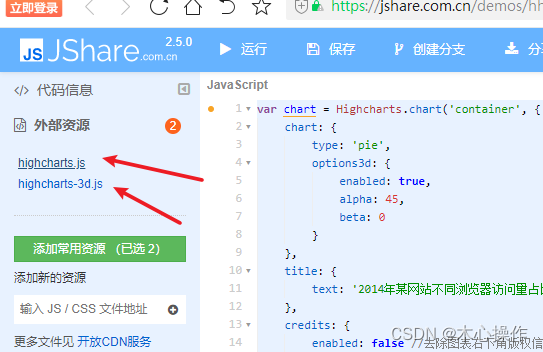
highcharts与highcharts-3d下载
https://jshare.com.cn/demos/hhhhiG点击对应的文件可打开,复制代码到(创建一个同名文件)里面;放到项目对应目录下

引入
两种引入 highcharts.js 方法皆可用;注意 highcharts-3d 引入方式
- import Highcharts from './static/js/highcharts.js'
- // const Highcharts = require('./static/js/highcharts.js')
- require('./static/js/highcharts-3d')(Highcharts)
调用
在vue中使用
- new Vue({
- el: '#app',
- data() {
- return {}
- },
- mounted() {
- this.$nextTick(() => {
- this.renderHighcharts()
- })
- },
- methods: {
- renderHighcharts() {
- var chart = Highcharts.chart('container', {
- chart: {
- type: 'pie',
- backgroundColor: 'rgba(0,0,0,0)',
- options3d: {
- enabled: true,
- alpha: 45,
- beta: 0
- }
- },
- title: {
- text: '访问量占比',
- style: {
- color: 'white',
- fontWeight: 'bold'
- }
- },
- credits: {
- enabled: false //去除图表右下角版权信息
- },
- tooltip: {
- pointFormat: '{series.name}: {point.percentage:.1f}%'
- },
- plotOptions: {
- pie: {
- allowPointSelect: true,
- cursor: 'pointer',
- depth: 35,
- dataLabels: {
- enabled: true,
- format: '{point.name}({point.y})'
- }
- }
- },
- series: [
- {
- type: 'pie',
- name: '占比',
- style: {
- color: 'white'
- },
- data: [
- ['Firefox', 45.0],
- ['IE', 26.8],
- ['Safari', 8.5]
- ]
- }
- ]
- })
- }
- }
- })
-
相关阅读:
【Win10】如何关闭Windows10自动更新
SSM+图书馆电子文件资源管理 毕业设计-附源码191614
企业私域流量带给企业的四个价值
【Azure 应用服务】NodeJS Express + MSAL 实现API应用Token认证(AAD OAuth2 idToken)的认证实验 -- passport.authenticate()
【递归】树形结构、list转map
【2022全网最全教程】快速上手前端自动化测试
matlab数独运行不出来
DM8:达梦数据库dexp-DMP逻辑导出按用户模式定时自动备份数据库
深度监督(中继监督)
Android逆向——脱壳解析
- 原文地址:https://blog.csdn.net/qq_41579327/article/details/136205235
