-
怎么在echarts图上左右滑动切换数据区间
说在前面
不管前端还是后端,大家或多或少都了解使用过echarts图表吧,很多时候我们只是需要展示指定区间的数据,但有时我们希望在图表上能够轻松地切换数据的展示区间,以便更清晰地观察特定时间段或区域的变化。在本文中,我将向大家介绍如何实现在 ECharts 图表上左右滑动切换数据区间的功能,让数据展示交互变得更加灵活。
效果展示

体验地址
http://jyeontu.xyz/JDemo/#/echartScroll
代码实现
1、了解一下
echarts.getZr()在 ECharts 中,
getZr()是一个常用的方法,它可以获取到 ECharts 实例中的 ZRender 实例。首先,需要说明的是,ECharts 中的图表实现都依赖于一个开源的 2D 渲染引擎 ZRender,而
getZr()方法就是用于获取该渲染引擎实例。在 ECharts 中,我们可以通过以下方式来获取 ECharts 实例:
var myChart = echarts.init(dom);- 1
在这个实例对象中,就包含了我们所需要的
getZr()方法。接下来,我们可以通过
myChart.getZr()来获取到 ZRender 实例,并利用其提供的 API 进行一些自定义的操作,例如:var zr = myChart.getZr(); var storage = zr.storage; var group = new zrender.Group(); storage.add(group); var rect = new zrender.Rect({ shape: { x: 10, y: 10, width: 100, height: 100 }, style: { fill: '#f00' } }); group.add(rect); zr.refresh();- 1
- 2
- 3
- 4
- 5
- 6
- 7
- 8
- 9
- 10
- 11
- 12
- 13
- 14
- 15
- 16
- 17
- 18
- 19
- 20
在上面的代码中,我们首先通过
getZr()方法获取到 ZRender 实例,并创建了一个新的Group对象,并向其中添加了一个矩形Rect对象。最后我们调用了refresh()方法来刷新渲染界面,使我们新创建的矩形能够显示在图表上。总之,
getZr()方法为我们提供了更多自定义 ECharts 图表的可能性,例如添加自定义的图形、动画等效果2、
echarts.getZr().on(eventType, handler)getZr().on(eventType, handler)是在 ECharts 中用于监听 ZRender 实例上指定事件类型的方法。它允许我们在特定的事件发生时执行相应的处理函数。具体使用方法如下:
- 通过
getZr()方法获取到 ZRender 实例,例如const zr = myChart.getZr();。 - 使用
on()方法来监听指定的事件类型和相应的处理函数,例如zr.on('click', handleClick);。其中,eventType为事件类型,可以是鼠标事件(如click、mousemove等),也可以是自定义事件;handler则是事件触发时要执行的处理函数。 - 在处理函数中编写相应的逻辑,例如:
function handleClick(params) { // 处理鼠标点击事件 console.log('Clicked at x: ' + params.event.clientX + ', y: ' + params.event.clientY); }- 1
- 2
- 3
- 4
在上述代码中,当用户在图表上点击时,
handleClick函数会被调用,并且参数params中包含了事件的相关信息,例如鼠标坐标等。通过
getZr().on()方法,我们可以实现对图表的交互操作进行监听和响应,从而实现更加丰富和灵活的数据可视化效果。3、echarts鼠标事件监听
通过前面的介绍,我们知道可以通过
echarts.getZr().on(eventType, handler)来对图表的交互操作进行监听和响应:(1)监听touchstart事件或mousedown事件,记录起始位置
监听touchstart事件或mousedown事件,记录起始位置,并将当前状态置为滑动状态。
myEcharts.getZr().on("mousedown", e => { this.lastX = e.offsetX || e.event.zrX; this.isTouch = true; }); myEcharts.getZr().on("touchstart", e => { this.lastX = e.offsetX || e.event.zrX; this.isTouch = true; });- 1
- 2
- 3
- 4
- 5
- 6
- 7
- 8
(2)监听touchmove事件或mousemove事件,计算滑动距离并触发相应操作
这里我们需要注意的是,
mousemove和touchmove都是连续触发的事件,所以我们需要对其加一个防抖处理,防止连续触发多次。debounce(func, delay = 100) { let timer; return function(...args) { clearTimeout(timer); timer = setTimeout(() => { func.apply(this, args); }, delay); }; }, mousemove(e) { if (this.isTouch) { const currentX = e.offsetX || e.event.zrX; const distance = currentX - this.lastX; if (distance > this.distance) { this.$emit("moveRight"); } else if (distance < -this.distance) { this.$emit("moveLeft"); } this.lastX = currentX; } }, myEcharts.getZr().on("mousemove", this.debounce(this.mousemove)); myEcharts.getZr().on("touchmove", this.debounce(this.mousemove));- 1
- 2
- 3
- 4
- 5
- 6
- 7
- 8
- 9
- 10
- 11
- 12
- 13
- 14
- 15
- 16
- 17
- 18
- 19
- 20
- 21
- 22
- 23
(3)监听touchend事件或mouseup事件,重置状态
鼠标抬起的时候重置状态,防止鼠标没有点击的时候触发滑动事件。
myEcharts.getZr().on("mouseup", () => { this.isTouch = false; }); myEcharts.getZr().on("touchend", () => { this.isTouch = false; });- 1
- 2
- 3
- 4
- 5
- 6
4、echarts数据生成
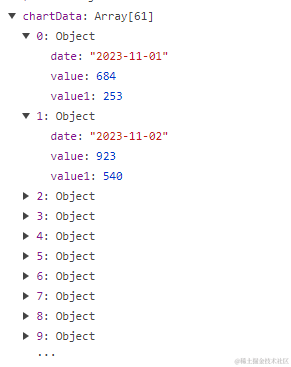
这里我们可以随机生成两个月的数据来进行展示:
initChartData(startDate, endDate) { startDate = new Date(startDate); endDate = new Date(endDate); const dateArray = []; for ( let date = new Date(startDate); date <= endDate; date.setDate(date.getDate() + 1) ) { const randomValue = Math.floor(Math.random() * (1000 - 500 + 1)) + 500; const randomValue1 = Math.floor(Math.random() * (1000 - 200 + 1)) + 200; const dateString = date.toISOString().slice(0, 10); dateArray.push({ date: dateString, value: randomValue, value1: randomValue1 }); date = new Date(date); // 修复日期对象被修改的问题 } return dateArray; },- 1
- 2
- 3
- 4
- 5
- 6
- 7
- 8
- 9
- 10
- 11
- 12
- 13
- 14
- 15
- 16
- 17
- 18
- 19
- 20
- 21

5、echarts数据配置
我们可以通过数据起始下标和展示数据个数来确定当前图表中需要展示的数据区间,再从总数据中去进行截取。
initOption(start = 0) { if (start > this.chartData.length - this.len) start = this.chartData.length - this.len; if (start < 0) start = 0; if (this.startInd === start) return; this.startInd = start; const end = start + this.len; const chartData = this.chartData.slice(start, end); this.option = { tooltip: { trigger: "axis" }, xAxis: { type: "category", data: chartData.map(item => item.date) }, yAxis: { type: "value" }, series: [ { name: "数据1", data: chartData.map(item => item.value), type: "line", smooth: true }, { name: "数据2", data: chartData.map(item => item.value1), type: "line", smooth: true } ] }; },- 1
- 2
- 3
- 4
- 5
- 6
- 7
- 8
- 9
- 10
- 11
- 12
- 13
- 14
- 15
- 16
- 17
- 18
- 19
- 20
- 21
- 22
- 23
- 24
- 25
- 26
- 27
- 28
- 29
- 30
- 31
- 32
- 33
- 34
- 35
6、左右滑动切换数据区间
想要切换展示的数据区间,我们只需要修改数据起始下标即可:
moveLeft() { if (this.startInd === 0) this.$toast.show("前面没有更多数据了"); this.initOption(this.startInd - this.len); }, moveRight() { if (this.startInd >= this.chartData.length - this.len) this.$toast.show("后面没有更多数据了"); this.initOption(this.startInd + this.len); }- 1
- 2
- 3
- 4
- 5
- 6
- 7
- 8
- 9
源码地址
gitee
https://gitee.com/zheng_yongtao/jyeontu-vue-demo.git
公众号
关注公众号『
前端也能这么有趣』发送vueDemo即可获取源码。说在后面
🎉 这里是 JYeontu,现在是一名前端工程师,有空会刷刷算法题,平时喜欢打羽毛球 🏸 ,平时也喜欢写些东西,既为自己记录 📋,也希望可以对大家有那么一丢丢的帮助,写的不好望多多谅解 🙇,写错的地方望指出,定会认真改进 😊,偶尔也会在自己的公众号『
前端也能这么有趣』发一些比较有趣的文章,有兴趣的也可以关注下。在此谢谢大家的支持,我们下文再见 🙌。 -
相关阅读:
【数学建模】混合整数规划MIP(Python+Gurobi代码实现)
无需配置MySQL,Navicat也有在线版了?
【计算机网络】图解应用层协议
【无标题】
k8s nginx .yaml 测试
就在刚刚这份java八股文成功让我进入字节,拿到了人生第一个18k
pytorch固定随机数中种子
setoolkit启动报错的问题
C++从零开始的打怪升级之路(day44)
Springboot门诊电子处方管理系统3kqta计算机毕业设计-课程设计-期末作业-毕设程序代做
- 原文地址:https://blog.csdn.net/Twinkle_sone/article/details/134522350
