-
K8S篇之实现利用Prometheus监控pod的实时数据指标
一、监控部署
1、将k8s集群中kube-state-metrics指标进行收集,服务进行部署
1.1 pod性能指标(k8s集群组件自动集成)
k8s组件本身提供组件自身运行的监控指标以及容器相关的监控指标。通过cAdvisor 是一个开源的分析容器资源使用率和性能特性的代理工具,集成到 Kubelet中,当Kubelet启动时会同时启动cAdvisor,且一个cAdvisor只监控一个Node节点的信息。cAdvisor 自动查找所有在其所在节点上的容器,自动采集 CPU、内存、文件系统和网络使用的统计信息。cAdvisor 通过它所在节点机的 Root 容器,采集并分析该节点机的全面使用情况。
当然kubelet也会输出一些监控指标数据,因此pod的监控数据有kubelet和cadvisor,监控url分别为
https://NodeIP:10250/metrics
https://NodeIP:10250/metrics/cadvisor
1.2 K8S资源监控(k8s集群内部署)
kube-state-metrics是一个简单的服务,它监听Kubernetes API服务器并生成关联对象的指标。它不关注单个Kubernetes组件的运行状况,而是关注内部各种对象(如deployment、node、pod等)的运行状况。
注:先手动检查下集群,是否已经安装kube-state-metrics
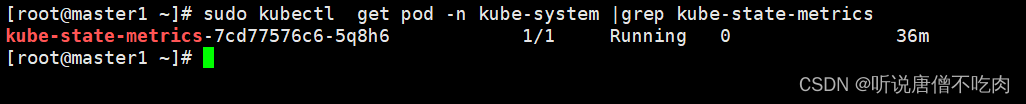
如果集群没有安装,可参考如下步骤进行部署:docker pull gcr.io/google_containers/kube-state-metrics:v1.6.0 // 镜像打标签,设置为当前k8s配置的镜像仓库地址 docker tag quay.io/coreos/kube-state-metrics:v1.9.0 dockerhub.kubekey.local/library/kube-state-metrics:v1.9.0 // 推进仓库 docker push dockerhub.kubekey.local/library/kube-state-metrics:v1.9.0- 1
- 2
- 3
- 4
- 5
1.3 编辑kube-state-metrics.yml文件
vim kube-state-metrics.yml- 1
--- apiVersion: v1 kind: ServiceAccount metadata: labels: app: kube-state-metrics name: kube-state-metrics namespace: prometheus --- apiVersion: rbac.authorization.k8s.io/v1 kind: ClusterRole metadata: name: kube-state-metrics rules: - apiGroups: [""] resources: - configmaps - secrets - nodes - pods - services - resourcequotas - replicationcontrollers - limitranges - persistentvolumeclaims - persistentvolumes - namespaces - endpoints verbs: ["list", "watch"] - apiGroups: ["extensions"] resources: - daemonsets - deployments - replicasets - ingresses verbs: ["list", "watch"] - apiGroups: ["apps"] resources: - daemonsets - deployments - replicasets - statefulsets verbs: ["list", "watch"] - apiGroups: ["batch"] resources: - cronjobs - jobs verbs: ["list", "watch"] - apiGroups: ["autoscaling"] resources: - horizontalpodautoscalers verbs: ["list", "watch"] - apiGroups: ["policy"] resources: - poddisruptionbudgets verbs: ["list", "watch"] - apiGroups: ["certificates.k8s.io"] resources: - certificatesigningrequests verbs: ["list", "watch"] - apiGroups: ["storage.k8s.io"] resources: - storageclasses verbs: ["list", "watch"] - apiGroups: ["autoscaling.k8s.io"] resources: - verticalpodautoscalers verbs: ["list", "watch"] --- apiVersion: rbac.authorization.k8s.io/v1 kind: ClusterRoleBinding metadata: labels: app: kube-state-metrics name: kube-state-metrics roleRef: apiGroup: rbac.authorization.k8s.io kind: ClusterRole name: kube-state-metrics subjects: - kind: ServiceAccount name: kube-state-metrics namespace: prometheus --- #apiVersion: extensions/v1beta1 apiVersion: apps/v1 kind: Deployment metadata: labels: app: kube-state-metrics name: kube-state-metrics namespace: prometheus spec: replicas: 1 selector: matchLabels: app: kube-state-metrics strategy: rollingUpdate: maxSurge: 1 maxUnavailable: 0 type: RollingUpdate template: metadata: labels: app: kube-state-metrics spec: containers: # 注意,这里image地址修改为你k8s配置的仓库地址 - image: dockerhub.kubekey.local/library/kube-state-metrics:v1.9.0 imagePullPolicy: IfNotPresent livenessProbe: failureThreshold: 3 httpGet: path: / port: 8080 scheme: HTTP initialDelaySeconds: 30 periodSeconds: 10 successThreshold: 1 timeoutSeconds: 30 name: kube-state-metrics ports: - containerPort: 8080 protocol: TCP readinessProbe: failureThreshold: 3 httpGet: path: / port: 8080 scheme: HTTP initialDelaySeconds: 30 periodSeconds: 10 successThreshold: 1 timeoutSeconds: 5 resources: limits: cpu: 500m memory: 768Mi requests: cpu: 250m memory: 768Mi restartPolicy: Always serviceAccount: kube-state-metrics serviceAccountName: kube-state-metrics --- apiVersion: v1 kind: Service metadata: labels: app: kube-state-metrics name: kube-state-metrics namespace: prometheus spec: ports: - name: kube-state-metrics port: 80 protocol: TCP targetPort: 8080 selector: app: kube-state-metrics ## 注意这里kube-state-metrics暴露类型修改为NodePort对外暴露 type: NodePort- 1
- 2
- 3
- 4
- 5
- 6
- 7
- 8
- 9
- 10
- 11
- 12
- 13
- 14
- 15
- 16
- 17
- 18
- 19
- 20
- 21
- 22
- 23
- 24
- 25
- 26
- 27
- 28
- 29
- 30
- 31
- 32
- 33
- 34
- 35
- 36
- 37
- 38
- 39
- 40
- 41
- 42
- 43
- 44
- 45
- 46
- 47
- 48
- 49
- 50
- 51
- 52
- 53
- 54
- 55
- 56
- 57
- 58
- 59
- 60
- 61
- 62
- 63
- 64
- 65
- 66
- 67
- 68
- 69
- 70
- 71
- 72
- 73
- 74
- 75
- 76
- 77
- 78
- 79
- 80
- 81
- 82
- 83
- 84
- 85
- 86
- 87
- 88
- 89
- 90
- 91
- 92
- 93
- 94
- 95
- 96
- 97
- 98
- 99
- 100
- 101
- 102
- 103
- 104
- 105
- 106
- 107
- 108
- 109
- 110
- 111
- 112
- 113
- 114
- 115
- 116
- 117
- 118
- 119
- 120
- 121
- 122
- 123
- 124
- 125
- 126
- 127
- 128
- 129
- 130
- 131
- 132
- 133
- 134
- 135
- 136
- 137
- 138
- 139
- 140
- 141
- 142
- 143
- 144
- 145
- 146
- 147
- 148
- 149
- 150
- 151
- 152
- 153
- 154
- 155
- 156
- 157
- 158
- 159
- 160
- 161
- 162
- 163
1.4 启动yaml文件
kubectl apply -f kube-state-metrics.yaml- 1

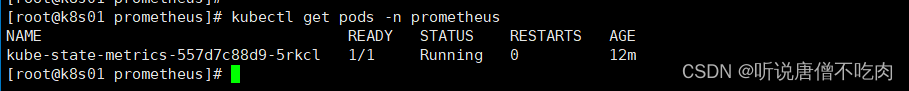
1.5 查看pod信息kubectl get pod -n prometheus- 1
1.6 查看service信息kubectl get svc -n prometheus- 1
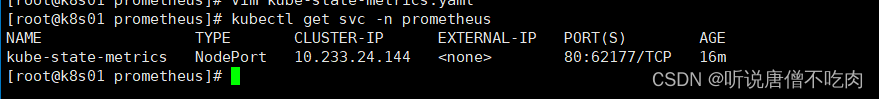
这里可以看到k8s集群对外暴露的端口为 62177
1.7 查看集群信息kubectl get po -n prometheus -owide- 1
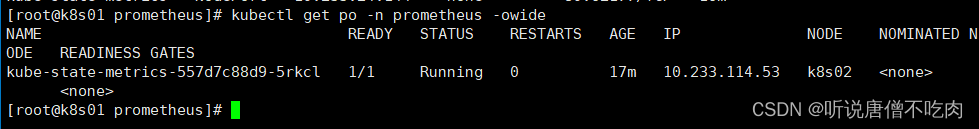
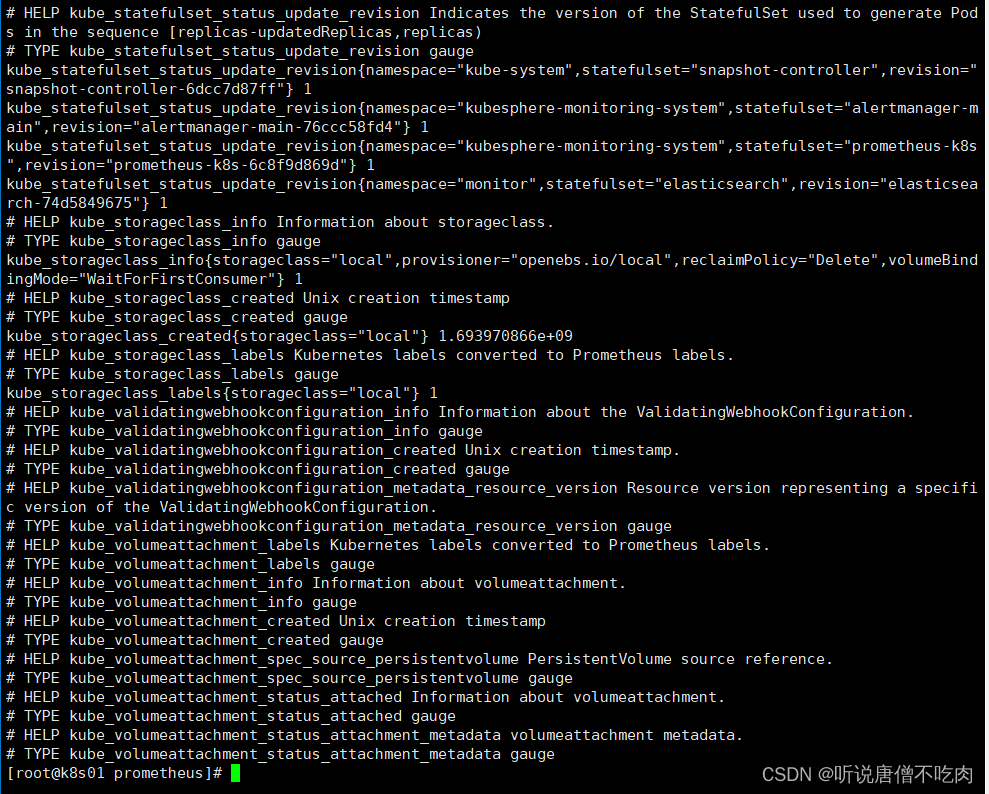
然后查看metrics信息
可以手动curl k8s02:62177/metrics- 1
正常,数据metrics就会出现
二、创建token供集群外部访问
集群外部监控K8s集群,通过访问kube-apiserver来访问集群资源。通过这种方式集群外部prometheus也能自动发现k8s集群服务# 1.创建serviceaccounts kubectl create sa prometheus -n default # 2.创建prometheus角色并对其绑定cluster-admin kubectl create clusterrolebinding prometheus --clusterrole cluster-admin --serviceaccount=default:prometheus # 3. 创建secret; k8s1.24之后默认不会为serveiceaccounts创建secret kubectl apply -f - <<EOF apiVersion: v1 kind: Secret type: kubernetes.io/service-account-token metadata: name: prometheus-token namespace: default annotations: kubernetes.io/service-account.name: "prometheus" EOF # 4. 测试访问kube-apiserver APISERVER=$(kubectl config view --minify -o jsonpath='{.clusters[0].cluster.server}') TOKEN=$(kubectl get secret prometheus-token -n default -o jsonpath='{.data.token}' | base64 --decode) curl $APISERVER/api --header "Authorization: Bearer $TOKEN" --insecure # 5. 保存token echo $TOKEN > k8s_token # 6. 测试访问指标 # 访问pod性能资源指标:(访问kubelet) # 注意:master1为当前master节点的hostname,需要修改 curl $APISERVER/api/v1/nodes/master1:10250/proxy/metrics --header "Authorization: Bearer $TOKEN" --insecure- 1
- 2
- 3
- 4
- 5
- 6
- 7
- 8
- 9
- 10
- 11
- 12
- 13
- 14
- 15
- 16
- 17
- 18
- 19
- 20
- 21
- 22
- 23
- 24
- 25
三、集成Prometheus配置
vim prometheus.yml- 1
scrape_configs: - job_name: "k8s-cadvisor" honor_timestamps: true metrics_path: /metrics scheme: https kubernetes_sd_configs: - api_server: https://10.142.155.202:6443 role: node bearer_token_file: /prometheus/data/k8s_token tls_config: insecure_skip_verify: true bearer_token_file: /prometheus/data/k8s_token tls_config: insecure_skip_verify: true relabel_configs: - action: labelmap regex: __meta_kubernetes_node_label_(.+) - separator: ; regex: (.*) target_label: __address__ replacement: 10.142.155.202:6443 action: replace - source_labels: [__meta_kubernetes_node_name] separator: ; regex: (.+) target_label: __metrics_path__ replacement: /api/v1/nodes/${1}:10250/proxy/metrics/cadvisor action: replace - job_name: "kube-node-kubelet" scheme: https tls_config: insecure_skip_verify: true bearer_token_file: /prometheus/data/k8s_token kubernetes_sd_configs: - role: node api_server: "https://10.142.155.202:6443" // 修改为对应的k8s master的节点 tls_config: insecure_skip_verify: true bearer_token_file: /prometheus/data/k8s_token relabel_configs: - target_label: __address__ replacement: 10.142.155.202:6443 - source_labels: [__meta_kubernetes_node_name] regex: (.+) target_label: __metrics_path__ replacement: /api/v1/nodes/${1}:10250/proxy/metrics - action: labelmap regex: __meta_kubernetes_service_label_(.+) - source_labels: [__meta_kubernetes_namespace] action: replace target_label: kubernetes_namespace - source_labels: [__meta_kubernetes_service_name] action: replace target_label: service_name- 1
- 2
- 3
- 4
- 5
- 6
- 7
- 8
- 9
- 10
- 11
- 12
- 13
- 14
- 15
- 16
- 17
- 18
- 19
- 20
- 21
- 22
- 23
- 24
- 25
- 26
- 27
- 28
- 29
- 30
- 31
- 32
- 33
- 34
- 35
- 36
- 37
- 38
- 39
- 40
- 41
- 42
- 43
- 44
- 45
- 46
- 47
- 48
- 49
- 50
- 51
- 52
- 53
- 54
注意:bearer_token_file: /prometheus/data/k8s_token
这里的token为上面生成的token信息,请根据目录进行配置即可
然后重启prometheus
如果是容器部署的prometheus,需要考虑映射token,可docker cp到/prometheus/data/ 即可
即可docker restart prometheus- 1
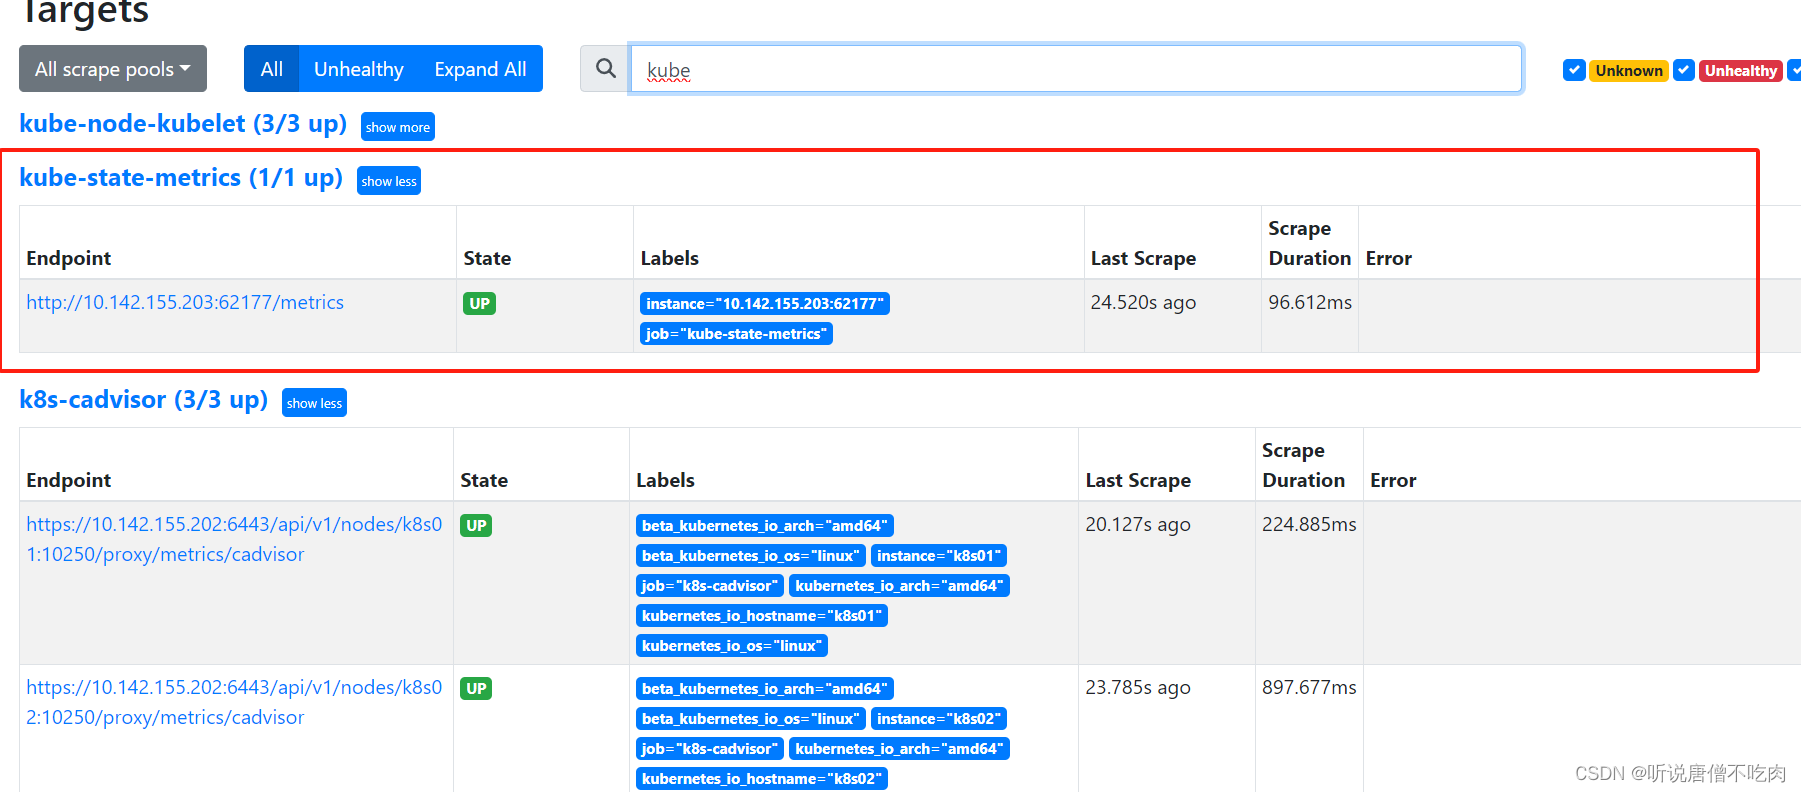
3、进入prometheus界面,查看相关指标
默认情况下 prometheus url: http://IP:9090
4、集成grafana
导入grafana JSON ID, 747
4.1、导入node信息指标
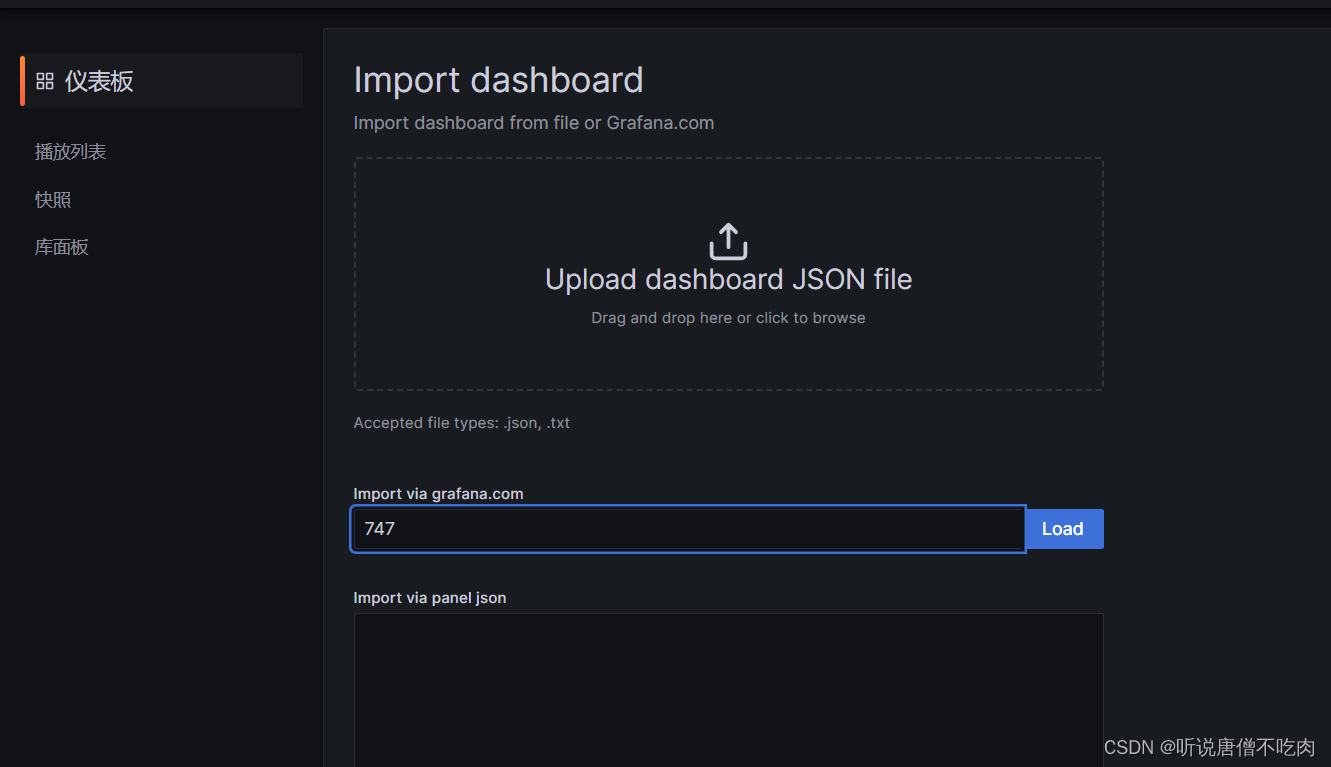
load 即可
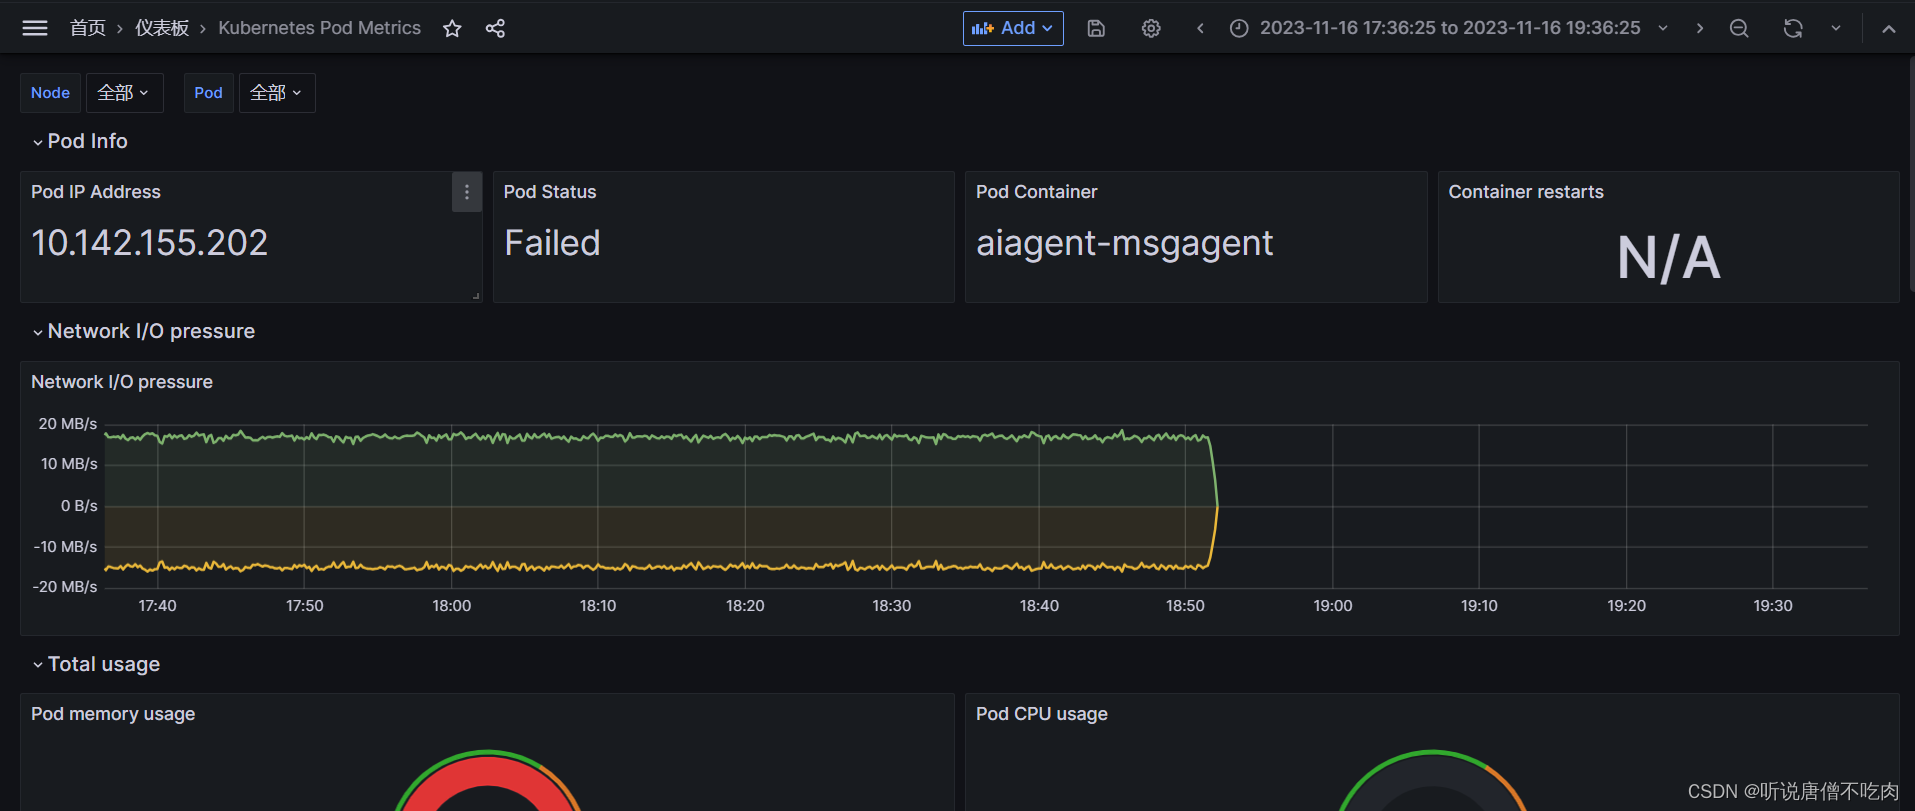
4.2、导入pod信息指标
JSON ID:15760
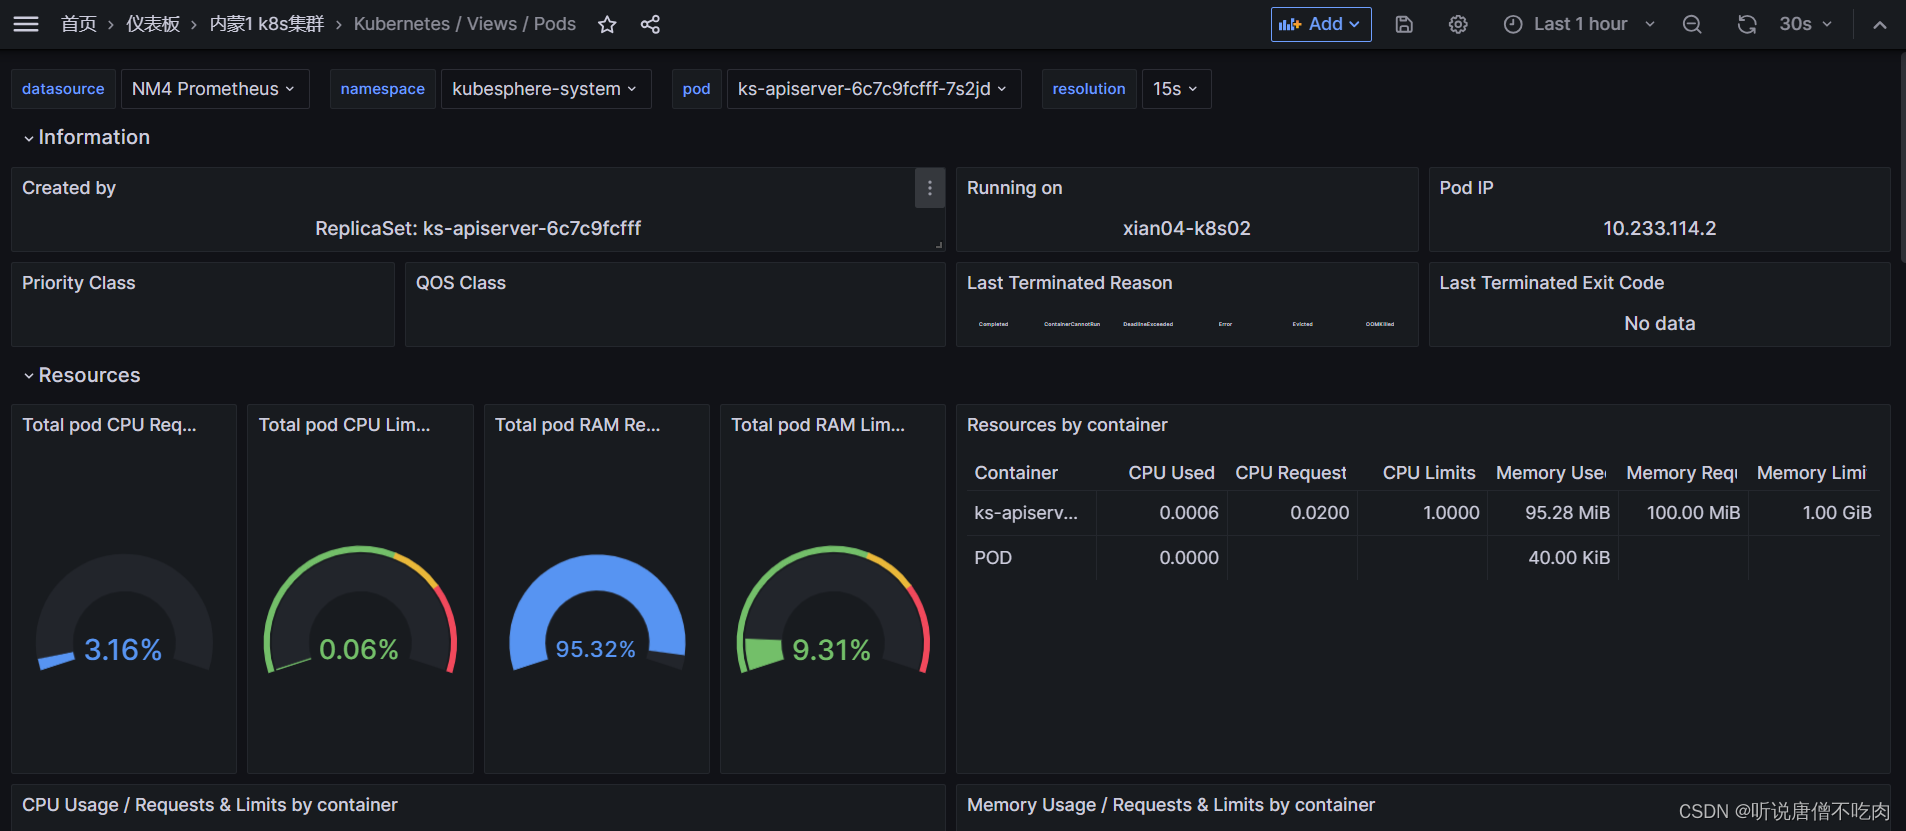
大盘信息即可完全展示~ -
相关阅读:
scrollIntoView多重校验rules滚动到指定位置
【老生谈算法】matlab实现IIR滤波器算法源码——IIR滤波器算法
前端基础之《ECMAScript 6(8)—Promise》
MySQL的游标遍历
ideal 同一项目启动多实列
RGD环肽:环六肽c(GRGDSP),CAS号: 135432-37-0
什么是微格式
ubuntu 扩展内存挂载
数据挖掘技术-绘制直方图
Flowable(一个开源的工作流和业务流程管理引擎)中与事件相关的一些核心概念
- 原文地址:https://blog.csdn.net/xu710263124/article/details/134448120
