-
[学习笔记]python绘制图中图(绘制站点分布图)
背景
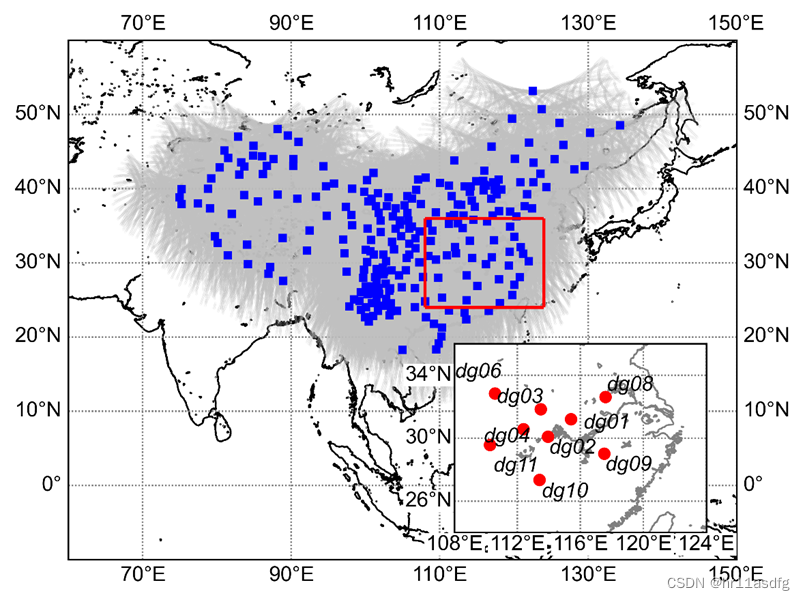
在绘制站点分布图时,有时需要采用图中图的方式,以便于在一张图中尽可能多的表达信息。此处记录一下利用python matplotlib绘制图中图的脚本,方便然后查询。
包含数据
该绘图脚本中包含以下数据:
- CMONOC站点分布(蓝色点)
- CMONOC穿刺点分布(灰色点)
- 某研究中采用的位于湖北省附近的一些地面跟踪站分布(红色点)
绘制思路
首先将CMONOC站点以及穿刺点分布画上,再通过plt.axes在图上再加一块画布绘制小范围的地图,接着在小范围的地图上标点。为了方便在大范围地图上找到图中图的位置,也要在相应位置上用红框标记下,这里采用了plt.vlines和plt.hlines两者结合的方法。
代码
注:此处仅提供绘图脚本,其中用到的部分站点坐标文件因一些原因不能公开。
from mpl_toolkits.basemap import Basemap import matplotlib.pyplot as plt import matplotlib.patches as mpathes import numpy as np import os from adjustText import adjust_text # 导入文字调整的库函数 outputDir = './cmonoc_ipp/' if not os.path.exists(outputDir): # True/False os.mkdir(outputDir) colors_lst = ['blue', 'magenta', 'darkolivegreen', 'mediumpurple', 'palevioletred', 'cadetblue'] site_list = r'xxxxxxxxxxxx/ofilelst.txt' # 测站名列表路径 ccl_file_dir = r'xxxxxxxxxxxxxxxxxxxxx/cclFileCmonoc/' # 穿刺点文件路径 # 读取测站列表文件(含经纬度及站点名称) f = open(site_list, 'r') ObsLines = f.readlines() rec_name = [] for i in range(len(ObsLines)): fields = ObsLines[i].split() rec_name.append(fields[0]) plt.figure(figsize=(6, 4.5)) # 设置大小和分辨率 plt.rcParams['font.sans-serif'] = ['arial'] lat_range = range(-15, 60 + 10, 10) lon_range = range(60, 150 + 10, 10) m = Basemap(projection='cyl', lon_0=110, lat_0=20, resolution='h', llcrnrlon=60, urcrnrlon=150, llcrnrlat=-10, urcrnrlat=60) m.drawcoastlines(color='black', linewidth=0.8) # draw parallels and meridians. m.drawmeridians(range(70, 150 + 20, 20), labels=[0, 0, 1, 1], color='gray', linewidth=0.8, font='arial', fontsize=10) m.drawparallels(range(0, 60, 10), labels=[1, 1, 0, 0], color='gray', linewidth=0.8, font='arial', fontsize=10) for i in range(len(rec_name)): site = rec_name[i][2:6] print('Porcessing site: ', site, '...') file_name = site + '_2023_091.ccl' arc_file = ccl_file_dir + file_name print('Processing the file: ', file_name) sec = [] ipp = [] elev = [] site_lst = [] with open(arc_file, "r") as f: for line in f.readlines(): line = line.split() # if line[4] != 'W05': # continue sec.append(int(line[2])) ipp.append([float(line[20]), float(line[21])]) elev.append(float(line[5])) site_lst.append(site) lon = [] lat = [] for k in range(len(sec)): lon_tmp, lat_tmp = m(ipp[k][1], ipp[k][0]) lon.append(lon_tmp) lat.append(lat_tmp) plt.scatter(lon, lat, s=0.0001, c='silver', zorder=100) # plt.plot(lon, lat, marker='o', color='grey', markersize=0.1, zorder=100) # CMONOC坐标列表路径 listFile = r'xxxxxxxxxxxxxx/site_pos_cmonoc.txt' # 读取测站列表文件(含经纬度及站点名称) f = open(listFile, 'r') ObsLines = f.readlines() lon = [] lat = [] staname = [] for i in range(len(ObsLines)): fields = ObsLines[i].split() # print(fields[0], fields[1], fields[2]) lon.append(float(fields[0])) lat.append(float(fields[1])) staname.append(fields[2]) lon, lat = m(lon, lat) # ----------在地图上绘制坐标点------------# for i in range(len(staname)): # m.scatter(lon[i], # lat[i], # s=20, # c='red', # marker='o') plt.plot(lon[i], lat[i], marker='s', color='blue', markersize=3, zorder=100) # CMONOC站点 # 标记图中图位置,红色线 plt.vlines(108, ymin=24, ymax=36, colors='r', zorder=100) plt.vlines(124, ymin=24, ymax=36, colors='r', zorder=100) plt.hlines(24, xmin=108, xmax=124, colors='r', zorder=100) plt.hlines(36, xmin=108, xmax=124, colors='r', zorder=100) # 绘制图中图 plt.axes([0.54, 0.15, 0.34, 0.28]) plt.rcParams['axes.facecolor'] = 'white' m = Basemap(projection='cyl', lon_0=110, lat_0=20, resolution='h', llcrnrlon=108, urcrnrlon=124, llcrnrlat=24, urcrnrlat=36) m.drawcoastlines(color='grey', linewidth=0.8) # 图中图经纬度标注受大图影响,标注时打开bbox使其有白色背景,增强可读性 m.drawmeridians(np.arange(100, 124+4, 4), labels=[0, 0, 0, 1], color='gray', linewidth=0.8, font='arial', fontsize=10, bbox=dict(facecolor="white", edgecolor="white", pad=0.4)) m.drawparallels(np.arange(26, 36+4, 4), labels=[1, 0, 0, 0], color='gray', linewidth=0.8, font='arial', fontsize=10, bbox=dict(facecolor="white", edgecolor="white", pad=0.4)) # 读取测站列表文件(含经纬度及站点名称) listFile = r'xxxxxxxxxxxxxxxxx/site_pos_leo.txt' f = open(listFile, 'r') ObsLines = f.readlines() lon = [] lat = [] staname = [] for i in range(len(ObsLines)): fields = ObsLines[i].split() # print(fields[0], fields[1], fields[2]) lon.append(float(fields[0])) lat.append(float(fields[1])) staname.append(fields[2]) lon, lat = m(lon, lat) # ----------在地图上绘制坐标点,添加文字------------# for i in range(len(staname)): # m.scatter(lon[i], # lat[i], # s=20, # c='red', # marker='o') plt.plot(lon[i], lat[i], marker='o', color='red', markersize=5, zorder=100) # 此处可以直接使用 m.scatter(lon,lat) # ---------在坐标点添加文字------# texts = [] for i in range(len(staname)): texts.append( plt.text(lon[i], # 坐标 lat[i], staname[i], # 文字字符串 font='arial', fontsize=10, style="italic", weight="normal", verticalalignment='center', horizontalalignment='right', rotation=0, zorder=100)) # 给散点加标签 adjust_text(texts, only_move={'text': 'xy'},) fig_name = outputDir + 'cmonoc091IPPTrack.tif' plt.savefig(fig_name, dpi=600, bbox_inches='tight', pad_inches=0.1) # 输出地图,并设置边框空白紧密 plt.show() # 将图像显示出来- 1
- 2
- 3
- 4
- 5
- 6
- 7
- 8
- 9
- 10
- 11
- 12
- 13
- 14
- 15
- 16
- 17
- 18
- 19
- 20
- 21
- 22
- 23
- 24
- 25
- 26
- 27
- 28
- 29
- 30
- 31
- 32
- 33
- 34
- 35
- 36
- 37
- 38
- 39
- 40
- 41
- 42
- 43
- 44
- 45
- 46
- 47
- 48
- 49
- 50
- 51
- 52
- 53
- 54
- 55
- 56
- 57
- 58
- 59
- 60
- 61
- 62
- 63
- 64
- 65
- 66
- 67
- 68
- 69
- 70
- 71
- 72
- 73
- 74
- 75
- 76
- 77
- 78
- 79
- 80
- 81
- 82
- 83
- 84
- 85
- 86
- 87
- 88
- 89
- 90
- 91
- 92
- 93
- 94
- 95
- 96
- 97
- 98
- 99
- 100
- 101
- 102
- 103
- 104
- 105
- 106
- 107
- 108
- 109
- 110
- 111
- 112
- 113
- 114
- 115
- 116
- 117
- 118
- 119
- 120
- 121
- 122
- 123
- 124
- 125
- 126
- 127
- 128
- 129
- 130
- 131
- 132
- 133
- 134
- 135
- 136
- 137
- 138
- 139
- 140
- 141
- 142
- 143
- 144
- 145
- 146
- 147
- 148
- 149
- 150
- 151
- 152
- 153
- 154
- 155
- 156
- 157
- 158
- 159
- 160
- 161
- 162
最后成图

-
相关阅读:
大型电商网站详情页是如何支撑亿级流量访问的?
经典进程调度算法
面试软件测试工程师时可能会遇到的几个常见问题
【设计模式】JAVA Design Patterns——Iterator(迭代器模式)
Java面经整理
ImageJ的单细胞荧光强度分析
史上第三大收购案,博通以 610 亿美元收购 VMware
grpc学习分享
模板的进阶
解Bug之路-应用999线升高
- 原文地址:https://blog.csdn.net/weixin_42638388/article/details/134176326
