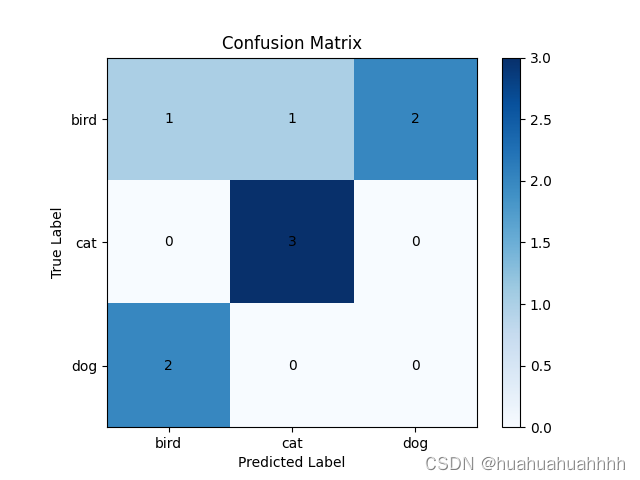
import numpy as np
import matplotlib.pyplot as plt
from sklearn.metrics import confusion_matrix
true_labels = ['cat', 'dog', 'bird', 'cat', 'dog', 'bird', 'cat', 'bird', 'bird']
predicted_labels = ['cat', 'bird', 'dog', 'cat', 'bird', 'dog', 'cat', 'cat', 'bird']
unique_labels = np.unique(true_labels)
cm = confusion_matrix(true_labels, predicted_labels)
print(cm)
plt.imshow(cm, interpolation='nearest', cmap=plt.cm.Blues)
rows, cols = cm.shape
for i in range(rows):
for j in range(cols):
plt.text(j, i, str(cm[i, j]), ha='center', va='center', color='black')
plt.title('Confusion Matrix')
plt.colorbar()
tick_marks = np.arange(len(unique_labels))
plt.xticks(tick_marks, unique_labels)
plt.yticks(tick_marks, unique_labels)
plt.xlabel('Predicted Label')
plt.ylabel('True Label')
plt.show()
- 1
- 2
- 3
- 4
- 5
- 6
- 7
- 8
- 9
- 10
- 11
- 12
- 13
- 14
- 15
- 16
- 17
- 18
- 19
- 20
- 21
- 22
- 23
- 24
- 25
- 26
- 27
- 28
- 29


