-
【附代码】使用Shapely计算多边形外扩与收缩
作者:小猪快跑基础数学&计算数学,从事优化领域5年+,主要研究方向:MIP求解器、整数规划、随机规划、智能优化算法
本文档介绍如何使用 Shapely Python 包 计算多边形外扩与收缩。
如有错误,欢迎指正。如有更好的算法,也欢迎交流!!!——@小猪快跑
相关文献
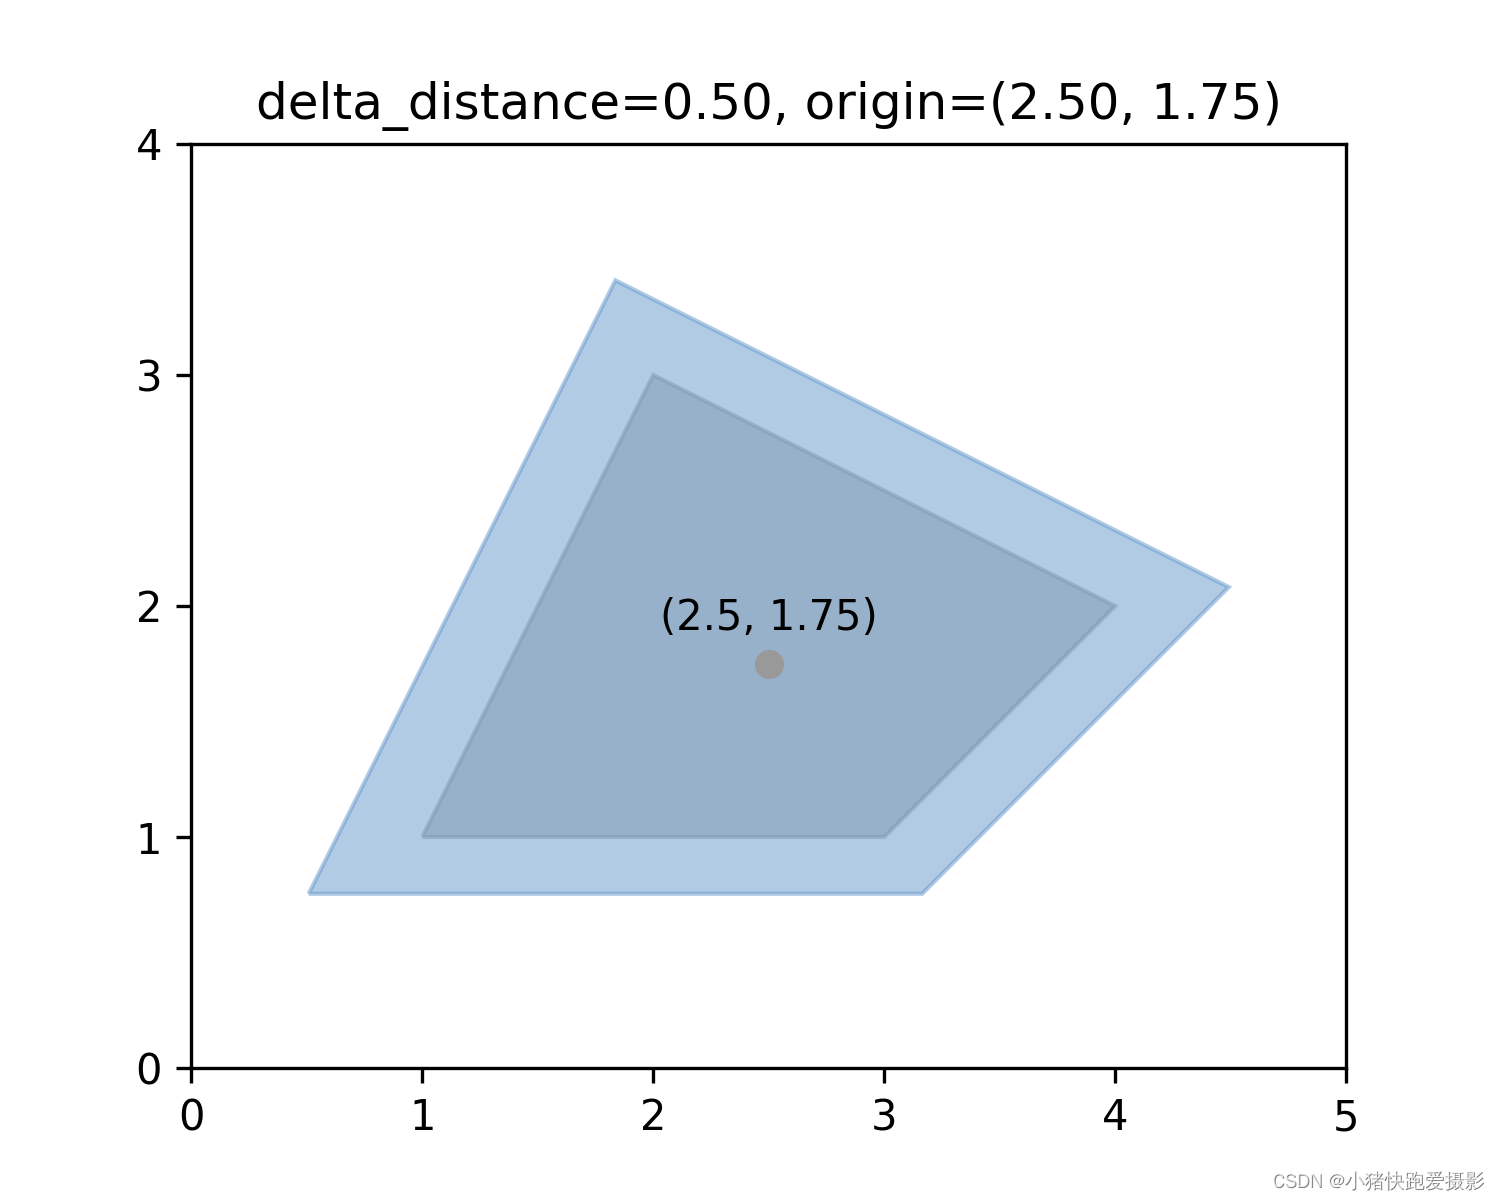
效果图

代码
# figures.py from math import sqrt from shapely import affinity GM = (sqrt(5)-1.0)/2.0 W = 8.0 H = W*GM SIZE = (W, H) BLUE = '#6699cc' GRAY = '#999999' DARKGRAY = '#333333' YELLOW = '#ffcc33' GREEN = '#339933' RED = '#ff3333' BLACK = '#000000' def add_origin(ax, geom, origin): x, y = xy = affinity.interpret_origin(geom, origin, 2) ax.plot(x, y, 'o', color=GRAY, zorder=1) ax.annotate(str(xy), xy=xy, ha='center', textcoords='offset points', xytext=(0, 8)) def set_limits(ax, x0, xN, y0, yN): ax.set_xlim(x0, xN) ax.set_xticks(range(x0, xN+1)) ax.set_ylim(y0, yN) ax.set_yticks(range(y0, yN+1)) ax.set_aspect("equal")- 1
- 2
- 3
- 4
- 5
- 6
- 7
- 8
- 9
- 10
- 11
- 12
- 13
- 14
- 15
- 16
- 17
- 18
- 19
- 20
- 21
- 22
- 23
- 24
- 25
- 26
- 27
- 28
- 29
- 30
- 31
# main.py import matplotlib.pyplot as plt import numpy as np from shapely.geometry import Point, LineString from shapely import affinity, MultiPoint from shapely.plotting import plot_polygon from figures import BLUE, GRAY, set_limits, add_origin def scale_line(point: Point, center_point: Point, delta_distance: float): distance = point.distance(center_point) distance_new = distance + delta_distance fact = distance_new / distance points = affinity.scale(LineString([(point.x, point.y), (center_point.x, center_point.y)]), xfact=fact, yfact=fact, origin=(center_point.x, center_point.y)).coords[:] p0 = Point(points[0]) p1 = Point(points[1]) if p0.distance(center_point) > p1.distance(center_point): return p0 return p1 if __name__ == '__main__': # 给定一些点先求凸包 polygon = MultiPoint([(1, 1), (3, 1), (4, 2), (2, 3), (2, 2)]).convex_hull x, y = polygon.exterior.xy # 找到凸包的重心 center_x = np.mean(x[1:]) center_y = np.mean(y[1:]) # 设置大致的外扩距离求出缩放系数fact(也可以直接设置比例fact) delta_distance = 0.5 p0 = Point(x[0], y[0]) p1 = Point(x[1], y[1]) p0_new = scale_line(p0, Point(center_x, center_y), delta_distance) p1_new = scale_line(p1, Point(center_x, center_y), delta_distance) fact = p0_new.distance(p1_new) / p0.distance(p1) # 画图 fig = plt.figure(1, figsize=(5, 4), dpi=300) ax = fig.add_subplot(111) plot_polygon(polygon, ax=ax, add_points=False, color=GRAY, alpha=0.5) polygon_new = affinity.scale(polygon, xfact=fact, yfact=fact, origin=(center_x, center_y)) plot_polygon(polygon_new, ax=ax, add_points=False, color=BLUE, alpha=0.5) add_origin(ax, polygon, (center_x, center_y)) ax.set_title(f"delta_distance={delta_distance:.2f}, origin=({center_x:.2f}, {center_y:.2f})") set_limits(ax, 0, 5, 0, 4) plt.show()- 1
- 2
- 3
- 4
- 5
- 6
- 7
- 8
- 9
- 10
- 11
- 12
- 13
- 14
- 15
- 16
- 17
- 18
- 19
- 20
- 21
- 22
- 23
- 24
- 25
- 26
- 27
- 28
- 29
- 30
- 31
- 32
- 33
- 34
- 35
- 36
- 37
- 38
- 39
- 40
- 41
- 42
- 43
- 44
- 45
- 46
- 47
- 48
-
相关阅读:
Spring Boot 中的Thymeleaf分页和排序示例
GD32E230使用J-LINK下载调试问题
PCL 半径滤波剔除噪点
redis cluster伪集群搭建及应用
postman接口传参案例
Android 10.0系统settings app详情页控制开启关闭流量数据的开关
滑动窗口算法
【金融项目】尚融宝项目(十六)
YOLOv7 改进原创 HFAMPAN 结构,信息高阶特征对齐融合和注入,全局融合多级特征,将全局信息注入更高级别
JAVA算法训练营打卡总结
- 原文地址:https://blog.csdn.net/ymzhu385/article/details/133757225
