-
GEE16: 区域日均降水量计算
1. 区域日均降水量计算
今天分析一个计算区域日均降水量的方法:
数据信息:
Climate Hazards Group InfraRed Precipitation with Station data (CHIRPS) is a 30+ year quasi-global rainfall dataset. CHIRPS incorporates 0.05° resolution satellite imagery with in-situ station data to create gridded rainfall time series for trend analysis and seasonal drought monitoring.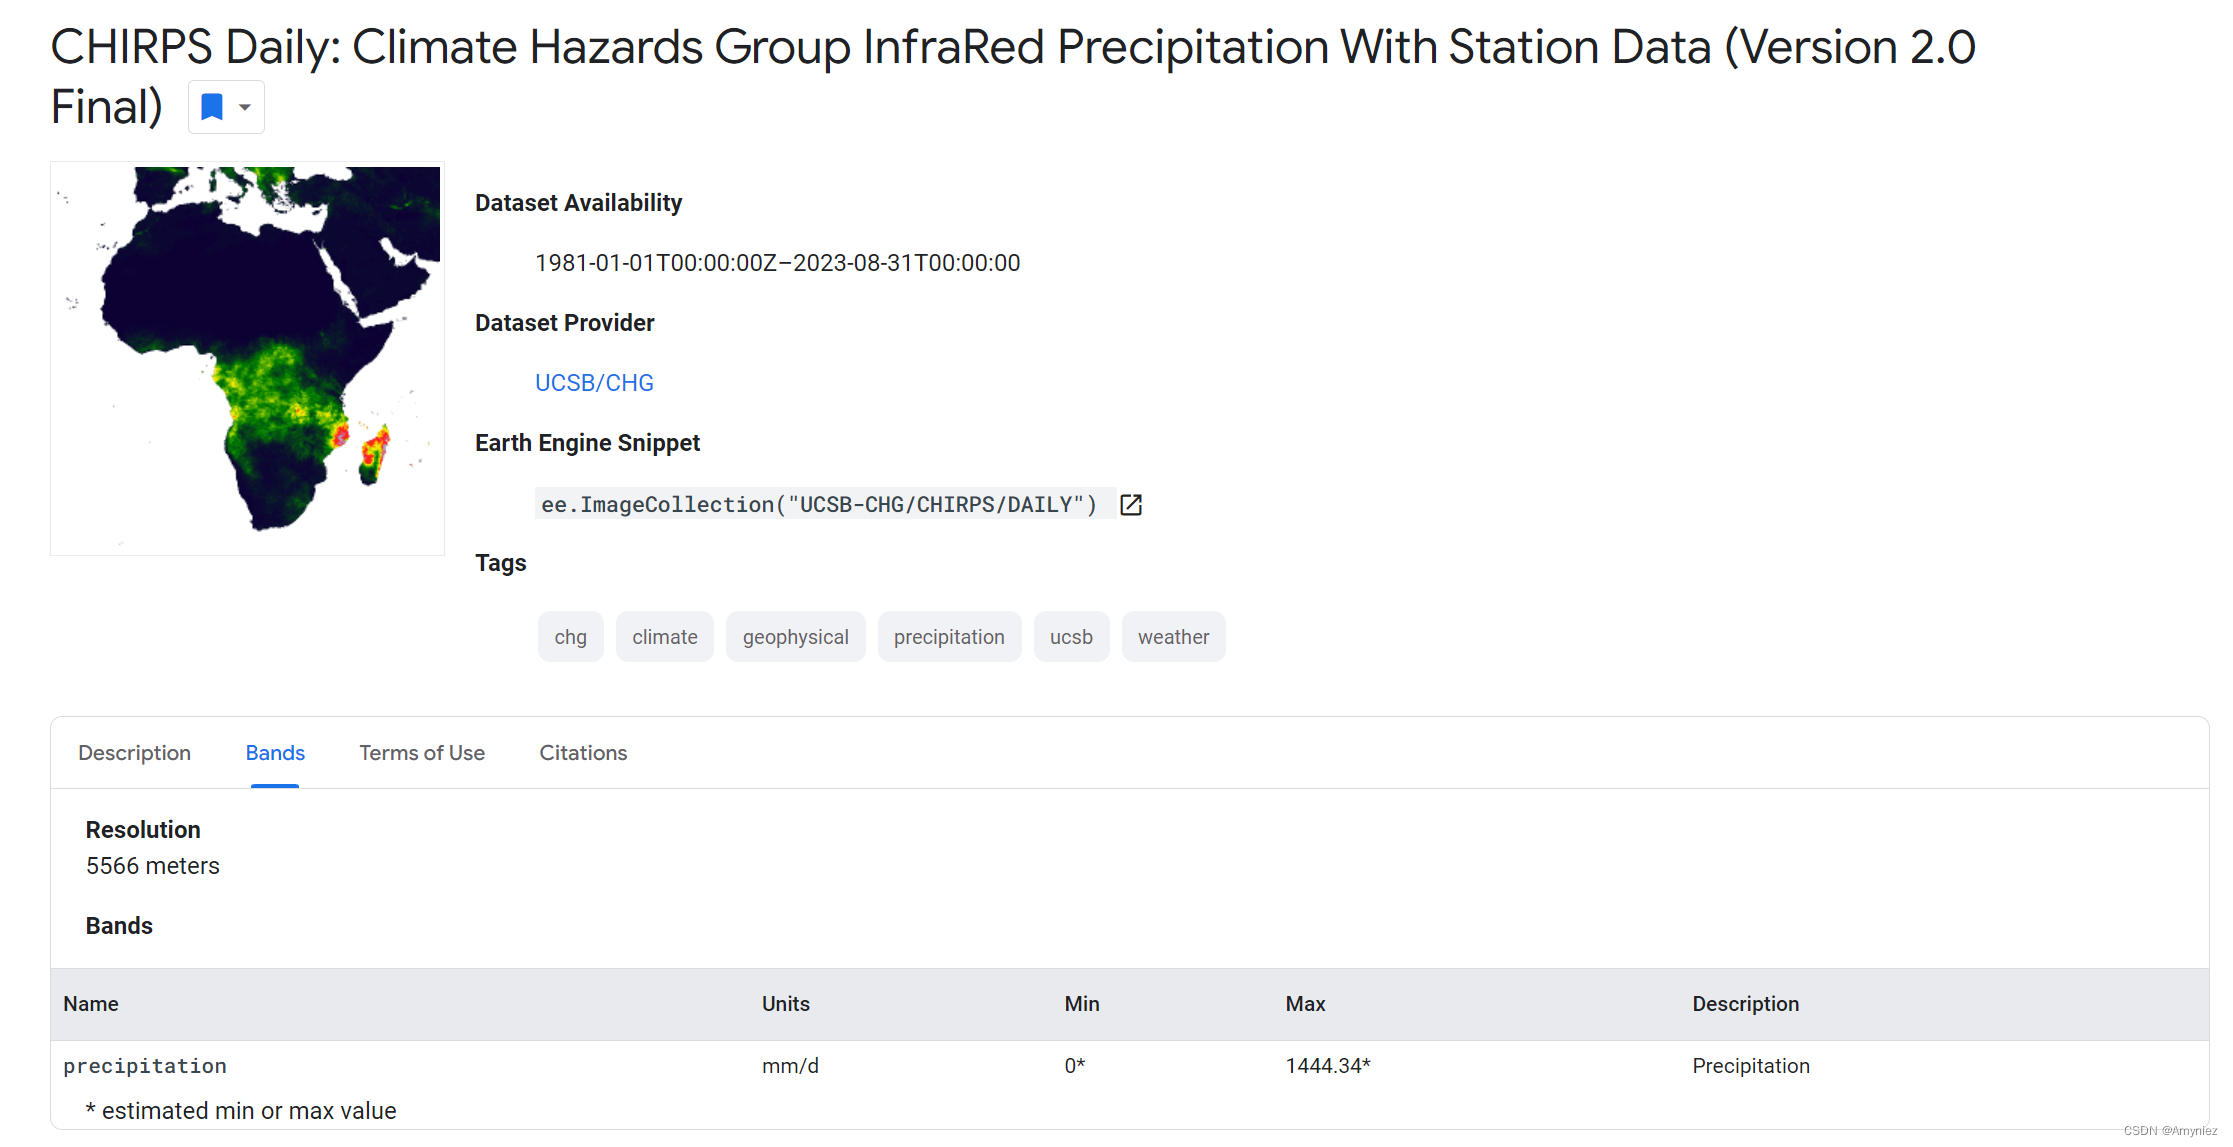
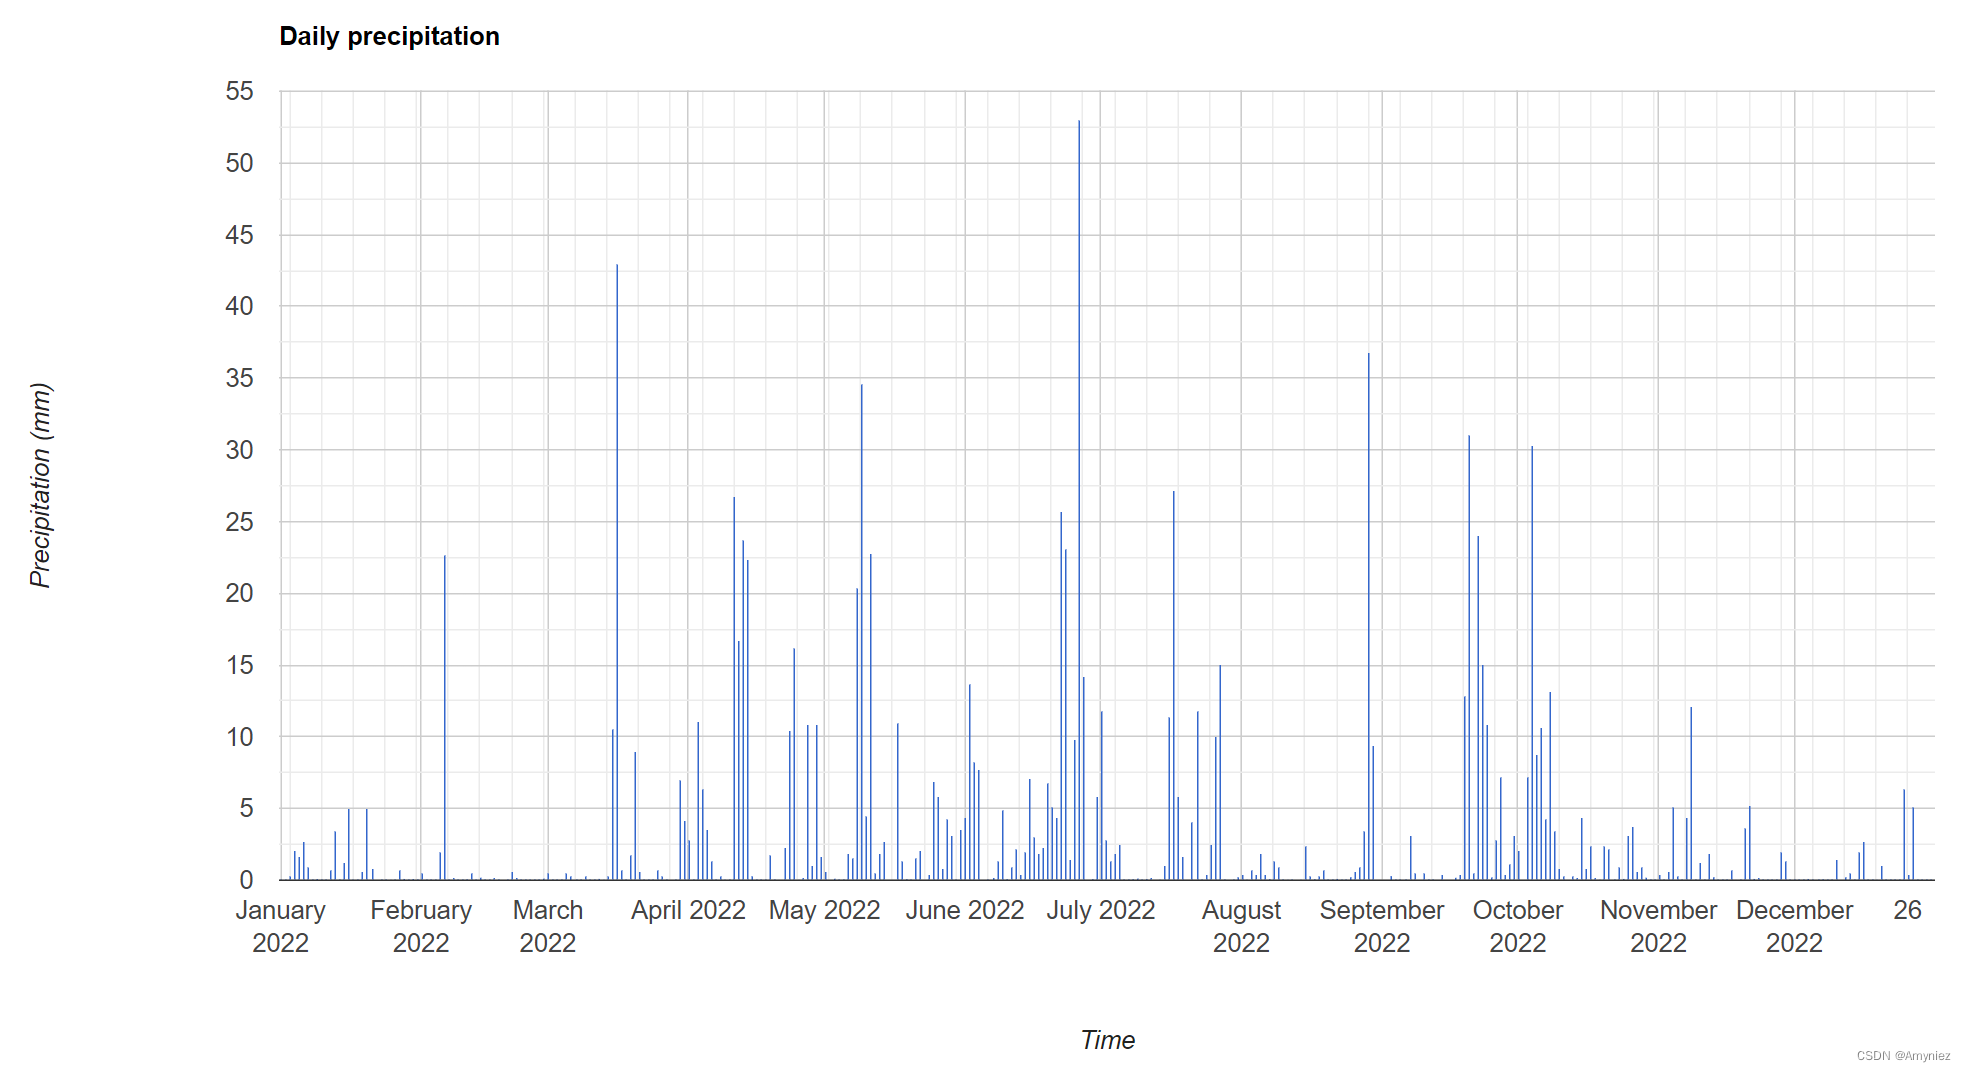
var startDate = ee.Date('2022-01-01'); var endDate = ee.Date('2023-01-01'); // 以重庆为目标 var geometry = ee.FeatureCollection('projects/ee-*****736/assets/Chongqing_Province') Map.centerObject(geometry,5) var styling = {color:"red",fillColor:"00000000"} Map.addLayer(geometry.style(styling),{},"geometry") var geometry = geometry.geometry() var dataset = ee.ImageCollection("UCSB-CHG/CHIRPS/DAILY") .filterDate(startDate, endDate); var list_dataset = dataset.toList(dataset.size()); print(list_dataset); // 计算区域内的日平均值 var getPrecipitation = function(image) { var value_precipit = ee.Image(image) .reduceRegion(ee.Reducer.mean(), geometry) .get('precipitation'); var precipit_mm = ee.Number(value_precipit); return precipit_mm; }; // 输出每日平均降水量(mm) var count = dataset.size(); var precipit_list = dataset.toList(count).map(getPrecipitation); print("precipitation list", precipit_list); // 输出所有日期 var allDates = ee.List(dataset.aggregate_array('system:time_start')); var allDatesSimple = allDates.map(function(date){ return ee.Date(date).format().slice(0,10); }); print('allDates',allDatesSimple); // 将日期与降水数据组合 var paired = allDatesSimple.zip(precipit_list); print (paired); var title = { title: 'Daily precipitation', hAxis: {title: 'Time'}, vAxis: {title: 'Precipitation (mm)'}, }; // 构建日平均降水量图表 var chartDaily = ui.Chart.image.seriesByRegion({ imageCollection: dataset, regions: geometry, reducer: ee.Reducer.mean(), band: 'precipitation', scale: 5566, xProperty: 'system:time_start', seriesProperty: 'SITE' }).setOptions(title) .setChartType('ColumnChart'); print(chartDaily); // 将日平均降水量输出CSV文件 var myFeatures = ee.FeatureCollection(paired.map(function(el){ el = ee.List(el); // cast every element of the list var geom = geometry; return ee.Feature(null, { 'date': ee.String(el.get(0)), 'value':ee.Number(el.get(1)) }); })); // Export features, specifying corresponding names. Export.table.toDrive(myFeatures, "precipitation", //my task "GEE_Folder", //my export folder "daily_precipit", //file name "CSV");- 1
- 2
- 3
- 4
- 5
- 6
- 7
- 8
- 9
- 10
- 11
- 12
- 13
- 14
- 15
- 16
- 17
- 18
- 19
- 20
- 21
- 22
- 23
- 24
- 25
- 26
- 27
- 28
- 29
- 30
- 31
- 32
- 33
- 34
- 35
- 36
- 37
- 38
- 39
- 40
- 41
- 42
- 43
- 44
- 45
- 46
- 47
- 48
- 49
- 50
- 51
- 52
- 53
- 54
- 55
- 56
- 57
- 58
- 59
- 60
- 61
- 62
- 63
- 64
- 65
- 66
- 67
- 68
- 69
- 70
- 71
- 72
- 73
- 74
- 75
- 76
- 77
结果展示:
2. 降水时间序列
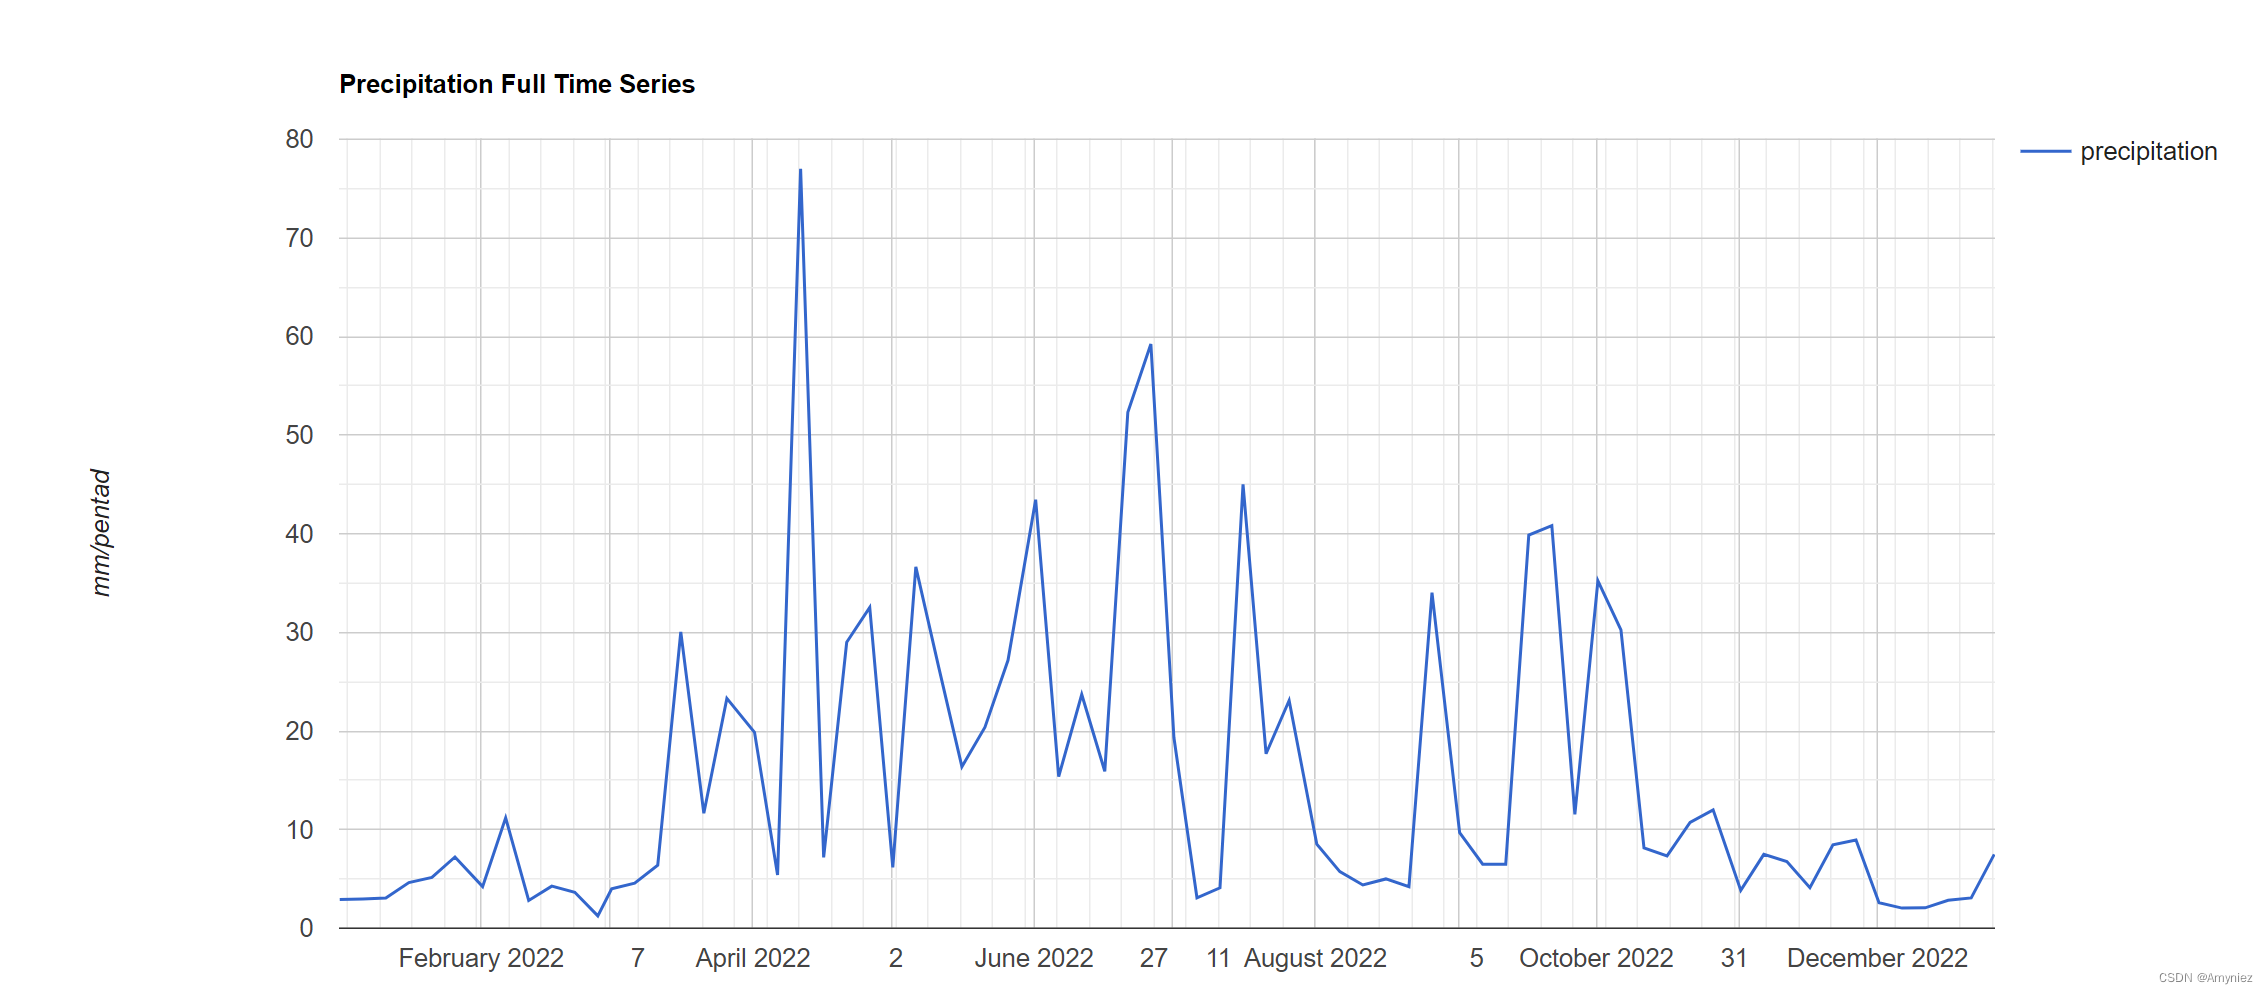
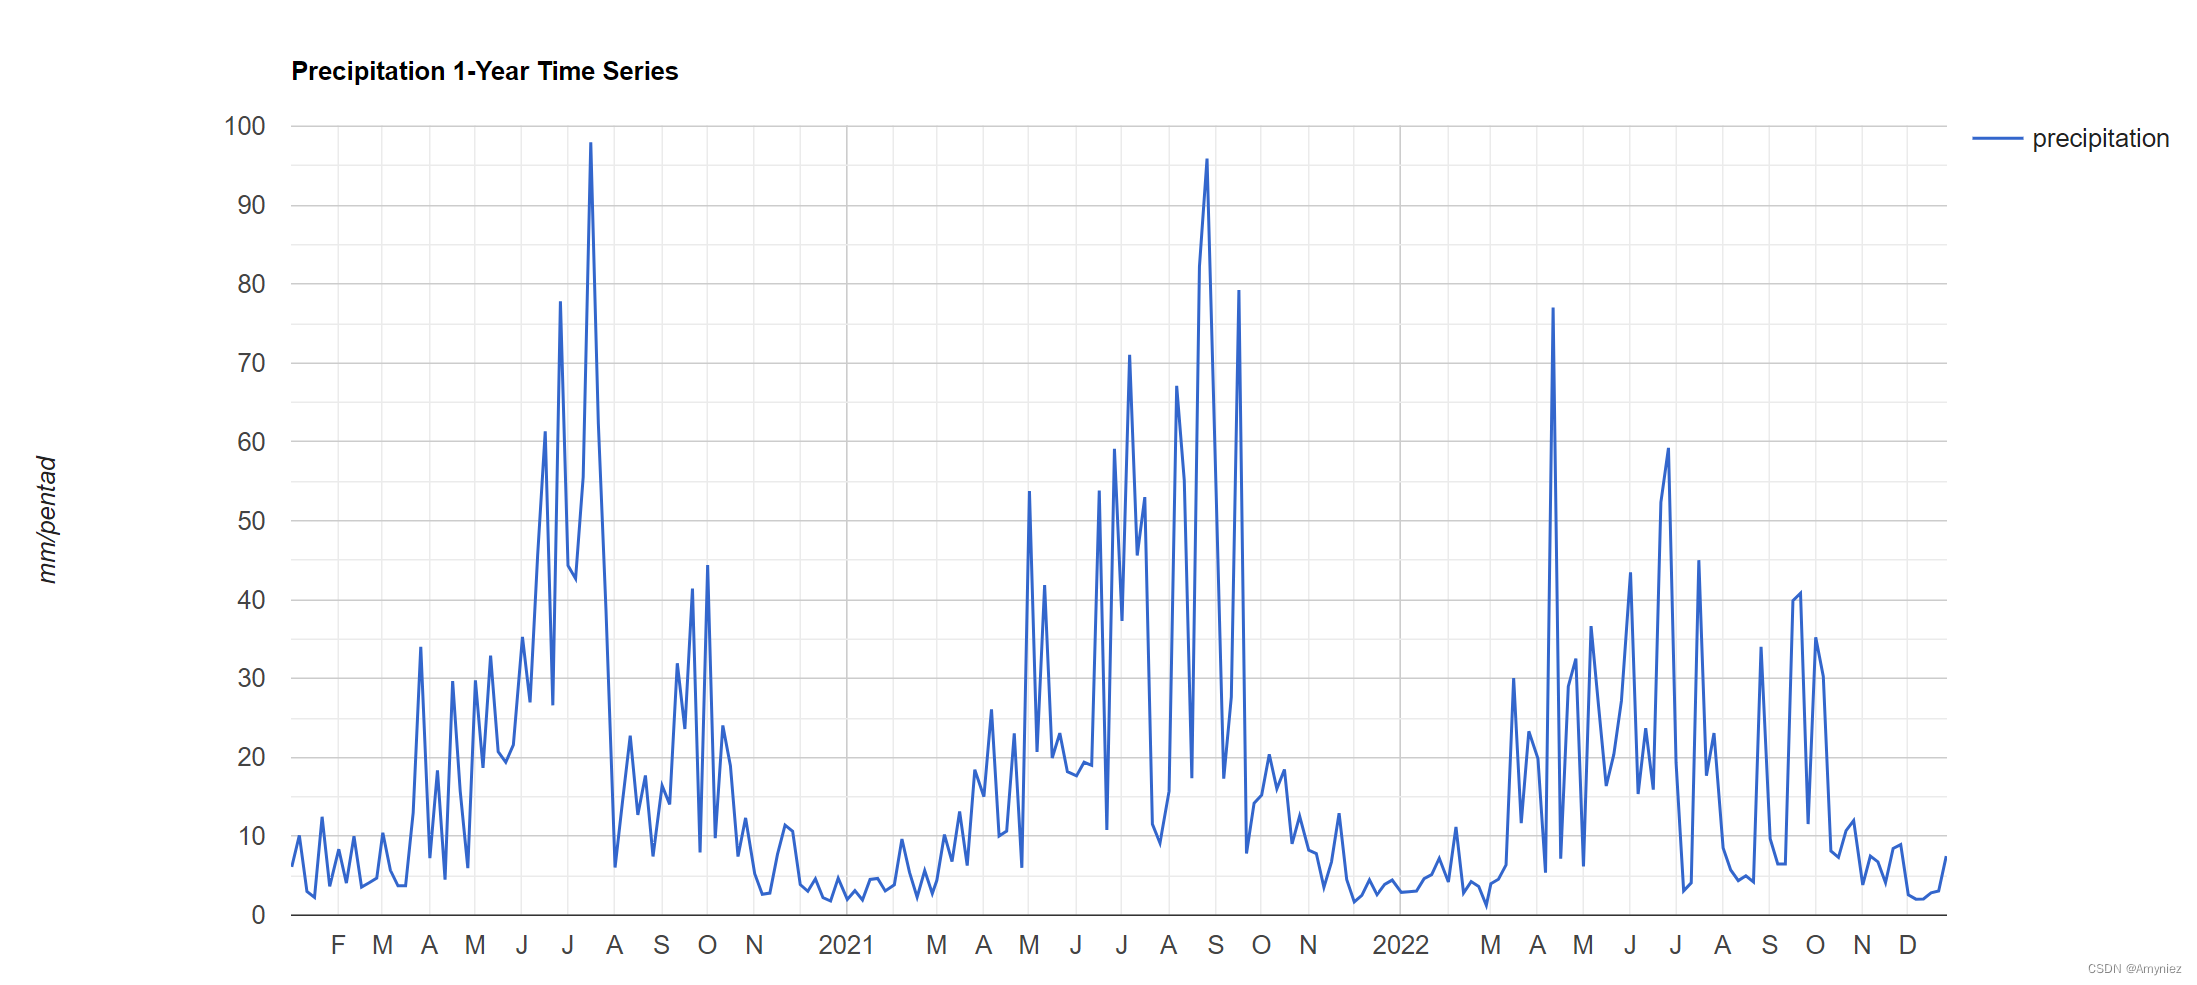
var geometry = ee.FeatureCollection('projects/ee-*****736/assets/Chongqing_Province') Map.centerObject(geometry ,6) var CHIRPS= ee.ImageCollection('UCSB-CHG/CHIRPS/PENTAD'); var precip = CHIRPS.filterDate('2022-01-01', '2022-12-31'); var precip1year=CHIRPS.filterDate('2020-01-01', '2022-12-31'); var TS1 = Chart.image.series(precip, geometry, ee.Reducer.mean(),5566, 'system:time_start').setOptions({ title: 'Precipitation Full Time Series', vAxis: {title: 'mm/pentad'}, }); print(TS1); var TS2 = Chart.image.series(precip1year, geometry, ee.Reducer.mean(),5566, 'system:time_start').setOptions({ title: 'Precipitation 1-Year Time Series', vAxis: {title: 'mm/pentad'}, }); print(TS2);- 1
- 2
- 3
- 4
- 5
- 6
- 7
- 8
- 9
- 10
- 11
- 12
- 13
- 14
- 15
- 16
- 17
- 18
- 19
结果展示:
3. 降水数据年度时间序列对比分析
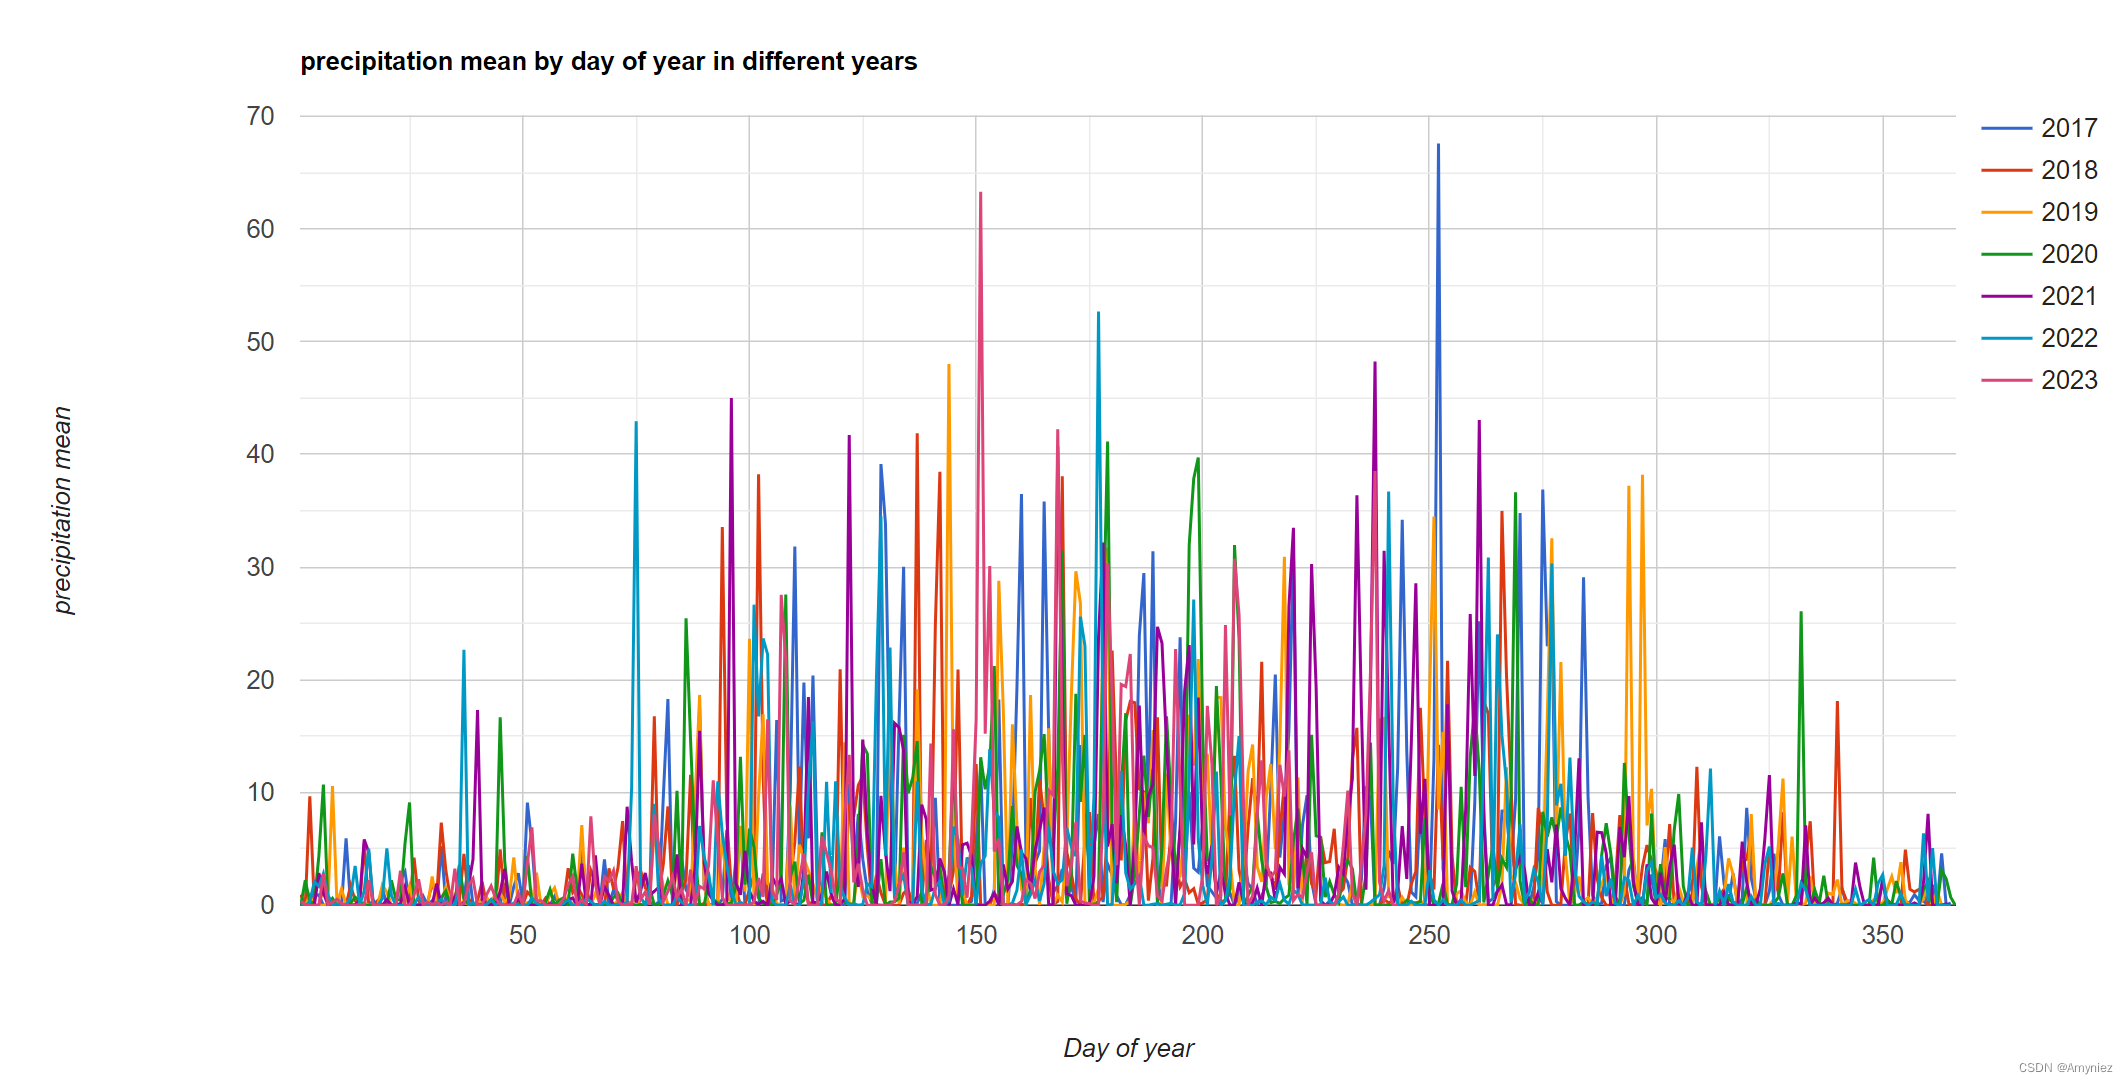
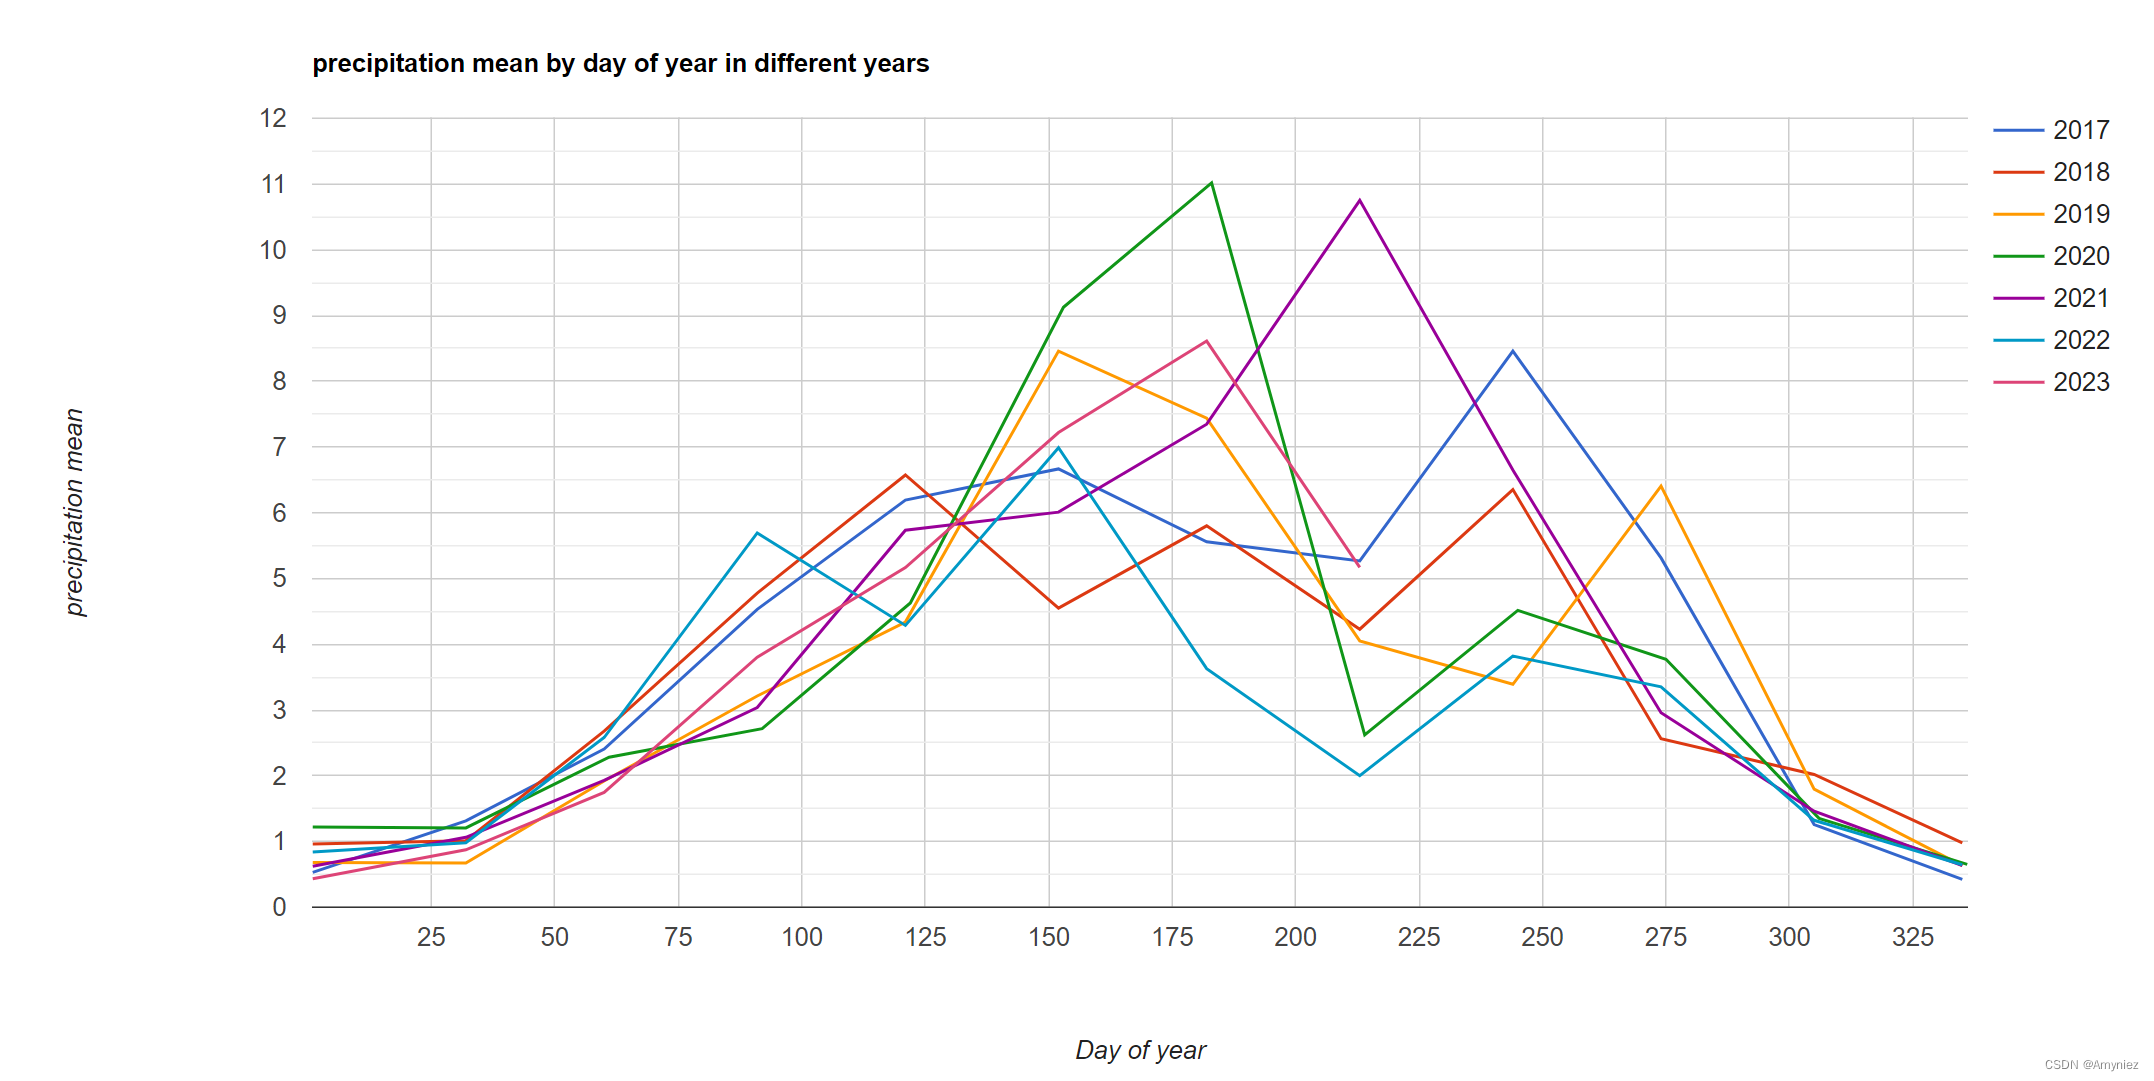
// 研究区域边界可视化 var geometry = ee.FeatureCollection('projects/ee-*****736/assets/Chongqing_Province') Map.centerObject(geometry); var styling = {color:'red',fillColor:'00000000'} Map.addLayer(geometry.style(styling),{},'roi') var dataset = ee.ImageCollection('UCSB-CHG/CHIRPS/DAILY') .filter(ee.Filter.date('2017-01-01', '2023-10-01')) .select('precipitation') .filterBounds(geometry) .map(function(image){ return image.clip(geometry) }); var Chart1 = ui.Chart.image.doySeriesByYear({ imageCollection:dataset, bandName:'precipitation', region:geometry, regionReducer:ee.Reducer.mean(), scale:5566, }) print('每年的降水量走势',Chart1) // 计算每月的平均值 // 自行修改起始年份即可 var years = ee.List.sequence(2017, 2023); var months = ee.List.sequence(1, 12); var Monthlymean = ee.ImageCollection(years .map(function(y) { return months.map(function(m) { var perc = dataset .filter(ee.Filter.calendarRange(y,y, 'year')) .filter(ee.Filter.calendarRange(m, m, 'month')) .mean() .clip(geometry) return perc.set('system:time_start',ee.Date.fromYMD(y,m,1)) .set('system:index',ee.String(ee.Number(y).int()).cat("_").cat(ee.String(ee.Number(m).int()))) }) }).flatten()); print('月平均数据集',Monthlymean) var Chart2 = ui.Chart.image.doySeriesByYear({ imageCollection:Monthlymean, bandName:'precipitation', region:geometry, regionReducer:ee.Reducer.mean(), scale:5566, }) print('每年的月度降水量走势',Chart2)- 1
- 2
- 3
- 4
- 5
- 6
- 7
- 8
- 9
- 10
- 11
- 12
- 13
- 14
- 15
- 16
- 17
- 18
- 19
- 20
- 21
- 22
- 23
- 24
- 25
- 26
- 27
- 28
- 29
- 30
- 31
- 32
- 33
- 34
- 35
- 36
- 37
- 38
- 39
- 40
- 41
- 42
- 43
- 44
- 45
- 46
- 47
- 48
- 49
- 50
- 51
- 52
结果展示:
每年的降水量走势:
每年的月度降水量走势:
4. 降水等值线绘制
var geometry = ee.FeatureCollection('projects/ee-yipeizhao736/assets/Chongqing_Province') Map.centerObject(geometry,6.5) var styling = {color:"red",fillColor:"00000000"} Map.addLayer(geometry.style(styling),{},"geometry") var geometry = geometry.geometry() // Load the CHIRPS data var CHIRPS= ee.ImageCollection('UCSB-CHG/CHIRPS/PENTAD'); // 选择两个研究时间段 var precip = CHIRPS.filterDate('2022-01-01', '2022-12-31'); var precip1year=CHIRPS.filterDate('2020-01-01', '2022-12-31'); // 绘制两个时间序列图 var TS1 = Chart.image.series(precip, geometry, ee.Reducer.mean(),5566, 'system:time_start').setOptions({ title: '2022 Precipitation Time Series', vAxis: {title: 'mm/pentad'}, }); print(TS1); var TS2 = Chart.image.series(precip1year, geometry, ee.Reducer.mean(),5566, 'system:time_start').setOptions({ title: '2020-2022 Precipitation Time Series', vAxis: {title: 'mm/pentad'}, }); print(TS2); // Short and Long Term Rainfall in MM var GujaratPrecip1 = precip.sum().clip(geometry); var GujaratPrecip = precip1year.sum().clip(geometry).multiply(0.33); Map.addLayer(GujaratPrecip1, {'min': 100, 'max': 3000, 'palette':"f6ffa9,1fe2b5,1da0fd,2b7bf3,141899"},'Short-term Rainfall'); Map.addLayer(GujaratPrecip, {'min': 100, 'max': 3000, 'palette':"f6ffa9,1fe2b5,1da0fd,2b7bf3,141899"},'Long-term Rainfall'); print(GujaratPrecip) // 绘制等值线 var lines = ee.List.sequence(0, 3000, 50); var contourlines = lines.map(function(line) { var mycontour = GujaratPrecip1.convolve(ee.Kernel.gaussian(5, 3)).subtract(ee.Image.constant(line)).zeroCrossing().multiply(ee.Image.constant(line)).toFloat(); return mycontour.mask(mycontour); }) contourlines = ee.ImageCollection(contourlines).mosaic(); Map.addLayer(contourlines, {min: 0, max: 3000, palette:['green', 'red']}, 'Annual Contour Map');- 1
- 2
- 3
- 4
- 5
- 6
- 7
- 8
- 9
- 10
- 11
- 12
- 13
- 14
- 15
- 16
- 17
- 18
- 19
- 20
- 21
- 22
- 23
- 24
- 25
- 26
- 27
- 28
- 29
- 30
- 31
- 32
- 33
- 34
- 35
- 36
- 37
- 38
- 39
- 40
- 41
- 42
- 43
结果展示:

-
相关阅读:
MTK Logo 逆向解析之 bin 转 rawx
STM32CubeMX安装、使用、配置
微信小程序:引导用户关注微信公众号-用户关注/取消关注事件,特别详细,已成功
Spring 缓存注解这样用,太香了!
【Linux网络编程】日志与守护进程
极客日报:达摩院实现全球最大AI预训练模型;苹果3nm芯片或将2023年问世;微软官宣加入JCP计划
MySQL数据库事务与索引SQL命令语句操作代码
LeetCode(力扣)452. 用最少数量的箭引爆气球Python
学生HTML静态网页基础水平制作DIV+CSS+JavaScript技术制作美食网页——美食城6页面
开发者,MySQL专栏完更,助你轻松从安装到入门进阶
- 原文地址:https://blog.csdn.net/amyniez/article/details/133590297