-
echarts使用custom类型绘制矩形
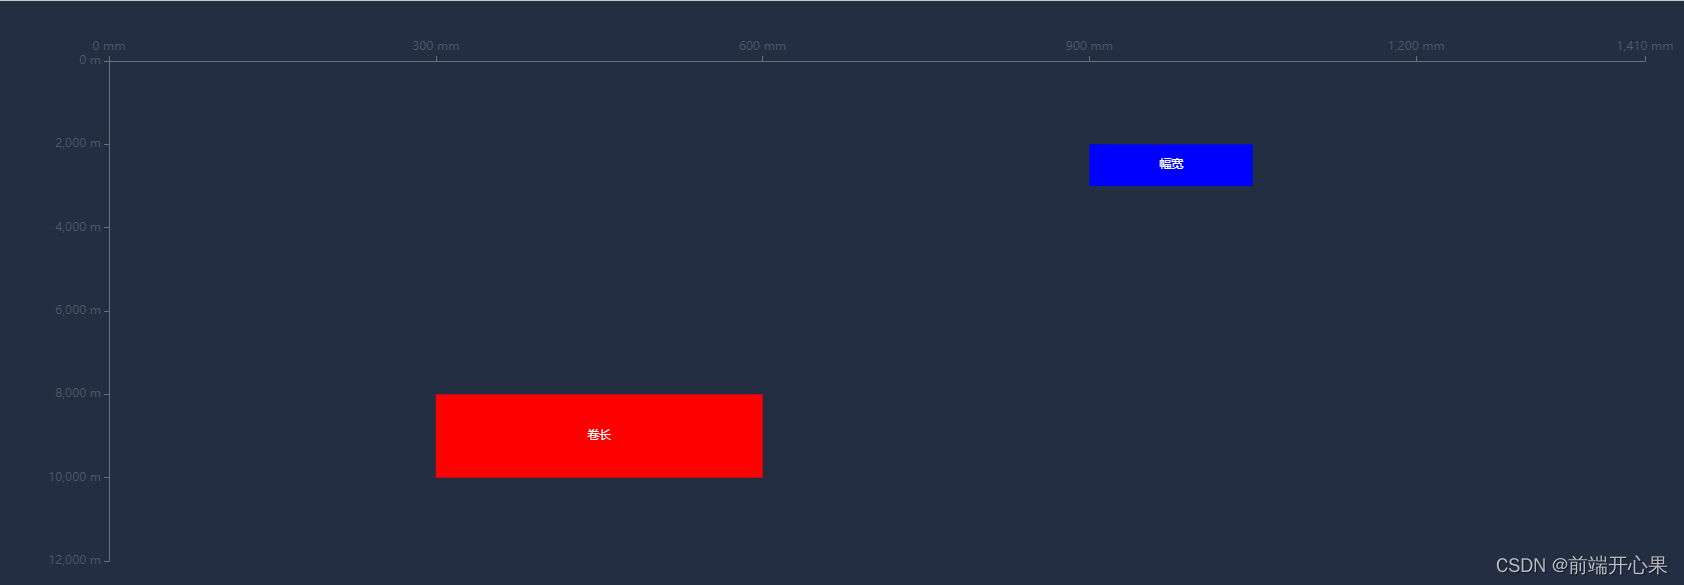
echarts中根据坐标点和点的宽高绘制不同大小的矩形
效果图

<template> <div style="height: 100%; width: 100%"> <BaseChart @emitChart="emitChart" :option="option1" /> </div> </template> <script> export default { data() { return { echarts: null, option1: {}, }; }, mounted() { this.setOption1(); }, methods: { setOption1() { const rectangles = [ { x: 300, y: 8000, width: 300, height: 2000, name: "卷长", itemStyle: { borderColor: "red", normal: { color: "red", }, }, }, { x: 900, y: 2000, width: 150, height: 1000, name: "幅宽", itemStyle: { borderColor: "green", normal: { color: "blue", }, }, }, // 可以添加更多的矩形... ]; let data = rectangles.map((i) => { // 数组里面的值分别代表维度0, 1, 2, 3 return { value: [i.x, i.y, i.width, i.height], name: i.name, itemStyle: i.itemStyle, }; // 数组里面的值分别代表维度0, 1, 2, 3,这种数据结构没有针对样式颜色 // return [i.x, i.y, i.width, i.height]; }); const option = { grid: { height: 500, // left: "2%", // right: "2%", // bottom: "2%", // containLabel: true, }, xAxis: [ { splitLine: { show: false, }, position: "top", min: 0, max: 1410, axisLabel: { show: true, formatter: "{value} mm", textStyle: { color: "#4E5969", }, }, }, ], yAxis: [ { splitLine: { show: false, }, inverse: true, min: 0, max: 12000, axisLabel: { show: true, formatter: "{value} m", textStyle: { color: "#4E5969", }, }, }, ], tooltip: { formatter: function (params) { return ( params.marker + params.name + ": " + params.value[0] + "~" + params.value[1] + "
" + params.marker + `name:${params.data.name}` ); }, }, series: [ { type: "custom", coordinateSystem: "cartesian2d", renderItem: (params, api) => { // api.coord()将数据组映射到坐标系上,api.value(n),获取第n维度的值 let start = api.coord([api.value(0), api.value(1)]); // api.size()给定数据范围,映射到坐标系上后的像素长度。比如api.size([1, 1])和坐标轴的刻度一样,长度都是1 // 如果矩形超出了当前坐标系的包围盒,则剪裁这个矩形。 let rectShape = this.$echarts.graphic.clipRectByRect( { x: start[0], y: start[1], width: api.size([1, 1])[0] * api.value(2), height: api.size([1, 1])[1] * api.value(3), }, { x: params.coordSys.x, y: params.coordSys.y, width: params.coordSys.width, height: params.coordSys.height, } ); return ( rectShape && { type: "rect", // 矩形,还可以circle等 shape: rectShape, style: api.style({ text: `${data[params.dataIndex].name}`, // 文字内容 }), } ); }, itemStyle: { normal: { opacity: 1, }, }, encode: { x: [0, 2], // data 中『维度0』和『维度2』对应到 X 轴 y: 1, // data 中『维度1』对应到 Y 轴 }, data, // data是一个二维数组 }, ], }; this.option1 = option; }, emitChart(echarts) { this.echarts = echarts; }, }, }; </script>- 1
- 2
- 3
- 4
- 5
- 6
- 7
- 8
- 9
- 10
- 11
- 12
- 13
- 14
- 15
- 16
- 17
- 18
- 19
- 20
- 21
- 22
- 23
- 24
- 25
- 26
- 27
- 28
- 29
- 30
- 31
- 32
- 33
- 34
- 35
- 36
- 37
- 38
- 39
- 40
- 41
- 42
- 43
- 44
- 45
- 46
- 47
- 48
- 49
- 50
- 51
- 52
- 53
- 54
- 55
- 56
- 57
- 58
- 59
- 60
- 61
- 62
- 63
- 64
- 65
- 66
- 67
- 68
- 69
- 70
- 71
- 72
- 73
- 74
- 75
- 76
- 77
- 78
- 79
- 80
- 81
- 82
- 83
- 84
- 85
- 86
- 87
- 88
- 89
- 90
- 91
- 92
- 93
- 94
- 95
- 96
- 97
- 98
- 99
- 100
- 101
- 102
- 103
- 104
- 105
- 106
- 107
- 108
- 109
- 110
- 111
- 112
- 113
- 114
- 115
- 116
- 117
- 118
- 119
- 120
- 121
- 122
- 123
- 124
- 125
- 126
- 127
- 128
- 129
- 130
- 131
- 132
- 133
- 134
- 135
- 136
- 137
- 138
- 139
- 140
- 141
- 142
- 143
- 144
- 145
- 146
- 147
- 148
- 149
- 150
- 151
- 152
- 153
- 154
- 155
- 156
- 157
- 158
- 159
- 160
- 161
- 162
- 163
- 164
- 165
- 166
- 167
- 168
- 169
- 170
- 171
- 172
-
相关阅读:
奇迹mu开服教程:开服服务端的架设及服务器推荐需要那些东西
数据库事务
js 采集pcm,并封装为wav,包含重采样,提供下载
如何进行自动化测试,提高测试效率?
软件测试概念介绍 -- 小白入门必看
一文整明白Researcher ID与ORCID
龙格-库塔(Runge-Kutta)方法C++实现
9.Redis-zset
帮我看看这是什么代码
前端瀑布流怎么布局
- 原文地址:https://blog.csdn.net/qq_38157825/article/details/133384528
