-
Python学习笔记:导入txt、xlsx文件并做简单函数处理
1.txt文件
1.1路径
- file_path = "E:\Python Project\temp.txt"
- with open(file_path) as f:
- content1 = f.read()
导入文件时,如果直接放文件绝对路径上去会报错,这是因为\P是转义字符

所以在绝对路径前面加r可以避免将引号内的内容识别成转义字符(在引号前加上f表示这是一个带有特殊格式的字符串,其中可以包含花括号{}及其中的表达式,其中{}内填充的就是表达式的值)
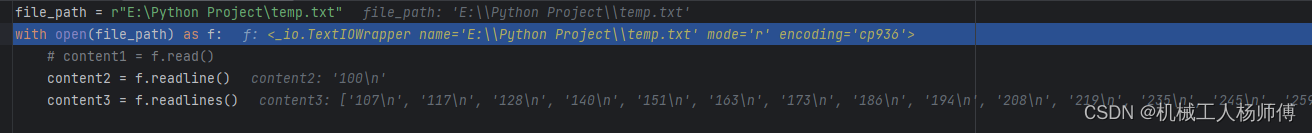
- file_path = r"E:\Python Project\temp.txt"
- with open(file_path) as f:
- content1 = f.read()
或者可以直接使用相对路径
- file_path = "temp.txt"
- with open(file_path) as f:
- content1 = f.read()
相对路径默认识别当前文件夹
1.2文件读取
python读取文件可以采用
- with open(file_path) as f:
- f.read()
也可以写作,效果一样,当然open(file,'r')可以加上文件的读取属性
- file_path = r"E:\Python Project\temp.txt"
- f = open(file_path)
文件内容读取可以通过read、readline、readlines分别读取整个文件、一行、所有行并放在list中,之前读取过的内容后续不会再读出。

2.xlsx文件
2.1文件读取
可以使用panda库的excel_read()
- import pandas
- f = pandas.read_excel(r"E:\Python Project\1.xlsx")
- print(f)
也可以直接使用xlrd库的open_workbook(),但是最新版本xlrd库删除了对xlsx的支持;
- import xlrd
- f = xlrd.open_workbook_xls(r"E:\Python Project\1.xlsx")
也可以使用openpyxl的load_workbook()
- import openpyxl as xl
- f = xl.load_workbook('1.xlsx')
3.练习:对文件数据进行简单的函数处理

xlsx文件中第一列和第二列数据的Pearson系数计算
- import openpyxl
- import pandas
- import math
- f = pandas.read_excel(r"E:\Python Project\1.xlsx")
- data1 = f.values
- print(type(data1))
- sum_ans0 = 0
- sum_ans1 = 0
- for i in data1:
- sum_ans0 += i[0]
- sum_ans1 += i[1]
- ave_ans0 = sum_ans0 / len(data1)
- ave_ans1 = sum_ans1 / len(data1)
- sum_final0 = 0
- sum_final1 = 0
- sum_final2 = 0
- for temp_i in data1:
- sum_final0 += (temp_i[0] - ave_ans0) * (temp_i[1] - ave_ans1)
- sum_final1 += math.pow((temp_i[0] - ave_ans0), 2)
- sum_final2 += math.pow((temp_i[1] - ave_ans1), 2)
- pearson = sum_final0/(math.sqrt(sum_final1) * math.sqrt(sum_final2))
- print(f"Pearson={pearson}")
得到f后通过f.value得到数据的list,后续对list里面的数据进行遍历求解即可
通过openpyxl中sheet.cell也可以实现遍历
- import openpyxl as xl
- f = xl.load_workbook('1.xlsx')
- sheet = f['Sheet1']
- cell = sheet.cell(1, 1)
- print(cell.value)
- list_ans = []
- for row in range(1, sheet.max_row + 1):
- list_ans.append([sheet.cell(row, 1).value, sheet.cell(row, 2).value])
3.1 二维list的求和优化
上面这个练习涉及到了二维list需要对每个list的第一个数字和第二个数字分别对应求和
3.1.1 for遍历
最简单的方式是直接for遍历list
- import openpyxl
- import pandas
- import math
- f = pandas.read_excel(r"E:\Python Project\1.xlsx")
- data1 = f.values
- print(type(data1))
- sum_ans0 = 0
- sum_ans1 = 0
- for i in data1:
- sum_ans0 += i[0]
- sum_ans1 += i[1]
3.1.2sum
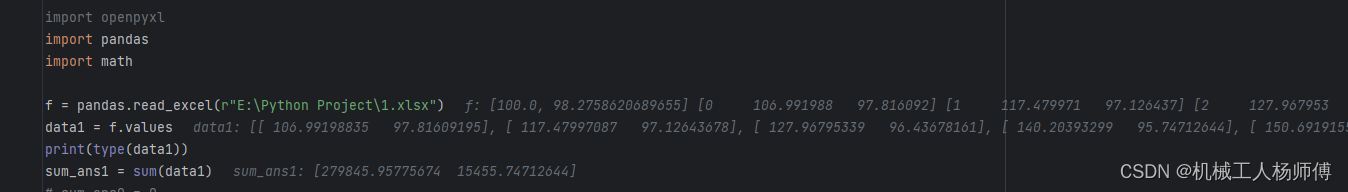
对多维度的list直接应用sum可以分别对应求和
- import openpyxl
- import pandas
- import math
- f = pandas.read_excel(r"E:\Python Project\1.xlsx")
- data1 = f.values
- print(type(data1))
- sum_ans1 = sum(data1)
3.2作图Barchart
- import openpyxl as xl
- from openpyxl.chart import BarChart, Reference
- f = xl.load_workbook('1.xlsx')
- sheet = f['Sheet1']
- cell = sheet.cell(1, 1)
- print(cell.value)
- list_ans = []
- for row in range(1, sheet.max_row + 1):
- list_ans.append([sheet.cell(row, 1).value, sheet.cell(row, 2).value])
- plot_data = Reference(sheet, min_col=1, max_col=2, min_row=1, max_row=sheet.max_row)
- chart = BarChart()
- chart.add_data(plot_data)
- sheet.add_chart(chart, 'c1')
- f.save('1.xlsx')
-
相关阅读:
[A-04] ARMv8/ARMv9-Cache的相关策略
windows 环境变量设置
Mac M1使用UTM安装centos7 x86_64虚拟机
PyTorch中的matmul函数详解
Android超简单的显示网络图片方法
Docker的网络模式
自动化喷涂生产线控制方法概述
python 中__init__ 作用
mysql常用操作集合
表格集算表高性能原理:揭秘纯前端百万行数据秒级响应的魔法
- 原文地址:https://blog.csdn.net/YGZ11113/article/details/132788227
