-
第二章:25+ Python 数据操作教程(第十八节如何使用 Matplotlib 库在 python 中执行绘图和数据可视化)持续更新中
本教程概述了如何使用 Matplotlib 库在 python 中执行绘图和数据可视化。这篇文章的目的是让您熟悉该库的基础知识和高级绘图功能。它包含几个示例,将为您提供使用 Python 生成绘图的实践经验。
目录
-
什么是 Matplotlib?
-
Matplotlib 基础知识
-
用于不同类型绘图的函数
-
条形图
-
线形图
-
散点图
-
饼形图
-
直方图
-
如何添加多个子图
-
有用的提示
什么是 Matplotlib?
它是一个强大的Python库,用于创建图形或图表。它可以满足您在 Python 中的所有基本和高级绘图要求。它的灵感来自于MATLAB
编程语言,并提供类似 MATLAB 的图形界面。这个库的优点在于它与用于数据操作的 pandas 包很好地集成。通过结合这两个库,您可以轻松地执行数据整理和可视化,并从数据中获得有价值的见解。与 R 中的 ggplot2 库一样,matplotlib 库是 Python 中图形的语法,也是 Python 中最常用的图表库。
Matplotlib 基础知识
第一步您需要安装并加载 matplotlib 库。如果您使用Anaconda来设置Python环境,则必须已经安装它。
安装库
如果尚未安装 matplotlib,可以使用以下命令安装
pip install matplotlib导入/加载库
我们将导入 Matplotlib 的 Pyplot 模块并使用别名或缩写形式plt
from matplotlib import pyplot as plt图的元素
标准图表的不同元素或部分如下图所示 -

数字
您可以将该图视为由多个子图组成的大图。子图可以是图上的一个或多个。在图形世界中,它被称为“画布”。

轴
您可以将它们称为“子图”。
轴
这与您在学校或大学学习的内容(x 轴或 y 轴)相同。标准图表显示轴上的标记。在 matplotlib 库中,它被调用ticks,并且刻度中的文本或值被称为ticklabels。
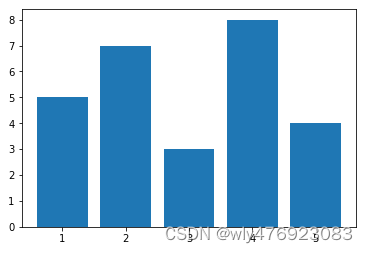
基本情节
- x = [1, 2, 3, 4, 5]
- y = [5, 7, 3, 8, 4]
- plt.bar(x,y)
- plt.show()

如果您使用的是Jupyter Notebook,您可以提交 %matplotlib inline 一次此命令来显示或自动显示绘图,而无需plt.show()在每个绘图生成后输入。
用于不同类型绘图的函数
下表解释了不同的图形以及 matplotlib 库中为这些图形定义的函数。
地块类型
功能
线图(默认)
plt.plot()
垂直条形图
plt.bar()
水平条形图
plt.barh( )
直方图
plt.hist()
箱形图
plt.box( )
面积图
plt.area()
散点图
plt.scatter( )
饼图
plt.pie( )
六边形箱图
plt.hexbin( )
1. 条形图
条形图用于在不同类别或组之间进行比较。假设您想显示城市之间平均年收入的比较。让我们尝试一下基本的条形图。
plt.title("简单条形图") # 图表的名称标题
plt.xlabel('Students') # 指定x轴的名称
plt.ylabel("Math Score") # 指定 y 轴的名称
plt.bar(x, y, color='red') # 更改条形颜色
plt.show()
- plt.title("Simple Bar graph") # Name title of the graph
- plt.xlabel('Students') # Assign the name of the x axis
- plt.ylabel("Math Score") # Assign the name of the y axis
- plt.bar(x, y, color='red') # Change bar color
- plt.show()

您可以使用以下函数设置图表的样式 -
- plt.title( )用于指定绘图的标题。
- plt.xlabel( )用于标记 x 轴。
- plt.ylabel( )用于标记 y 轴。
- color = plt.bar() 中用于定义条形颜色的选项。
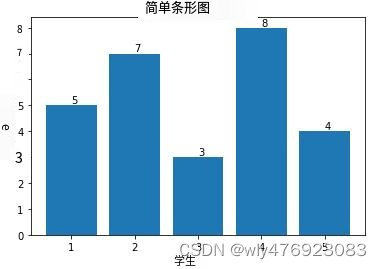
如何在栏顶部显示值或标签
在条形图上显示值并不容易和直接,因为 matplotlib 库中没有用于此任务的内置函数。因此,我们必须编写代码来完成此任务。
条形图 = plt.bar(x, y)
对于条形图中的条形图:
- barplot = plt.bar(x, y)
- for bar in barplot:
- yval = bar.get_height()
- plt.text(bar.get_x() + bar.get_width()/2.0, yval, int(yval), va='bottom') #va: vertical alignment y positional argument
- plt.title("Simple Bar graph")
- plt.xlabel('Students')
- plt.ylabel("Math Score")
yval = bar.get_height()
plt.text(bar.get_x() + bar.get_width()/2.0, yval, int(yval), va='bottom') #va: 垂直对齐 y 位置参数
plt.title("简单条形图")
plt.xlabel('学生')
plt.ylabel("数学成绩")

这段代码是如何工作的?
我们需要了解在每个栏顶部显示标签的逻辑。首先我们需要找出需要显示标签的位置。.get_height()返回每个条形的矩形高度,它基本上是 y 轴的值。为了找到x轴的值,我们可以使用get_x()andget_width()函数。 plt.text()用于在图表上放置文本。 plt.text( ) 的语法
plt.text(position of x axis where you want to show text, position of y-axis, text, other_options)
plt.text(要显示文本的x轴位置、y轴位置、文本、other_options)
我们使用 int(yval) 而不是 yval,因为默认情况下,它以小数形式显示值。
如何隐藏轴
很多时候,我们隐藏 y 轴以赋予条形图美感。为了在 matplotlib 中做到这一点,我们可以利用plt.yticks( )函数。[ ]表示空列表。
plt.yticks([])
如何在条形图中显示字符串值
如果您使用的是matplotlib 2.1 及以上版本, 则操作起来很简单。!pip show matplotlib要检查 python 包的版本,您可以在 Jupyter Notebook 中使用。如需升级,您可以提交代码!pip install --upgrade matplotlib
- x = ['A', 'B', 'C', 'D', 'E']
- y = [5,7,3,8,4]
- plt.bar(x, y)
如果您使用的是 matplotlib 2.1 之前的版本,matplotlib 不会在条形图中的 x 轴上采用字符串值,因此我们需要找到解决方法来解决此问题。解决方案是将字符串值显示为标签,而 range(len(x)) 将在 x 轴上显示 1 到 5 的值。plt.xticks 可用于此任务。它遵循语法plt.xticks(location of ticks, labels, size='small')
- plt.bar(range(len(x)), y)
- plt.xticks(range(len(x)), x, size='small')
plt.bar(范围(len(x)), y)
plt.xticks(范围(len(x)), x, size='小')
水平条形图
如今,分析师更喜欢使用水平条形图而不是柱形条形图进行比较,因为它看起来更专业、更优雅。两种类型的图表都有相同的用途。plt.barh(x,y)用于生成水平条形图。
- plt.barh(x,y)
- plt.title("Simple Horizontal Bar graph")
- plt.xlabel("Math Score")
- plt.ylabel('Students')
plt.barh(x,y)
plt.title("简单水平条形图")
plt.xlabel("数学成绩")
plt.ylabel('学生')

如何对条形图进行排序或排序
要根据值而不是按字母顺序排列条形,我们需要组合两个列表,然后根据列表 y 的值对它们进行排序。zip( )函数用于组合列表 x 和 y 的项目。sorted( )根据 y 对它们进行排序。然后我们将其拆分并存储在 x 和 y 列表中。
- y,x = zip(*sorted(zip(y,x)))
- plt.barh(x,y)
y,x = zip(*排序(zip(y,x)))
plt.barh(x,y)

反转条形顺序
plt.subplot()用于找出当前轴,然后反转函数辅助反转顺序。
- plt.barh(x,y)
- ax=plt.subplot()
- ax.invert_yaxis()
使用专业的图表主题/样式
pyplot 模块中有许多可用的主题。查看内置主题列表,您可以利用这些主题使您的图表更加优雅。
print(plt.style.available)
打印(plt.style.可用)
['bmh', 'classic', 'dark_background', 'fivethirtyeight', 'ggplot', 'grayscale', 'seaborn-bright', 'seaborn-colorblind', 'seaborn-dark-palette', 'seaborn-dark', 'seaborn-darkgrid', 'seaborn-deep', 'seaborn-muted', 'seaborn-notebook', 'seaborn-paper', 'seaborn-pastel', 'seaborn-poster', 'seaborn-talk', 'seaborn-ticks', 'seaborn-white', 'seaborn-whitegrid', 'seaborn', '_classic_test']
我要使用fivethirtyeight主题。
plt.style.use(' Fivethirtyeight')
线形图
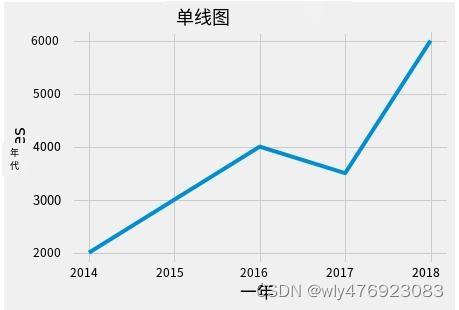
折线图用于显示某些项目随时间的价值。假设您需要显示过去 5 年公立学校学生的通过率。另一个例子——过去五年销售额发生了怎样的变化?让我们为其 创建一个pandas数据框。
- import pandas as pd
- df = pd.DataFrame({"Year" : [2014,2015,2016,2017,2018],
- "Sales" : [2000, 3000, 4000, 3500, 6000]})
将 pandas 导入为 pd
df = pd.DataFrame({"年份": [2014,2015,2016,2017,2018],
“销售额”:[2000, 3000, 4000, 3500, 6000]})
plt.plot( )函数用于折线图。它是默认的图形类型。
- # plot line chart
- plt.plot(df["Year"], df["Sales"])
- plt.title("Simple Line Plot")
- plt.xlabel('Year')
- plt.ylabel('Sales')
# 绘制折线图
plt.plot(df["年份"], df["销售额"])
plt.title("简单线图")
plt.xlabel('年份')
plt.ylabel('销售')

Pandas 可以通过直接从数据框中调用绘图来制作图表。可以通过在kind=选项中定义绘图类型来调用绘图。Pandas 中的情节语法
df.plot(x="Year", y="Sales", kind="line")
df.plot(x="年份", y="销售额", kind="行")
- - 'line' for line plot (Default)
- - 'bar' for vertical bar plots
- - 'barh' for horizontal bar plots
- - 'hist' for histogram
- - 'pie' for pie plots
- - 'box' for boxplot
- - 'kde' for density plots
- - 'area' for area plots
- - 'scatter' for scatter plots
- - 'hexbin' for hexagonal bin plots
- 线图的“line”(默认)
- 垂直条形图的“bar”
- 'barh' 用于水平条形图
- 直方图的“hist”
- 'pie' 表示饼图
- 箱线图的“箱”
- 密度图的“kde”
- 面积图的“面积”
- 散点图的“scatter”
- 'hexbin' 用于六边形箱图
在线图中添加标记
通过使用style=选项,您可以包含可自定义颜色和样式的标记。
- ax = df.plot(x="Year", y="Sales", kind="line", title ="Simple Line Plot", legend=False, style = 'r--')
- ax.set(ylabel='Sales', xlabel = 'Year', xticks =df["Year"])
ax = df.plot(x="年份", y="销售额", kind="line", title ="简单线图", legend=False, style = 'r--')
ax.set(ylabel='销售额', xlabel = '年份', xticks =df["年份"])

您也可以使用这些样式ro, ro--, r+, rD-.。它们指的是圆圈、虚线、点划线。您可以提及任何颜色(“g”代表绿色,“b”代表蓝色,“k”代表黑色等)
.set方法用于添加 x 和 y 轴标签、限制和刻度。也可以像下面的代码一样写——
- ax.set_ylabel('Sales')
- ax.set_xlabel('Year')
- ax.set_xticks(df["Year"])
ax.set_ylabel('销售')
ax.set_xlabel('年份')
ax.set_xticks(df["年份"])
ax.set系列函数 的语法与 plt 等效。造型功能。查看其中一些的比较 -
- ax.set_ylabel() plt.ylabel()
- ax.set_xlabel() plt.xlabel()
- ax.set_xticks() plt.xticks()
legend=False告诉 pandas 关闭图例
以 Pandas 方式添加多条线
在下面的代码中,我们创建一个 pandas DataFrame,其中包含两种产品 A 和 B 的销售额以及时间段(年)。想法是比较产品的销量及其在过去 5 年的表现。
- import pandas as pd
- product = pd.DataFrame({"Year" : [2014,2015,2016,2017,2018],
- "ProdASales" : [2000, 3000, 4000, 3500, 6000],
- "ProdBSales" : [3000, 4000, 3500, 3500, 5500]})
- # Multi line plot
- ax = product.plot("Year", "ProdASales", kind="line", label = 'Product A Sales')
- product.plot("Year", "ProdBSales", ax= ax , kind="line", label = 'Product B Sales', title= 'MultiLine Plot') #ax : axes object
- # Set axes
- ax.set(ylabel='Sales', xlabel = 'Year', xticks =df["Year"])
将 pandas 导入为 pd
产品 = pd.DataFrame({"年份": [2014,2015,2016,2017,2018],
“产品销售”:[2000, 3000, 4000, 3500, 6000],
"ProdBSales" : [3000, 4000, 3500, 3500, 5500]})
# 多线图
ax = Product.plot("年份", "ProdASales", kind="line", label = '产品 A 销售')
Product.plot("Year", "ProdBSales", ax= ax , kind="line", label = '产品 B 销售', title= '多线图') #ax : 轴对象
# 设置坐标轴
ax.set(ylabel='销售额', xlabel = '年份', xticks =df["年份"])

ax=我们通过将其添加到作为轴对象的选项中来包含第二行。它就像同一个图形但有多个轴。
如何改变x轴上的间隔?
假设您想要显示从 2014 年到 2018 年的年份,并在 x 轴上按年份递增。如果值增加 0.5 而不是 1,那么这是一个问题,您应该修复它。见下图 -

- # How to show years with same interval as it is defined in column
- ax = df.plot(x="Year", y="Sales", kind="line", title ="Simple Line Plot", legend=False)
- ax.set(ylabel='Sales', xlabel = 'Year', xticks =df["Year"])
# 如何显示与列中定义的间隔相同的年份
ax = df.plot(x="年份", y="销售额", kind="line", title ="简单线图", legend=False)
ax.set(ylabel='销售额', xlabel = '年份', xticks =df["年份"] )
xticks=可用于更改 x 轴间隔的比例。它将显示您想要在 x 轴上显示的内容的刻度。
散点图
散点图主要用于显示两个连续变量之间的关系。例如,您想要测量身高和体重之间的关系。与折线图一样,它也可用于显示随时间变化的趋势。我们通常在 x 轴和 y 轴上绘制一组点。
kind = 'scatter'用于创建散点图。
- ax = product.plot("Year", "ProdASales", kind='scatter', color = 'red', title = 'Year by ProductA Sales')
- ax.set(ylabel='ProductA Sales', xlabel = 'Year', xticks =df["Year"])
- plt.show()
ax = Product.plot("年份", "ProdASales", kind='scatter', color = 'red', title = 'ProductA 销售年份')
ax.set(ylabel='产品A销售', xlabel = '年份', xticks =df["年份"])
plt.show()

饼形图
饼图是一种圆形图,它将数据分成多个切片以显示每个类别的数字比例。如果您显示百分比,则所有百分比之和应为 100%。

- share = [20, 12, 11, 4, 3]
- companies = ['Google', 'Facebook', 'Apple', 'Microsoft', 'IBM', ]
- comp = pd.DataFrame({"share" : share, "companies" : companies})
- ax = comp.plot(y="share", kind="pie", labels = comp["companies"], autopct = '%1.0f%%', legend=False, title='Market Share')
- # Hide y-axis label
- ax.set(ylabel='')
份额 = [20, 12, 11, 4, 3]
公司 = ['谷歌', 'Facebook', '苹果', '微软', 'IBM', ]
comp = pd.DataFrame({"share" : 共享, "companies" : 公司})
ax = comp.plot(y="share", kind="pie", labels = comp["companies"], autopct = '%1.0f%%', legend=False, title='市场份额')
# 隐藏 y 轴标签
ax.set(ylabel='')
自定义饼图
默认startangle为 0。通过设置startangle = 90,所有内容都将逆时针旋转 90 度。通过使用explode=选项,您可以爆炸特定类别。在下面的程序中,我们将展开前三个类别。
- # Customize Pie Chart
- ax = comp.plot(y="share", kind="pie", labels = comp["companies"], startangle = 90, shadow = True,
- explode = (0.1, 0.1, 0.1, 0, 0), autopct = '%1.0f%%', legend=False, title='Market Share')
- ax.set(ylabel='')
- plt.show()
# 自定义饼图
ax = comp.plot(y="share", kind="pie", labels = comp["companies"], startangle = 90, Shadow = True,
explode = (0.1, 0.1, 0.1, 0, 0), autopct = '%1.0f%%', legend=False, title='市场份额')
ax.set(ylabel='')
plt.show()
直方图
直方图用于显示连续变量的频率分布。假设您想查看学生的分数分布。

- # Creating random data
- import numpy as np
- np.random.seed(1)
- mydf = pd.DataFrame({"Age" : np.random.randint(low=20, high=100, size=50)})
- # Histogram
- ax = mydf.plot(bins= 5, kind="hist", rwidth = 0.7, title = 'Distribution - Marks', legend=False)
- ax.set(xlabel="Bins")
- plt.show()
# 创建随机数据
将 numpy 导入为 np
np.随机.种子(1)
mydf = pd.DataFrame({"年龄" : np.random.randint(low=20, high=100, size=50)})
# 直方图
ax = mydf.plot(bins= 5, kind="hist", rwidth = 0.7, title = '分布 - 标记', legend=False)
ax.set(xlabel="Bins")
plt.show()
bins表示要在 x 轴上显示的间隔数。rwidth显示条形的相对宽度,作为 bin 宽度的一部分。
如何添加多个子图
通过使用 matplotlib 库,我们可以在同一个图形或图形中生成多个子图。Matplotlib 提供了两个接口来完成此任务 -plt.subplots( )和plt.figure()。这两种方式的逻辑都是相似的 - 我们将有一个图形,我们将在图形上一一添加多个轴(子图)。
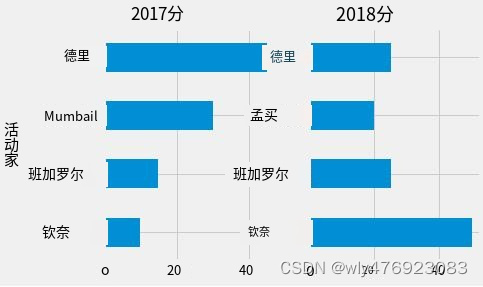
我创建了一个虚拟 DataFrame 来进行说明。在此示例中,我们有 2017 年和 2018 年生活成本分数(假数据!)的城市数据。
- labels = ['Delhi', 'Mumbai', 'Bangalore', 'Chennai']
- x1 = [45, 30, 15, 10]
- x2 = [25, 20, 25, 50]
- finaldf = pd.DataFrame({"2017_Score":x1, "2018_Score" : x2, "cities" : labels})
标签 = ['德里'、'孟买'、'班加罗尔'、'钦奈']
x1 = [45, 30, 15, 10]
x2 = [25, 20, 25, 50]
Finaldf = pd.DataFrame({"2017_Score":x1, "2018_Score": x2, "城市": 标签})
.add_subplot() or .subplots()遵循语法规则 -
- .add_subplot(121) means 1 row, 2 columns and 1st plot
- .add_subplot(122) means 1 row, 2 columns and 2nd plot
- Similarly, .subplots(1, 2) means 1 row and 2 columns
子图(行数、列数、图号)
.add_subplot(121) 表示 1 行、2 列和第一个图
.add_subplot(122) 表示 1 行、2 列和第二个图
同样,.subplots(1, 2) 表示 1 行和 2 列以下两种方法返回相同的结果。它生成两个子图并将它们彼此相邻(水平)放置。
方法一
- fig = plt.figure()
- ax1 = fig.add_subplot(121)
- ax = finaldf.plot(x="cities", y="2017_Score", ax=ax1, kind="barh", legend = False, title = "2017 Score")
- ax.invert_yaxis()
- ax2 = fig.add_subplot(122)
- ax = finaldf.plot(x="cities", y="2018_Score", ax=ax2, kind="barh", legend = False, title = "2018 Score")
- ax.invert_yaxis()
- ax.set(ylabel='')
方法二
- fig, (ax0, ax01) = plt.subplots(1, 2)
- ax = finaldf.plot(x="cities", y="2017_Score", ax=ax0, kind="barh", legend = False, title = "2017 Score")
- ax.invert_yaxis()
- ax = finaldf.plot(x="cities", y="2018_Score", ax=ax01, kind="barh", legend = False, title = "2018 Score")
- ax.invert_yaxis()
- ax.set(ylabel='')

详细说明
这 3 行代码返回空白(空)2 个子图。121指的是左手侧图并且122指的是右手侧图。通过使用ax= object,我们可以使用轴并控制子图的定位。
- fig = plt.figure()
- fig.add_subplot(121)
- fig.add_subplot(122)
如何垂直显示子图
- fig = plt.figure()
- ax1 = fig.add_subplot(211)
- ax = finaldf.plot(x="cities", y="2017_Score", ax=ax1, kind="barh", legend = False, title = "2017 vs 2018 Score")
- ax.invert_yaxis()
- plt.xticks(range(0,60,10))
- ax.set(ylabel='')
- ax2 = fig.add_subplot(212)
- ax = finaldf.plot(x="cities", y="2018_Score", ax=ax2, kind="barh", legend = False)
- ax.invert_yaxis()
- ax.set(ylabel='')

有用的提示
如何保存情节
- # save plot
- x = ['A','B','C', 'D']
- y = [1,2,3,4]
- fig = plt.figure()
- plt.bar(x, y)
- fig.savefig('C:/My Files/Blog/firstimg.png')
- plt.close(fig)
# 保存情节
x = ['A','B','C','D']
y = [1,2,3,4]
fig= plt.figure()
plt.bar(x, y)                                                            Fig.savefig('C:/我的文件/博客/firstimg.png')                            plt.close(图)
如何在轴上设置不同的限制
假设您有一个条形图,并且您想要手动设置 x 轴和 y 轴的限制。plt.subplot()返回轴。在 中set_ylim( ),您可以指定 y 轴的最小值和最大值的限制。同样,您可以在 x 轴上设置限制。
- x = ['A','B','C','D']
- y = [100,119,800,900]
- plt.bar(x, y)
- ax = plt.subplot()
- ax.set_ylim(0,1000)
- plt.show()
如何在图例中显示多个条目
plt.legend(["First","Second"])
plt.legend(["第一","第二"])
如何更改图表中的字体大小、粗细和颜色
- plt.bar(x, y)
- plt.title("Cost of Living", fontsize=18, fontweight='bold', color='blue')
- plt.xlabel("Cities", fontsize=16)
- plt.ylabel("Score", fontsize=16)
plt.bar(x, y)
plt.title("生活费用", fontsize=18, fontweight='bold', color='blue')
plt.xlabel("城市", fontsize=16)
plt.ylabel("分数", fontsize=16)
锻炼
通过这个练习,亲自动手。使用 dataframe 准备如下所示的图表finaldf。注意图表的每个部分并尝试复制它。在下面的评论框中发布您的解决方案。

尾注
我希望这篇文章能让您对 matplotlib 库以及如何在 Python 中自定义生成绘图有一个清晰的了解。您的下一步应该是使用一些示例或公开可用的数据集(可在 UCI 机器学习存储库和 kaggle 网站上找到)进行练习、练习和练习。
-
-
相关阅读:
three.js问题记录---MeshLambertMaterial材质颜色失效
Python学习笔记五之错误与异常处理、面向对象实例
Windows下Redis3.0集群搭建
springboot整合websocket开箱即用
xstream运用,JAVA对象转xml,xml转JAVA对象
【名词从句的练习题】名词从句的虚拟
基于SpringBoot+Vue的疫苗接种管理系统
如何在Linux搭建MinIO服务并实现无公网ip远程访问内网管理界面
JavaScript 对象增删改查 + 遍历对象+内置函数 + 随机对象
【关于我接触了Uview的Upload】——单图上传,多图上传,遇到的问题总结、直传阿里云Oss
- 原文地址:https://blog.csdn.net/wly476923083/article/details/132841230